Wyckoff distributionwhen the distribution phase is completed the Oil will fall to $50 to prepare for $400.
Brentoil


Oil Futures Settle Lower On Demand WorriesDespite concerns about a potential recession, oil prices were still around $114 a barrel today as supply concerns outweighed concerns about a potential decline in demand. In the latest developments, workers in Norway went on strike, which is expected to cut the country's oil production by around 130,000 barrels a day.
Despite the global economic recovery, oil prices are still up more than 50% this year as the conflict in Ukraine and the lack of supply from other producers such as Russia have raised concerns about the supply of oil. OPEC+ has also been struggling to boost its production due to various factors. In addition, the Federal Reserve's aggressive monetary policy has also triggered a sell-off in commodities.
Investors are also closely monitoring the situation in China, where the country is still experiencing sporadic outbreaks of the virus.
Brent & Natural Gas PricesBrent Crude is around $111.36, as investors grew concerned about a potential global recession and the tight supply of crude. Data from the Organization of the Petroleum Exporting OPEC Countries showed that its output fell by about 100,000 barrels per day in June.
Libya's oil exports have dropped to between 365 and 409 thousand barrels per day, which is about 865 thousand barrels below the level that was normal. Also, a planned strike in Norway will reduce the country's oil production by about 130 thousand barrels per day. Despite the recent rise in oil prices, the market is still expected to remain weak in the coming months due to the global economy and the lack of supply.
Natural gas prices in Europe started July at around 150, which is a level not seen since early March. The rising prices are expected to continue due to the tight supply of gas. A strike by workers in Norway this week is also expected to reduce the country's gas output by around 292,000 barrels per day. This could threaten the European Union's efforts to increase its storage capacity.
Due to the reduction in Russian gas flows through the Nord Stream pipeline, Germany, which is the EU's largest economy, has enacted the second phase of its emergency gas plan. It involves increasing the monitoring of the market and the restart of coal-fired power plants.

US Oil Battles With 2011 HighThe price of US Oil has not consistently traded above the May 2011 high at $114.79
since the high was formed as price has not remained above this level.
Price did move above this resistance in March, May, and June, but the sellers forced
price back down again.
We have a major support level below price in the form of the $100 round number,
which may prevent price from declining further.
So far this month, the candle is bullish, but this could change as we are only a few
days into the month. If the buyers can gather enough momentum, we should see
another attempt above resistance.
There is nothing to do now except wait for a clear trend direction to form. Trying to
go long now could see your position close out for a loss if price reverses sharply at
resistance again.
If you like enjoyed this post, make sure to like, and follow for more quality content!
If you have any questions or comments, comment below. We reply to every comment!
See below for more information on our trading techniques.
As always, keep it simple, keep it Sublime.

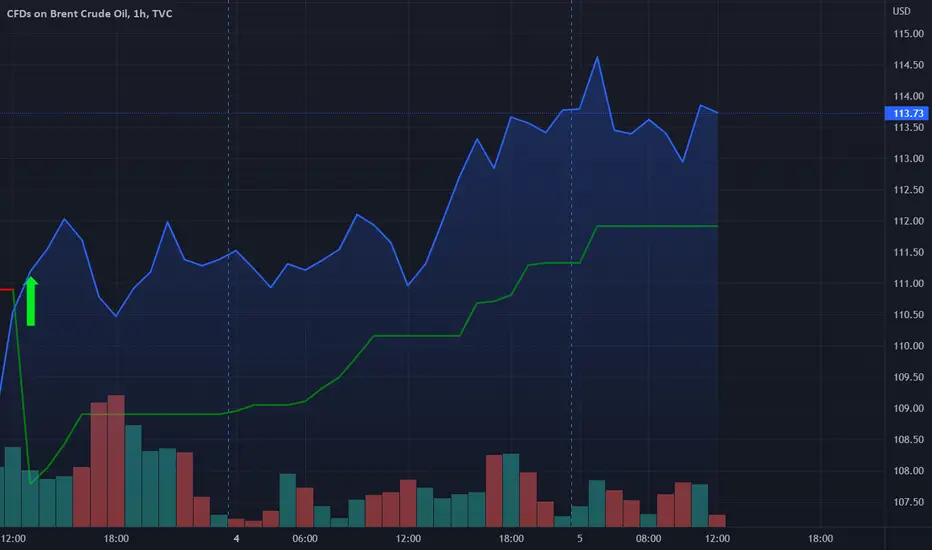
Long Oil - Target 120+Downside is limited. Inflation is real. Fibo 61.8 can be achieved easily (the green line) . Good luck.

Caps on russian oil is likely to come Insider: G-7 talks with India and China on oil price brake positive
G-7 talks with India and China on a plan to cap the price of Russian oil have been positive, according to an insider. The two buyer nations have incentives to comply, a person familiar with the discussions says. A cap on the price has not yet been set, he said. However, it would have to be high enough for Russia to continue producing anyway. Currently, Russian oil sells at discounts of between $30 and $40 per barrel (159 liters) compared to market prices of up to $120 per barrel. Source: Welt Zeitung
What impact would the price cap have on prices in Germany and the other G7 countries?
In the ideal case, oil prices would fall; in the less good case, at least they would not rise any further. However, precise forecasts are difficult to make. The petroleum industry association Fuels und Energie already explained in the discussion about the EU oil embargo that market and price developments depend on many factors, including the dollar exchange rate and decisions by the major producing countries. Source: n-tv
Opinion: I see the price cooling down slowly rather than continuing to climb, probably going towards 70$ in the next 6-10 months. To force russia to sell all its oil below market price, will make most countries of the world (which are not part of G7) to buy it off for a small price, leading to an overall relaxation of the oil market price. Also OPEC is ramping up efforts to increase output for the next months! This is not an investment advise! Do your own research! This is NOT a recommendation to buy or sell oil shares and this is NOT a recommendation to short or to long oil!

ADVANCED SETUP ON USOIL !!!The chart above is for the USOIL symbol. Two important key resistances have been identified that can trigger the pullback, in which direction we are looking for the right point to enter.
I have identified two areas. The first of which is a bit risky, but second is much safer.
*Trade at your own risk, please.

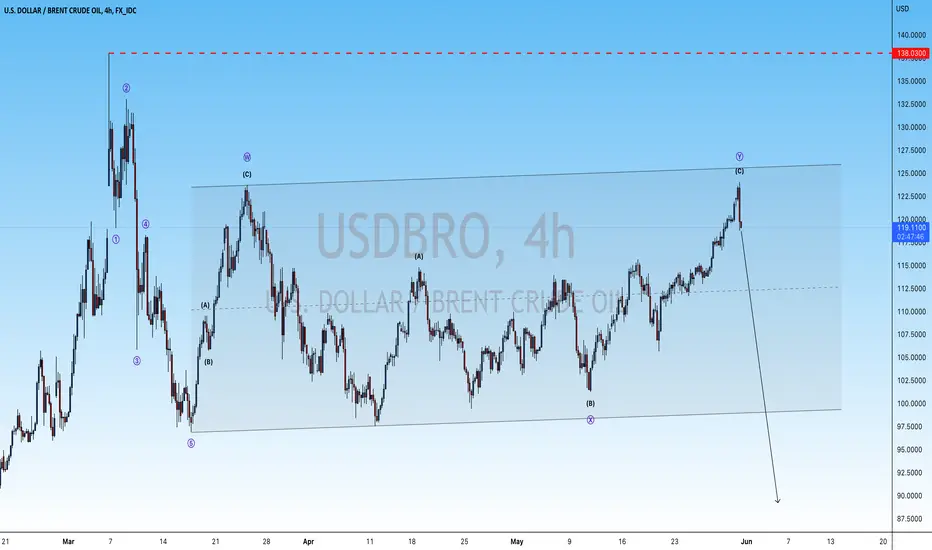
USDBRO SELLHi fellow traders, Brent crude oil is completing the flag correction in WXY formation. We can look for downside from here. Target 90 area. Goodluck!
XAUUSD 4H TA Result : +100 Pips ✅Just compare 2 previous analyzes of #Gold in the 4-hour timeframe , you will see how the price reacted to the level (OB+) and increased more than 100 Pips , that was so fast, the main reaction in the one-minute timeframe is more clear!
⚠️ This Analysis will be updated ...
👤 Arman Shaban : @ArmanShabanTrading
📅 06.24.2022
⚠️(DYOR)
❤️ If you apperciate my work , Please like and comment , It Keeps me motivated to do better ❤️

Brent: Knock, Knock!After it has knocked at the resistance line at $112.43 already twice, we expect Brent to rise above this mark and into the white zone between $113.88 and $123.14 to finish wave (2) in white. Afterwards, Brent should fall below the support lines at $104.67 and $97.56. There is a 28% chance, though, that Brent could soar through the white zone and climb above the resistance at $123.71 until the bottom of the pink zone between $133.80 and $137.40 first before moving downwards.

Be careful.Macd indicator and support line must be followed.
* None of what i write here is not an investment advice. Please do your own research before investing in any digital asset.
* Never take my personal opinions as investment advice, you may lose your money.

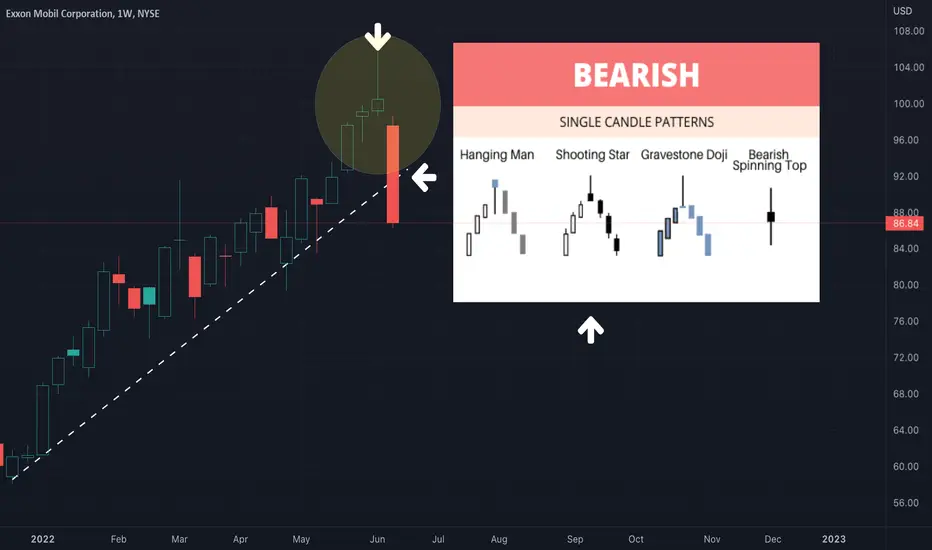
ExxonMobil Shooting Star PatternThe weekly candles for the oil and gas company, ExxonMobil, look quite bearish. This could be the start of a major decline. There is a shooting star pattern forming on the weekly chart, while the oscillators are trending down and while the daily EMA exp ribbon and daily trend lines breaking down. Although anything can happen, it is looking like a major bearish reversal is occurring. It's sad that just last week all the "expert analysts" at CNBC were making strong bullish calls about energy stocks, citing "free cash flow" and numerous other reasons to buy them, all the while the charts are showing a topping pattern in energy and commodities. This is usually when tops form - when there is no bearish sentiment among anyone, and when strong hands are selling to weak hands. At least charts do not lie, and thanks to @TradingView anyone can access them alongside a plethora of crowd-sourced scripts and indicators.

please no more fuel cost increaseoil could be heading to further highs, if the daily breaks the previous high then expect further rallying. buying any drops to the trend line until a clear reversal is in

OIL WONT BE COMING DOWN ANYTIME SOONThe war in Ukraine caused a chain reaction in lifting energy and commodity prices, following the decision of the West to reduce and eventually ban Russian imports of crude oil, natural gas, coal and a number of other raw materials. As a result of this, there continues to be a shortage in oil supply in the global markets. The fact that there is underinvestment in this sector and falling inventories continue to allude to a tighter market in general. Throw in the fact that Russia supplies are being phased out with little to no immediate substitutes, the tighter market outlook is going to stay for longer. The capacity shortage and the fact that OPEC+ is also not doing much more than they are now isn't going to help alleviate sentiment on that front either.
Significantly higher prices of energy and raw materials caused a rise in prices of final products that contributed to the second cause of rising inflation – cost-push inflation, while the strong rise in prices, accompanied by persisting supply disruptions, resulted in the shortage of products that pushed their prices higher and pointed to the third cause of strong prices growth – demand-pull inflation. This sparked a rise in food prices, electricity and many other essential items that contributed to the enormous increase in the cost of living, further pressuring households and businesses.
The West is working with Venezuela and Iran to bring back their oil to the global markets to boost supply but after Iran turned off 27 cameras of the International Atomic Bomb Agency, which monitors compliance of uranium-rich countries to a peaceful application of nuclear energy to promote peace, health and prosperity, it looks unlikely that a deal with Iran will be reached soon.
Barclays, Goldman Sachs, Citibank and other major banks forecast that oil will likely break its all-time high price of $127 per barrel on 8th March, 2022 and rise towards $135 per barrel. So brace yourselves folks as we ride this oil roller coaster.

Gas prices to rise 5-10%Due to the lack of supply from the OPEC and the US' production slowdown and the Russian invasion of Ukraine, the prices of gas have increased significantly.
In the next couple of weeks, the prices of gas are expected to increase by 5-10%. This will continue to increase throughout the summer of 2022. China's demand for crude oil is expected to rise as the Covid Lockdowns come to an end.
Crude Oil Prices are likely to remain above $115 for the rest of the year.

bullish brentbrent price going bearish in at least 2days. as you can see the price touched the resistance and stayed on the middle. i think this is going to touch 117$ tonight or tommorow before the weekly report of usoil meeting.

USOIL NEAR TERM OUTLOOK - 01 JUNE, 2022Holla Amigos,
With what looks like a wedge formed by price actions on USOIL, price may yet see a tremendous fall this month.
We wait and see.
Kings.

BRENT OIL - LONG TERM ANALYSISBRENT OIL - LONG TERM ANALYSIS , DISCLAIMER: Use this analysis by your own risk

Oil Breaking outOil in very tight range for last few days. It can break out from here. Buy order placed above the high of yesterday.

Brent: GlueyBrent is currently glued to the resistance at $114.74, where it has finished wave b in blue. However, we expect it to let go of this mark soon to fall into the turquoise zone between $101.67 and $99.83. There, it should complete wave a in turquoise and move back above $104.67 afterwards to finish wave b in turquoise. After that is settled, Brent should gradually fall below the support lines at $104.67, $97.56 and $93.57. There is a 40% chance, though, that Brent could climb above $114.74 and make a detour through the green zone between $117.78 and $133.52 first before moving downwards.

WTI longcrude oil was in very much danger this week from the beginning.
However it reached to the safe zone.
Which means next week will be very bullish to crude oil.
EU couldn't make deal to ban russian oil. But eventually they will succeed to ban russian oil by negotiate with Hungary.
