Brentoil

BRENT GIVE US OPPORTUNITY FOR PROFITBrent recently has reached a strong support line near 57. As in the last time I expect to see a reversal pattern and we can seize this moment!
Buy 58.85
Sell 61.86
Stop-loss 57.06
Risk Reward ratio is 2.4


USOIL Price Action Analysis | A Relative Long Term IdeaCrude Oil has found a support on the Equilibrium Zone of the Trading Range, again. This accumulation in the upper range seems like it will coming to an end. On the other hand, it needs to reclaim the Pivot first and then the Range High.
Entry: 54.6
SL: 49.9
TP-1: 62.4
TP-2: 66.4
TP-3: 72.4
TP-4: 81.4
R/R: 5.7
Please let me know if you have any suggestions or any ideas to add. I can also give you more detailed explanation for this specific trade setup.
The ideas published here are not financial advices.

...as Buyers looks to push the Price of BRENT higher.When there is a will, there will always be a way! Buyers are aiming to get Prices as high as 70.00 for UKOIL aka BRENT(XBRUSD) medium term.
Longer term - Invariably the overall goal for Buyers is to get Prices for this sweet juice trading above $100 per barrel, actually up to around $108.00 mark, all this culminating from activities of the early days in 2016 with precise origins at the beginning of the year before(2015) but this motive was not supported throughout that year.
Mavintrades - Only the Technicals are considered at Mavintrades and no single thoughts/interest afforded to any sort of Fundamentals in all our study..


BRENT OILBRN
BRENT OIL
BRENT CRUDE
BREBT OIL ANALYSIS
--------------------
Be Different ...
Hamid Rahathagh

USDBRO reversed from resistance, potential drop!
USDBRO reversed off its resistance at 59.71 where it could potentially drop further to 58.50.
*Disclaimer.*
Trading leveraged products carries a high level of risk and may result in you losing substantially more than your initial investment. Pepperstone Group Limited is licensed and regulated by the Australian Securities and Investments Commission (AFSL 414530). Pepperstone Limited is authorised and regulated by the United Kingdom Financial Conduct Authority (FRN 684312). This information is not intended for distribution to, or use by, any person in any country or jurisdiction where such distribution or use would be contrary to local law or regulation.


USDBRO bounced from support, potential for a further rise!
USDBRO bounced off 58.95 where it could potentially rise further to 61.40.
*Disclaimer.*
Trading leveraged products carries a high level of risk and may result in you losing substantially more than your initial investment. Pepperstone Group Limited is licensed and regulated by the Australian Securities and Investments Commission (AFSL 414530). Pepperstone Limited is authorised and regulated by the United Kingdom Financial Conduct Authority (FRN 684312). This information is not intended for distribution to, or use by, any person in any country or jurisdiction where such distribution or use would be contrary to local law or regulation.

UKOIL - Higher prices!Hello my dear friends,
Brent Oil is at very important support level and it's expected to bounce back from this support toward higher levels.
If you like our analysis, Join our Telegram channel, the link in our profile.
Good luck and happy trading!

WTI > TEMPORARY LONG & BIG SHORTas described in the chart ,
expecting a temporary upside for oil prices.
after that another big sell-off may follow that.
good luck.

Brent Crude Oil Breakout. Stock Market Signal?We had a break out on UK Oil here on the 4 hour chart. US Oil is at the breakout point:
Oil has been in a prolonged downtrend with lower highs and lower lows. We began basing at the 57.50 zone on Brent.
From here, we began to show exhaustion of the trend and it appears we have made our first higher low here with the higher high. For those that are more conservative, perhaps see how price reacts at 60.
For our target, it would be the 62.75 zone although be sure to see how price reacts at the 61.30 zone.
A lot of talk about the Turkey Syria situation, however as I discuss in my post regarding Aramco, Oil is bearish due to recession fears however any geopolitical events will prop Oil.
In fact, it seems Oil must be propped. When Oil fell below 25 in the last down move, Oil companies were about to go under. Governments basically forced the banks to loan money to these Oil companies...the banks knew these Oil companies would never be able to pay back. They are essentially "zombie" companies.
So is Oil does fall a large percentage, not only will these Oil companies be in trouble, but also the banks which loaned to them.
For the US markets, Energy and Finance are the two largest components. If those two sectors are up, the overall markets are likely to be up. If we see a move higher in Oil as expected from these set ups, expect equities to follow.
No more free markets folks. everything really needs to be managed due to financial engineering our central banks used to generate growth...rather than growth from underlying fundamentals.
USDBRO bounced from support, potential for a further rise!
USDBRO bounced off 58.95 where it could potentially rise further to 61.40.
*Disclaimer.*
Trading leveraged products carries a high level of risk and may result in you losing substantially more than your initial investment. Pepperstone Group Limited is licensed and regulated by the Australian Securities and Investments Commission (AFSL 414530). Pepperstone Limited is authorised and regulated by the United Kingdom Financial Conduct Authority (FRN 684312). This information is not intended for distribution to, or use by, any person in any country or jurisdiction where such distribution or use would be contrary to local law or regulation.

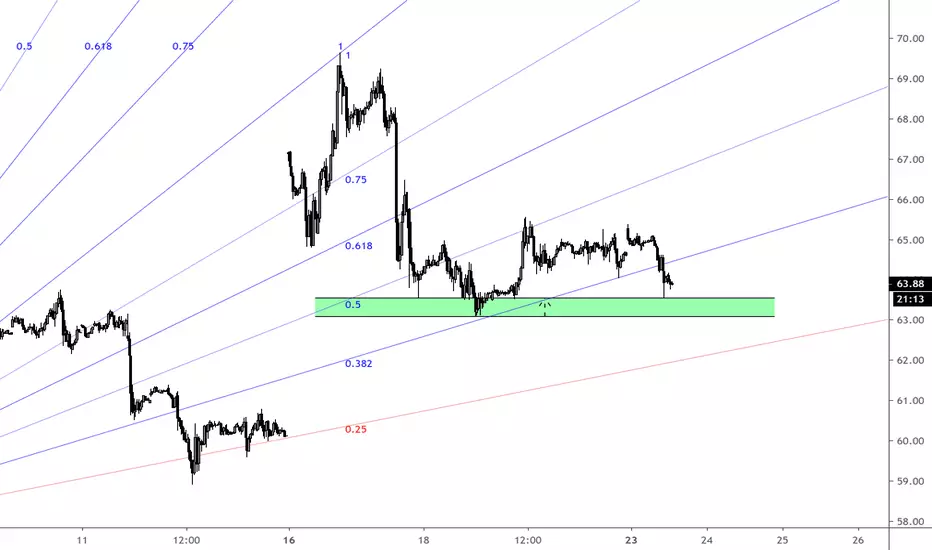
Oil Will Be Forced To Breakout - Will It Be To The Upside?Support and resistance are converging for brent oil . In the coming days, it will be forced to break out either to the upside or downside. Subsequently, a strong trending phase could ensue. Following the volatility after the Saudi attack last month, brent oil retraced back to prior support around $57.40, as shown in the chart.
Support around this area comes not only from identifying it as a prior support level but also from a Fibonacci extension of the final upward swing in the prior move to the upside shown by the yellow Fibonacci levels. The range was derived from the 4-hourly chart, which shows the final swing more clearly.
The price range between the low labelled A and the high labelled B is divided by significant Fibonacci ratios. The 2.618 level coincides very closely with the prior support level . The market has already found support from both the green horizontal level and the yellow 2.618 level.
The white box represents the horizontal support zone established between the green line and the 2.618 extension level. Also in the chart, a Fibonacci/Speed fan is constructed from the range between point X and point Y. Notice that the 0.25 trendline acts as falling resistance for most of the downtrend from X. The market did break above the 0.25 trendline for a short period, but has fallen back below. The price is currently enclosed in a triangle formed by the support zone below and the falling trendline from above. This triangle will end soon, forcing the market to break one of these barriers.
Breaking through one of these barriers will probably have a significant effect on price action for some time. Breaking below the support zone could give the market enough momentum to take prices much lower.
On the other hand, breaking above the 0.25 trendline could give bulls the boost they need to reverse the entire trend. It’s important to watch which barrier is broken in the next few days, but also the manner in which it is broken. The strength of the breakout could suggest the strength of the trend which will follow.

Oil Will Be Forced To Breakout - Will It Be To The Upside?Support and resistance are converging for brent oil. In the coming days, it will be forced to break out either to the upside or downside. Subsequently, a strong trending phase could ensue. Following the volatility after the Saudi attack last month, brent oil retraced back to prior support around $57.40, as shown in the chart.
Support around this area comes not only from identifying it as a prior support level but also from a Fibonacci extension of the final upward swing in the prior move to the upside shown by the yellow Fibonacci levels. The range was derived from the 4-hourly chart, which shows the final swing more clearly.
The price range between the low labelled A and the high labelled B is divided by significant Fibonacci ratios. The 2.618 level coincides very closely with the prior support level. The market has already found support from both the green horizontal level and the yellow 2.618 level.
The white box represents the horizontal support zone established between the green line and the 2.618 extension level. Also in the chart, a Fibonacci/Speed fan is constructed from the range between point X and point Y. Notice that the 0.25 trendline acts as falling resistance for most of the downtrend from X. The market did break above the 0.25 trendline for a short period, but has fallen back below. The price is currently enclosed in a triangle formed by the support zone below and the falling trendline from above. This triangle will end soon, forcing the market to break one of these barriers.
Breaking through one of these barriers will probably have a significant effect on price action for some time. Breaking below the support zone could give the market enough momentum to take prices much lower.
On the other hand, breaking above the 0.25 trendline could give bulls the boost they need to reverse the entire trend. It’s important to watch which barrier is broken in the next few days, but also the manner in which it is broken. The strength of the breakout could suggest the strength of the trend which will follow.

UK OIL longDouble bottom on the price of UK OIL with bullish divergence on the RSI on the daily chart,
Good entry for longs and taking profits at $62 where the 20 MA is at at the moment , price in case of an uptrend most likely will travel towards that level,
Also Fibonacci taken from the high to low of the descending channel we have been trading in for the last few days gives a 0.382 level around that price as well creating a zone of confluence.
Also switching to the 4 hour chart and having a closer look to that descending channel , the MACD shows exhaustion on sellers as prices moves lower which is another type of divergence.

BCOUSD Brent Wolfe WaveWolfe wave and double bottom indicating possible retrace setting up with potential target at the .5 fib zone. As always, price can go against us and a good risk management strategy is key.

Buy opportunityWe tested the bottom of the white channel and bounced - I'm waiting for the growth to its top or to the top of the current sideways motion and then short the bounce.

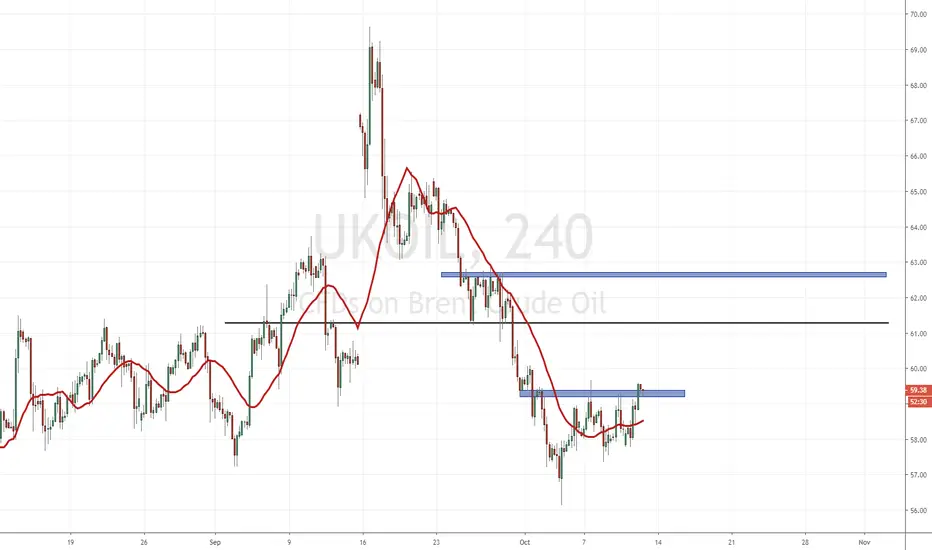
Brent falls to short term support againBrent has fallen once again to the top of the support zone in use since the attack on Saudi infrastructure. Bulls will be on the lookout for a reversal here.
CURRENT OPEN POSITIONS...EURAUD, USDNOK, AUDJPY, BRENT CRUDE OILIn this video update, we take a look at our current open positions to give an update of where we are at.
EURAUD has moved significantly towards targets as well as AUDJPY.
The daily timeframe suggested the AUD was going to weaken and we are seeing that play out at the moment.
USDNOK remains bearish and was close to targets before rebounding, looking for the momentum to pick up here as the price has remained range-bound.

brent shortlike you see we will short from these levels...
but...
after we see "price action" in these levels...
goodluck ....
