Crude Oil Elliot Wave IdeaAn update to this idea >
The triangle appears to have broken out to the upside and if the sideways movement between 13th August high of 57,43$ and 3rd September low of 52,87$ was wave 2 then we could be in for a big move upwards towards 63,99$ (1.618 extension).
Breaking the high at 58,79$ is critical to this theory.
Brentoil

Crude Oil Elliott Wave IdeaFollow up on this idea on smaller timeframe >
Since the bounce from 5482$ there appears to be another 5 waves up from that low to 5726$, hitting the .382 extension perfectly. May now see another mini correction before another new high.
A break below 5481$ would invalidate this idea.

Crude Oil Elliott Wave IdeaA theory that all this sideways trading since we hit the 5740$ high in mid August has been a complex correction to the move up from 5050$.
C wave may have finished at 5280$ and if we completed 5 impulse waves up from that low to yesterdays high at 5770$ then we may see a correction before another move up and a new high.

OIL: Double Equilibrium! Break Coming Soon!Hello dear energy sector friends and USOIL traders, hope you're doing well guys! ;)
Oil is now in a double Equilibrium range, both on the Daily & on the Weekly. I'm gonna walk you through how to play the break in either direction. Have fun watching! ;)
If you had some value from my analysis, give it a thumbs-up & comment it, because the mechanism shows my analysis to other people then. Make also sure to follow me so you get notified on my analyses! I wish you a good trading! :)
Edgy is providing online education only. We are not a financial advisor, nor do we hold any formal qualifications in this area. You're trading at your own risk. No matter what you do, please set your stop loss. Please be aware, that you can lose all your money on the online exchanges.

Spitting Thoughts : I missed another setup for OILRead my XAUUSD Fomo post. Basically my thoughts are the same. Just change XAUUSD to OIL.

Brent Crude Breakout?Awaiting for the close to confirm this breakout. Of course this would be a trade. I am still of the opinion that a recession is coming (or we are already in one) and oil will struggle. Really only geopolitics can change that.
However, on Brent crude, we had a downtrend and failed to make more lower lows. Indicating that the buyers were stepping in and the trend was changing.
We appear to be getting a confirmed break above this resistance level. Just awaiting the close.
There is a flip zone at the 64.10 zone so watch how price reacts there.Otherwise 65 may be in the cards.

BRENT 3 WAVE PATTERNhello traders ,
expecting a 3 wave corrective move for UKOIL .
big bullish move in 2020-2021.
good luck.

Crude Oil Harmonic Crab PatternThere appears to be a perfect Harmonic Crab in crude oil.
Could be a good trade with a stop loss below last weeks low.


BRENT - Important levels before US Oil Stocks announcementGlobal markets started this week following new tarriffs and statements between US and China. President Trump wants to decrease import of goods from China and also mentioned that US should undertake necessary steps to replace Chinese products. At G7 summit Trump pointed out that new economic and trading partnership with EU will be put on place. Also President Trump made a giant statement that he is ready to negotiate and meet with Iran's President Mr. Hasan Ruhani.
These news, although sounds speculative but resulted markets inpredictable movements and uncertanity in Asian markets.
UKOIL prices following a downtrend recently tested the psychologic resistance of 60USD. Tomorrow at the US Crude Oil Stocls announcements we are expecting a dropdown of crude oil stocks to 2.133M. This could support the trend reversal of the UKOIL prices and pump the price upwards. For short-term we can surely say that the price will test 60.27 and 61.00 resistnaces. Following resistances are 63.00 and 64.15. Brent in general is in a downtrend since the beginning of the year, we do not expect the price to be above 65.00 which is a very strong resistance, and sellers will do anything to bring the price down from there. Let's follow the price to test 58.35 and 57.60 supports and move towards 61.00.
Support 1 :58.35
Support 2 : 57.60
Support 3 : 56.20
Resistance 1: 64.15
Resistance 2: 63.00
Resistance 3: 60.27
For other analyses (fundamental or analyses based on news and global reports) follow trend analysis rules
Good luck to everyone! Click the follow button to stay tuned for more trading ideas!
Like the idea? Hit the like button!

Is Brent Oil Heading towards 36 in a couple of MonthsIf respite do not come for Brent Oil in terms of buyers to increase demand between 50 and 55.25, the black gold is likely to make a higher low at around 36 in a couple of months. Looking at the chart, it took Brent Oil about two and half years to rally from its low at 27.08 in January 2016 to its high at 86.72 during October 2018. Since after that, it has being on a decline. Using this assumption one can expect Brent Oil to make another low around 36 (if demand is not drastically increased around 50 mark), in the next 2 years - 2021.
OPEC, Non-OPEC countries and unconventional oil & gas producing countries actions and inactions have a big role to play in determining the future of the price of oil within this period...
This analysis is based on my technical analysis opinion and not to be construed as a trading advise.
PLAN YOUR TRADES AND TRADE YOUR PLANS


Crude Oil Elliott Wave IdeaABC theory with C wave ending soon or near the .618 extension/.618 retracement level at $53,15

Crude Oil Elliott Wave IdeaA follow up on previous ideas:
My thinking is the triangle breaks out soon and that wave B (white) of Y (yellow) at the recent low at 505X is complete and ultimately head towards high $60's.
Alternatively the triangle is traded a little longer with one more visit to the $50 area before breakout.


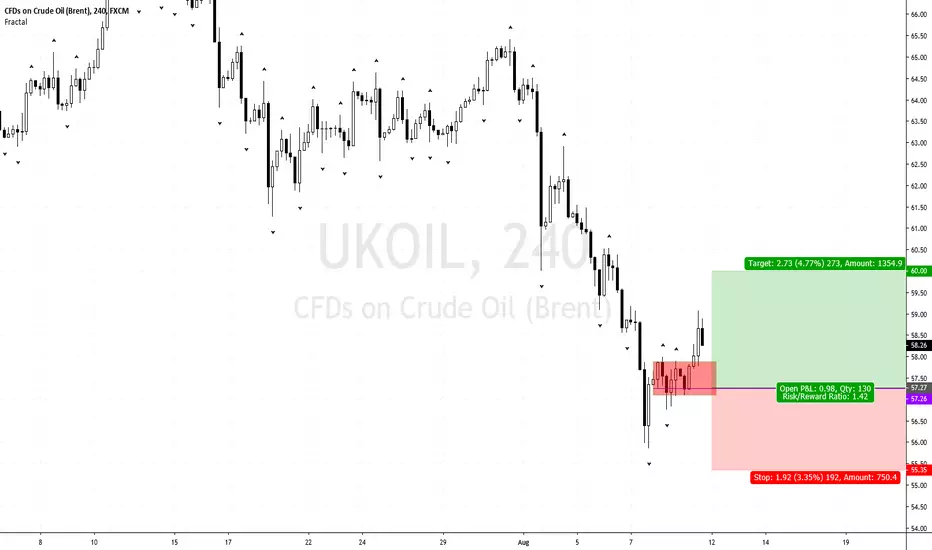
BRENT dip to 57.25 is still a buy on H4Brent oil is expected to make a pullback on H4 timeframe before making another uptrend to a 60.00 zone or to 65 level if this week crude oil inventory is well below the forecast .
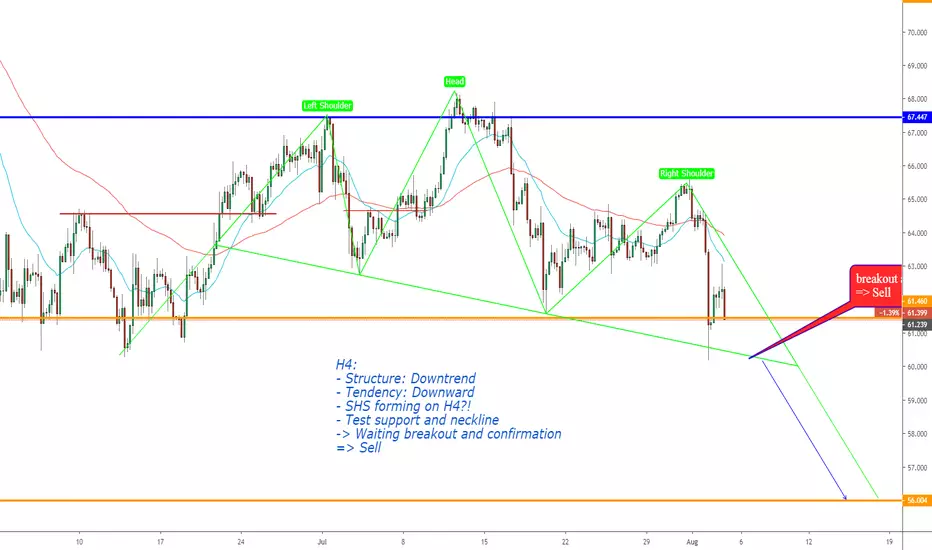
BCOUSD, Sell on H4.BCOUSD, Sell on H4.
H4:
- Structure: Downtrend
- Tendency: Downward
- SHS forming on H4?!
- Test support and neckline
-> Waiting breakout and confirmation
=> Sell

UK OIL UPSIDE PUSH TO FOLLOW?Hi fellow traders.
Looking at UKOIL right now, we can see that the RSI indicator has fallen towards the oversold region and is currently looking for a rally to the upside. Considering that UK Oil Supply is to remain the same, and with the UK Iran Oil Tanker tensions rising, it looks like UKOIL could look to push to the upside.
At this point in time 64.20ish would be an ideal buy in position region. I have been considering a buy position from 64.05.
Additionally, we can see that we could be rebounding from a critical support level at 63.90. In this case, it looks like it could be the perfect time to long this pair.
For a quick bullish squeeze out of this pair, the main ideal target would be around 63.56.
For a longer swing on this pair for a few days, looking from a bullish price action point of view, 65.00 region could be an ideal take profit region.
Stops should look to be placed around the previously mentioned critical support level of 63.90.
If you managed to read it this far down, thanks for reading this! If you could, please do offer your ideas & perspectives on this pair. Buy or Sell and why? Additionally, drop me your charts for it, that'd be great so I can see where you are coming from. I'm a new guy to the FX & Crypto market, trying to learn FX & Crypto, and I'd appreciate any help people may offer!
Please drop a follow! I need reputation points!!

Crude Oil Elliott Wave IdeaA smaller timeframe idea following from some recent ideas.
1.618 was hit so if this count is correct then we could be starting subwave 4 of 3 (or C); a break below $56,96 would invalidate this count.
If the $60 area is the end of wave C then there could be a big drop in price below $54,70:
If the $60 area is the end of wave 3 then there could be a 4th and 5th wave to new highs and continue a bullish wave towards $70:

Crude Oil Elliott Wave IdeaA similar idea to the ideas below but a bearish move in between:
Looks like a bearish flag if you compare to the previous one; 0.618 is at $5860 which is where the daily EMA200 sits currently:
