Brentoil


Crude Oil Elliott Wave IdeaUpdate to a few recent ideas:
Oil may still be in wave 4 and beyond the .236 retracement level but heading towards the .382 level at $55,67; there appears to be a channel down also where wave 4 could terminate before the 5th and final wave below $50.

OILLong and hold to 60 with an extension to 63. Then wait and see if it holds.
Likely scenario we will see oil drop from there, down to the 50's if not 40's at the end of the year.

Crude Oil Elliott Wave IdeaUpdate to a few recent ideas:
Smaller timeframe >
Larger timeframe >
Wave 3 could be at, or near an end now with an extended wave 5 (white) of 3 (yellow) hitting 1.414 extension; If wave 3 is over then wave 4 may follow to the .236 level before the 5th and final wave below $50.

Now Bulls are coming! Crude OilThe past month was super bearish. As looking at the past oil price is always take longer to climb up but it collapses in just a few days.
With the production cut from OPEC, I highly doubt that we will see below $50 again. Simple Fibonacci retracement shows below $51.5 is a full 61.8% retracement from the bullish run that started in December. It is better to fill buy order on the green area.

BTCUSD I see direct correlation of bitcoin with oil priceThe correlation of oil price with bitcoin is quite visible.
Means any time the price of oil rises some of the profit is pumped into bitcoin.
As well the crush of oil price results to crush of bitcoin.
In this sense I guess the next crush of oil price, that is expected in may will lead again to crush of bitcoin market.

Resistance & Support levels for #Brent_OilIf the Brent Oil breaks the region of 60-62 (an authentic support region)... it can visit the region of 49-52.

Crude Oil Elliott Wave IdeaUpdate to a couple of recent theories:
Could be nearing the end of wave 3 now as the 1.618 extension approaches. May see some sideways action for wave 4 followed by the 5th and final bearish wave towards $47-$50

Brent Oil Intermediate channelWe can see that the mid-line of intermediate channel has been touched and the short-term channel has been broken.
We expect to touch the bottom of the intermediate channel.

Brent Crude Oil futures bearish forecastBrent Crude Oil futures bearish forecast with new supply levels imbalances being created. Brent crude oil is correcting strongly after such a strong bullish move in the past months. Bullish impulses have become corrections and now there are a few daily supply levels created on the way down after such a strong rally.
Three supply imbalances have been created on Brent Crude Oil Futures around $74, $72 and $69. Price has not retraced to them but it did retrace at lower timeframe supply levels on the H4 timeframe.

Current oil crash Zigzag forecastPlease refer to my monthly chart. This Zigzag assumes fractal of oil crashes.

USOIL to touch 59.50 and UKoil follow the same long trend
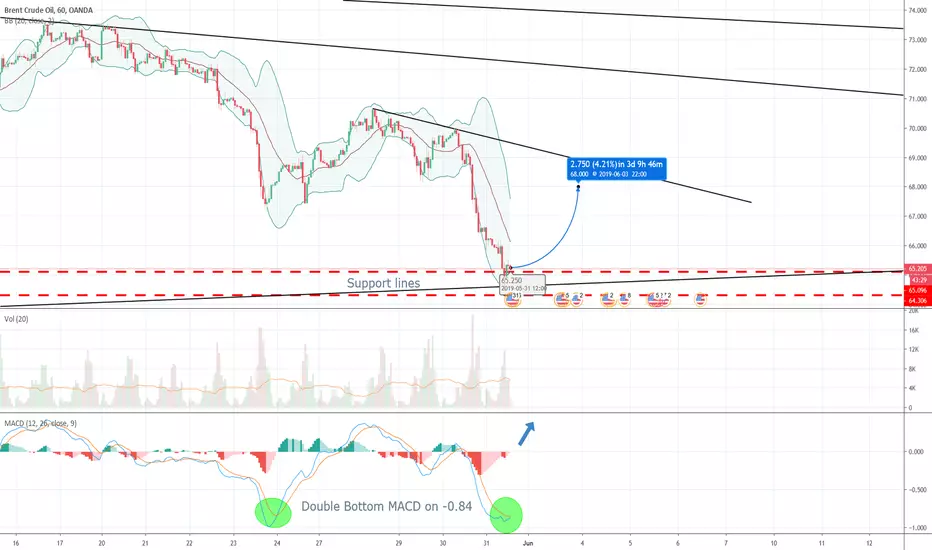
Why this is considered for Long :
1. As per the volume the higher volumes are seen in the chart.Volumes are growing
2. As per the LongBuyLongSellIndicator ,Strength-meters(1 2 3 P D ,Up/dn, PSAR,MA Green Red Line, Red STAR, yellow Star,Green Early Entry stars) minimum of numbers of strength-meters lined up in a row /within two candles that is added advantage for the entry.
3.BackGround color informs it is good to enter at this price.
4. As per the LongBuyLongSellIndicator ,The candle color transition change indicator this is the time to go for entry.
What is the target : close the target @1.5% of 50% number rest in higher numbers.
what will be the stop loss: The stop loss shall be high of previous candle for short /low for the long entry.
TVC:UKOIL TVC:USOIL


Crude Oil Elliott Wave IdeaUpdate to this idea >
Looks like wave 2 (or B) has completed now in the start of either wave 3 or wave C.
If wave C of correction then may bounce and a new high from the 57$ level.
If wave 3 then the 1.618 extension is at 53$.
I prefer the 5 wave impulse move as it fits my larger timeframe view here >

Crude Oil Elliott Wave IdeaUpdate to these ideas:
Possibly in the impulsive waves down now, wave 2 up to 64XX then down for impulse wave 3

Crude Oil Elliott Wave IdeaSlight variation on this smaller timeframe count >
Looks like the 5 waves down are complete followed by a rise in price to 0.5 level, before a sell off. Could be wave 2 or B complete which fits with this larger timeframe count >

What is Brent Oil's golden cross?Golden crossover is the bull cross of the 50- and 200-day MAs.
It is a lagging indicator and usually works as a contrary indicator in the short-term.
Golden cross indicates the underlying has rallied sharply in the previous four months.

VIDEO ANALYSIS: CRUDE OIL TO RISE NEXT WEEK?In this video update, we take a look at Brent Crude Oil as the weekly suggests we could see
further upside next week. If the current weekly candle closes back within last weeks
range we could see the market move back towards 75.00. We were expecting the price to
test the 38.2 Fibonacci retracements however this looks unlikely now with current
price action.

Crude Oil Elliott Wave IdeaOil might be in a triangle for wave 4 (white), break out downwards might occur if it is wave 4, possibly hitting one of the extensions around 58/59/60, depending where wave E of 4 ends.

BRENT OIL price rangesOil prices have been rising since the end of December, rebounding as high as $75 (April 24) from the lows of $50.
We can see the 50 and 200-day SMAs around the same area of $69.
This area of $69-$70 can be considered as a strong support level and potential rebound point as long as there is no major news in regards to a globally slowing economy.
Neutral outlook for now, with a possible tight range of a few dollar in the next couple of weeks, mainly between $69 and $72.
Fundamentals that can have a big impact on this range and break it below or above:
The Saudis announced that they will increase their supply to Asia which is seen as a counter-measure to compensate for the Iranian market losses.
A sensible question would be if the OPEC will loosen up the production restrictions due to the oil supply issues coming from both Iran and Venezuela.
Crude Oil stock changes, USA production as well as trade deal developments should also be monitored.
To conclude, in case we see a break of the $70 level, the next point of interest would be $67 and then $65 which is the 100-day SMA.
On the upside, $75 would be a strong resistance should $72 is broken decisively.

Oil - Brent - UK OIL - LongAfter taking profit at 72 and 70 on our recent short I'm now actively looking to go long from 70.80 so I have to wait for a pull back before entry.
Although it has been a bank holiday I still feel the outside bar is valid, showing strong rejection from the lower BB.
Entry 70.80
Stop 68.50
TP 75
TP2 79
