BRETT/USDT Poised for Explosive Breakout from SymmetricalThe crypto market is heating up again, and BRETT/USDT is showing one of the most promising technical setups right now. The pair is approaching a critical breakout point from a well-defined Symmetrical Triangle, signaling that a major move may be imminent.
🧠 Technical Pattern: Symmetrical Triangle – Price Compression at Its Peak
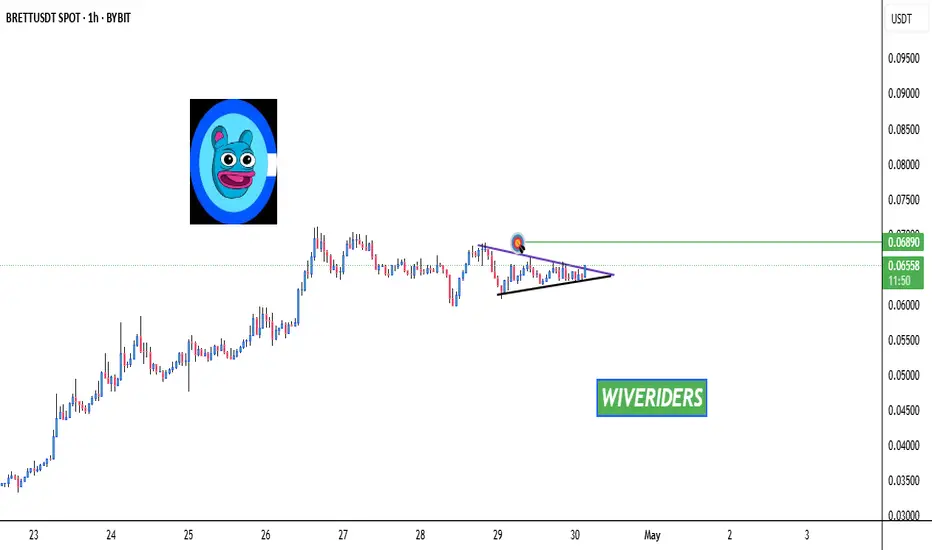
Since February 2025, BRETT/USDT has been consolidating inside a Symmetrical Triangle – a classic neutral pattern that often precedes explosive moves.
Key Characteristics:
Lower highs & higher lows: A sign of price compression and indecision
Trendline convergence: A breakout or breakdown is imminent
Decreasing volume: A textbook pre-breakout condition
Currently, the price is trading around $0.05595, right near the triangle’s resistance line – putting it at a make-or-break moment.
✅ Bullish Scenario – Breakout and Rally
If the price breaks out above the triangle resistance with strong volume and a daily candle close, we could witness a rapid rally toward multiple key resistance levels:
📈 Bullish Targets:
1. $0.06652 – Initial breakout confirmation
2. $0.09045 – Minor horizontal resistance
3. $0.11496 – Mid-term resistance level
4. $0.15515 – Historical supply zone
5. $0.21254 – $0.23603 – Full pattern target and previous local high
🚀 From the current price, this breakout could deliver over +300% upside if momentum holds.
Indicators like RSI, MACD, and Volume Spike confirmation can act as supporting evidence for entry.
❌ Bearish Scenario – Breakdown and Continuation
On the flip side, failure to break out and a drop below the lower support trendline could signal a bearish continuation of the previous downtrend.
📉 Bearish Targets:
$0.04000 – Minor support level
$0.02340 – Cycle low & strong horizontal support
🔻 Such a breakdown would invalidate the bullish setup and may lead to prolonged consolidation or further downside.
🧩 Summary & Market Insight
BRETT/USDT is at a highly pivotal technical level. The symmetrical triangle pattern suggests that a major breakout or breakdown is imminent, and the reward-to-risk ratio is very attractive for both swing traders and position traders.
📌 Trading Strategy Suggestions:
Bullish: Enter on confirmed breakout above triangle with volume; stop-loss below previous support.
Bearish: Watch for breakdown with volume; consider short targets or wait for new support to form.
Always apply proper risk management and consider using trailing stops in case of strong continuation.
#BRETTUSDT #CryptoBreakout #AltcoinAnalysis #SymmetricalTriangle #CryptoTechnicalAnalysis #Altcoins #BreakoutSetup #CryptoTraders #CryptoMarketUpdate
Brett

$BRETT Breakout Watch Descending channel breakout on $BRETT!
The price is now retesting and holding above the trendline with EMA support. The bullish structure is in play! 📈
🎯 Targets:
• TP1: $0.0912
• TP2: $0.1078
• TP3: $0.1291
🛑 SL: $0.0634
📌 Entry: Around $0.0738–$0.076 zone

$BRETT Bull Flag breakout Done!!$BRETT Bull Flag breakout Done ✅
Looks ready to take off anytime.
I bought it at CMP with SL $0.07083
DYOR, NFA
BYBIT:BRETTUSDT PYTH:BRETTUSD

BRETT Forming Bullish Pattern🚨 $BRETT
Forming Bullish Pattern 🚨
$BRETT
is forming a bullish pattern. If the price breaks out above the current resistance level, the first target will be the green line level.
📈 Technical Overview:
Pattern: Bullish
Resistance Zone: Current level being tested.
🎯 Breakout Target: Green line level
Brett: Your Altcoin ChoiceA Solana memecoin, Brett produced a year long higher low with the classic ending diagonal pattern to signal an upcoming trend reversal.
The first low happened in April 2024. The second and higher low this month, this week, 7-April 2025.
The chart dynamics are very simple. Are you wondering, is the timing right? Right for a buy, maybe. Right to hold or, will a reversal happen soon?
The answer is positive to all those questions.
The time is right and is also ripe for a reversal to take place. This is the best possible time right now to buy and hold. The market must be bought when prices are low and red. This is the situation with the chart today. Prices are low and red but ready to turn. All the early signals are in.
BRETTUSDT is showing potential for a strong bullish wave in the coming months. Being new and also trading at bottom prices, growth can go off the chart. I will not be surprised when this pair goes beyond the 1,115% shown on the chart, this target is based on the mid-term.
The first target can reach 415%.
This is an easy chart. This is an easy trade.
I don't like memecoins, but it is not about what I like, it is about what the chart says.
The chart says that this pair is bullish with huge potential for growth. If you like it, feel free to enter with force. The Cryptocurrency market is turning bullish now and this and other pairs are sure to grow.
Thanks a lot for your continued support.
Your timing is great. A good Altcoin Choice.
Namaste.

BRETT Breakout Inverse H&S 0.049 Next- Downtrend Breakout
- Retest of the downtrend successful
- Weekly Support = red line
- Weekly Resistance = blue line
$0.049 Target $0.048 Next

Brett Weekly Chart - $0.049 Next (55%+)Red = Weekly Bottom
Blue = Proven support & Resistance lines
Currently there is a breakout and a W around the Red Bottom telling me the next move is up. Combined with an inverse head and shoulders with a 0.049 target

Brett 40x (FREE VIP SPOT SIGNAL)Traders,
Here is a free signal from the VIP. Brett is a MEME coin listed on base coinbase's local blockchain. This will be a coin that we believe does well this run. Feel free to reach out for more trades like this.
Stay Profitable My friends,
Savvy

$BRETT - The Leading Memecoin on BaseBrett is the legendary character from Matt Furie’s Boys' club comic. He is a dancer and loves video games. Now he is living on the BASE blockchain as a Fan tribute. He has become blue mascot of the blue chain, BASE.

$BRETT - Entry in Demand Zone, Target Above 50c$BRETT is currently in a small correction within a demand zone. Any price under 14c is a good entry point, with 12c being an excellent opportunity. If we see a drop to 12c, treat it as a gift.
Looking to sell above 50c, targeting a strong upside once the price rebounds from this zone.

BRETT/WETHlooking for brett/weth bounce here.
lots of taps previously and were in the zone again.
if we get a reaction here, BRETT/USD should start flying

BRETT Long Spot Trade (Buying the Dip) Market Context:
BRETT's current price action suggests that any dip into the $0.18 zone represents a strong buying opportunity. The setup shows potential for significant upside, with favorable risk-to-reward dynamics.
Trade Setup:
Entry Zone: Around $0.18
Take Profit Targets:
First target: $0.30
Second target: $0.50
Third target: $0.75
Stop Loss: Daily close below $0.15
This trade aims to capitalize on the dip into support, targeting substantial price expansion in the upcoming trend.

$BRETTUSDT Strong Cup Handle formation over 6 monthsBYBIT:BRETTUSDT on Base chain is going to explode after 6 months of Cup Handle. It is not too late to fill your bags 🚀

$BRETT 100X LEVERAGED LONG
CONVICTION
This chart doesn’t “correct.” It doesn’t “consolidate.” It hunts. Every time some paper-handed clown tries to short, $BRETT casually steps on their neck and climbs higher. What’s that? You’re waiting for a pullback? Yeah, keep waiting—might as well sit by the phone for a text from your ex while you’re at it.
Fundamentals? Cope.
Oh, you need “fundamentals”? Here’s a fundamental for you: Price go up. That’s all you need to know. Stop pretending you’re Warren Buffett; you’re a degenerate gambling on internet monopoly money, same as the rest of us. Own it. $BRETT doesn’t care about “use cases” or “intrinsic value.” The only utility here is crushing shorts and making the poor seethe.
No Poors Allowed
Let’s be clear: If you’re reading this and thinking about “risk management,” you’re not built for this. This is a long-only zone, and the minimum entry fee is your dignity. If you’re not max-leveraged, your account balance better have at least three commas, or this party’s not for you. We’re here to win, not to “stay safe.”
Why $BRETT?
Because it’s $BRETT, that’s why. It’s inevitable. You don’t argue with gravity, and you don’t argue with $BRETT. Trying to fight this pump is like trying to fistfight a hurricane—except in this case, the hurricane is laughing at you while lighting a cigar with your liquidation notice.
Final Thoughts
Max out your longs. Take out a second mortgage. Sell your car. I don’t care what you have to do, but if you’re not riding this rocket, you’ll be watching the rest of us from the ground like the broke NPC you are. This isn’t financial advice; this is financial survival. Cope and seethe, no-coiner peasants. $BRETT to $1, and we’re not waiting for you.

$BRETT Can Easily Make 10x Before The End Of The YearChart is quite clear an obvious. $BRETT is in a trending channel that looks like a massive bull flag.
Its consolidating nicely and is going to find a new ATH.
IMO this meme coin will be as big as PEPE or DOGE. It can make an 80x if I am optimistic and a 10x if I am pessimistic.
What do you think?

BRETT - MEMECOIN PROTAGONIST OF THIS BULL RUN - TRADE PLAN + TAMarket Overview
Current Price: 0.15859 USDT
24h Price Change: -3.16%
Volume: 1.93M
The asset has shown significant volatility in recent weeks, with strong price movement followed by consolidation.
Technical Indicators
VMC Cipher B Divergences: The VMC Cipher shows divergence patterns that can help detect potential reversals or trend continuation signals. There are several key points where divergences are visible in the current chart. The negative divergence near the price top could indicate potential downside or correction
.
RSI (Relative Strength Index): Currently at 44.73. This suggests the asset is not yet oversold or overbought but is hovering near the neutral zone. A rise above 50 could indicate bullish momentum, while a drop below 40 could indicate bearish sentiment.
MFI (Money Flow Index): At 41.52, the Money Flow Index is also near neutral. A value above 50 would indicate positive money flow, suggesting that buyers are in control. Below 50 points to selling pressure.
Stochastic Oscillator: Currently at 57.71 for the %K line, and 35.74 for the %D line. This is considered neutral but nearing an overbought zone. A crossover from below 20 could be a buy signal, while crossing above 80 would suggest an overbought condition and potential reversal.
Volume Analysis
Volume Spikes: The recent volume spikes suggest high market activity, with strong buying and selling forces at play. The presence of a high volume near the price peak indicates strong interest, but it also raises the possibility of a correction or consolidation.
Price Action
The chart shows a bullish trend over the past period, with a strong price increase followed by consolidation around the 0.158 level. This sideways movement could be a pause before either a further bullish breakout or a pullback.
Support Levels: Around 0.15 to 0.16, with the current price testing the lower support level.
Resistance Levels: Around 0.18 to 0.19, which could be the next target if the bullish momentum resumes.
Technical Patterns
Consolidation Phase: The price is in a consolidation phase, which is typical after a significant upward movement. It might test support levels before making another move.
Divergence: The negative divergence in the indicators suggests that if price action fails to break through key resistance, a bearish correction might occur.
Sentiment Analysis
Given the current neutral signals from the RSI, MFI, and Stochastic Oscillator, market sentiment is indecisive. Traders should watch for breakouts or breakdowns from key levels to gauge the next move.
Trading Plan for BRETT (BRETT/USDT)
Bullish Scenario
Entry Point:
If price breaks and sustains above the 0.16 level, this could signal a bullish continuation. A close above 0.18 would be a confirmation of a potential upward trend towards 0.20.
Targets:
Short-term target: 0.18 (first resistance zone).
Medium-term target: 0.20 or higher if the bullish momentum continues.
Stop Loss:
Set a stop loss just below 0.15 (the recent support level) to manage risk in case of a pullback.
Bearish Scenario
Entry Point:
If the price drops below the 0.15 support level, this could signal a short-term bearish move. A sustained breakdown below 0.14 would suggest further downside potential.
Targets:
Immediate target: 0.12, which would be a key support level.
Stop Loss:
For a short position, set a stop loss above 0.16 to limit the risk in case of a trend reversal.
Sideways Consolidation
Strategy:
If the price continues to move sideways, trade within the range by buying near the 0.15-0.16 support zone and selling near 0.18-0.19 resistance. This strategy would rely on short-term price movements and volatility.
Risk Management:
Always set stop losses just outside of support or resistance zones (around 0.14 for support and 0.20 for resistance).
Watch closely for breakout or breakdown signals above 0.16 or below 0.15.
Given the current neutral indicators, it’s wise to be patient and look for confirmation before entering large positions.
Maintain good risk management strategies, such as using tight stop losses and adjusting position size according to market conditions.
This plan takes into account both technical indicators and price action, but always stay updated with market news that may influence price movements.

Alikze »» BRETT | Ascending Channel - 1W🔍 Technical analysis: Ascending Channel - 1W
📣 COINEX:BRETTUSDT It is moving in an ascending channel on the weekly time frame.
🟢 It has had several positive reactions with demand at the bottom of the ascending channel.
🟢 Given the current momentum that is in the supply area and the middle of the ascending channel.
💎 If the current area is broken, it can grow to the 0.41 area.
⚠️ Given the recent zigzag correction at the bottom of the channel, it has encountered buying pressure candles that can be considered the LVL Invalidation range as invalidating the bullish trend analysis. ⚠️
»»»«««»»»«««»»»«««
Please support this idea 💡 with a LIKE 👍 and COMMENT 💬 if you find it useful and Click "Follow" on our profile if you'd like these trade ideas delivered straight to your email 📧 in the future.
🙏Thanks for your continued support.
Best Regards,❤️
Alikze.
»»»«««»»»«««»»»«««

BRETT - all time high and moon soon!?Brett - funny meme coin that retail likes to gamble on.
Brett is near all time high and a huge explosion is possible. If you don't already have a Brett position, it may be time to prepare for one. I see a pull back to 0.14 as healthy and a good entry before Brett picks up new power. Right now Retail is rushing into the market and it is not certain that there will be a pull back to the 0.5 fib level.
BRETT is risky with high volatility but with great potential.

BRETT/USDT NEW ATH EXPECTINGBRETT can show a new increase trend in the coming time.
There is a possibility for a new ATH in the coming period.

Meme Magic on BRETT: Don’t Miss This Bullish Trend!THIS IS A MUST BUY! 🚀 As most memes are currently flipping bullish, this one just fired a bullish signal right off the lows.
What’s to like? This is just the beginning of the weekly trend. Sure, it might seem a bit late, but if everything aligns, the swing is safe to take.
I can’t see a chart more bullish than this at weekly prices. Price targets are indicated by the boxes, so adjust your risk and go long now! 📈
Grab It Now, Cash In by November!💰📈

BRETT - POTENTIAL REBOUND - TECHNICAL ANALYSIS + TRADE PLANTrend Analysis:
The price is in a downtrend on the 4-hour timeframe, with lower highs and lower lows.
Recent candles show consolidation near the $0.07500–$0.07800 range, possibly signaling that sellers are taking profits, leading to some temporary support.
Volume Analysis:
The trading volume at 7.722M shows notable interest in BRETT, but it has not increased significantly to suggest a reversal.
Decreasing volume in a downtrend typically signals a potential for consolidation or a short-term reversal as selling pressure may weaken.
Momentum Indicators:
VMC Cipher B: The VMC Cipher B indicator shows mixed signals with green dots indicating potential bullish divergence, which could mean an upcoming price increase. However, the current momentum on VMC suggests a weak upward push, not strong enough to confirm a trend change.
RSI: At 36.55, the RSI is nearing oversold levels, suggesting the possibility of a short-term rebound but not necessarily a strong reversal. RSI has room to drop further before signaling a strong buying opportunity.
Stochastic: The stochastic oscillator shows an upward cross around 52.72, suggesting a potential buy signal. If the momentum continues, there may be a short-term move to the upside.
HMA-Hist (Hull Moving Average): This histogram shows mixed trends with no definitive sign of strong bullish or bearish pressure, indicating that the trend could go either way in the short term.
Key Support and Resistance Levels:
Support: The $0.07500 level is acting as the immediate support. A breakdown below this level could signal further downside.
Resistance: The $0.08500 and $0.09000 levels are nearby resistance points. If price breaks above these, it could confirm a trend reversal.
Trading Plan
Entry Strategy:
Short-Term Long Position: If the price holds above $0.07500 and RSI remains oversold, consider a short-term long entry with a target near $0.08500. Enter only if there is confirmation from both the RSI and Stochastic crossing upwards.
Breakout Long Position: If the price breaks above $0.08500 with high volume, consider a long position, as it may signal a bullish reversal. Look for further confirmation from the VMC Cipher B and a continued upward trend on Stochastic.
Stop Loss:
Place a stop loss below $0.07300 for long positions to limit potential losses if the price breaks the current support.
Target Levels:
Take Profit (TP) 1: $0.08500 – This is the immediate resistance level. Take partial profit here if the price approaches this level.
Take Profit (TP) 2: $0.09000 – If the price sustains above $0.08500, consider holding until $0.09000 for additional profit.
Risk Management:
Risk-Reward Ratio: Aim for a minimum 2:1 risk-reward ratio by adjusting entry points and take profit levels.
Position Sizing: Limit exposure to a small percentage of the portfolio to manage volatility and avoid significant losses in case the price continues to drop.
Monitoring:
Continuously monitor the volume and momentum indicators (RSI, Stochastic) for any changes that could signal a continuation or reversal of the current trend.
Be cautious of market-wide trends and news that could impact overall crypto market sentiment, as this could affect BRETT’s price movement.

BRETT Long Spot Position (Key Zone Test)Market Context: BRETT is displaying minor higher lows but hasn't confirmed significant higher highs yet. As the price approaches the $0.07 level, it enters a critical zone where market makers could potentially sweep the lows and form a double bottom, offering a strong risk-to-reward setup.
Trade Setup:
Entry: Around the $0.07 area.
Take Profit:
First target: $0.11
Second target: $0.14
Third target: $0.17
Stop Loss: Daily close below $0.05.
This trade offers a favourable risk-to-reward ratio as we aim to capitalize on the potential double bottom formation. #BRETT #Crypto

BRETTUSDT - Possible Buy Opportunity on BRETTBrett is a community based meme token. Brett aims to leverage the power of such an iconic meme to become the most memeable ...
Brett (BRETT) is a memecoin and the official mascot of the Base Chain, inspired by the character Brett from Matt Furie's Boys' Club comic series.
Looking at the RSI on the 1-hour, 1-day and 1-week intervals they are all at the bottom of the range with allot of up-side potential. Apart from the small correction on the 1-hour chart, BRETT is already at support and allows for a buy opportunity at these levels.
