GBPUSD: The Bears Have it! Sell it!Welcome back to the Weekly Forex Forecast for the week of Aug 4 - 8th.
In this video, we will analyze the following FX market:
GBPUSD
Even against a weakened USD, the GBP is weaker.
July ended with an aggressive bearish candle. August may see more of the same.
Then there is talk of interest rate cuts coming.....
Enjoy!
May profits be upon you.
Leave any questions or comments in the comment section.
I appreciate any feedback from my viewers!
Like and/or subscribe if you want more accurate analysis.
Thank you so much!
Disclaimer:
I do not provide personal investment advice and I am not a qualified licensed investment advisor.
All information found here, including any ideas, opinions, views, predictions, forecasts, commentaries, suggestions, expressed or implied herein, are for informational, entertainment or educational purposes only and should not be construed as personal investment advice. While the information provided is believed to be accurate, it may include errors or inaccuracies.
I will not and cannot be held liable for any actions you take as a result of anything you read here.
Conduct your own due diligence, or consult a licensed financial advisor or broker before making any and all investment decisions. Any investments, trades, speculations, or decisions made on the basis of any information found on this channel, expressed or implied herein, are committed at your own risk, financial or otherwise.
Britishpound

GBP/CAD Clarity in Motion! Levels Are Locked In Hey everyone 👋
📌 BUY LIMIT ORDER / GBP/CAD Key Levels
🟢 Entry: 1,83873
🎯 Target 1: 1,84104
🎯 Target 2: 1,84372
🎯 Target 3: 1,85040
🔴 Stop: 1,83316
📈 Risk/Reward Ratio: 2.18
I double-checked the levels and put together a clean, focused analysis just for you. Every single like seriously boosts my motivation to keep sharing 📈 Your support means the world to me!
Huge thanks to everyone who likes and backs this work 💙 Our goals are crystal clear, our strategy is solid. Let’s keep moving forward with confidence and smart execution!

EURGBP Perfect Channel Up giving one more buy opportunity.Last time we looked at the EURGBP pair (May 30, see chart below) we gave the most timely buy signal right at the bottom (Higher Lows trend-line) of the Bullish Megaphone, and the price is only a few candles away from the 0.87400 Target:
If we look at the price action from a 4H perspective we can see that it is a Channel Up that has been driving the pair upwards since the May 28 bottom and today's rebound is taking place after a direct hit on the 4H MA50 (blue trend-line).
This is the start of the new Bullish Leg. Since the previous two have increased by +1.90%, this rally has the potential to even exceed our 0.87400 Target marginally. Still, this is a perfect bullish set-up.
-------------------------------------------------------------------------------
** Please LIKE 👍, FOLLOW ✅, SHARE 🙌 and COMMENT ✍ if you enjoy this idea! Also share your ideas and charts in the comments section below! This is best way to keep it relevant, support us, keep the content here free and allow the idea to reach as many people as possible. **
-------------------------------------------------------------------------------
Disclosure: I am part of Trade Nation's Influencer program and receive a monthly fee for using their TradingView charts in my analysis.
💸💸💸💸💸💸
👇 👇 👇 👇 👇 👇

Technical + Fundamental Alignment: GBPUSD Short in PlayGBPUSD ( FX:GBPUSD ) is moving near the Resistance zone($1.354-$1,350) and has managed to break the Support line .
In terms of Elliott Wave theory , it seems that GBPUSD has completed the Zigzag Correction(ABC/5-3-5) , we can expect the next five bearish waves .
--------------------------------------------------------
Fundamental Analysis
1-Weak UK Economic Data:
Recent reports including Retail Sales, Industrial Output, and PMIs have come in below expectations.
Labour market is softening, and wage growth is decelerating.
2-Dovish Expectations for BoE:
With inflation cooling down, the Bank of England is expected to hold or even cut rates soon, reducing support for the pound.
3-Stronger USD Outlook
Despite some weaker U.S. data, the Fed maintains a hawkish stance. U.S. retail sales and inflation still support the dollar overall.
4-UK Political Risk
Upcoming UK elections on July 4 are adding uncertainty and downside risk to GBP.
--------------------------------------------------------
I expect GBPUSD to attack at least the Support lines based on the above explanation.
Targets: 1.3
1)1.3353 USD =>Risk-To-Reward: 1.51
2)1.3315 USD =>Risk-To-Reward: 2.00
Note: Stop Loss(SL): 1.3549 USD
Please respect each other's ideas and express them politely if you agree or disagree.
British Pound / U.S Dollar Analyze (GBPUSD), 1-hour time frame.
Be sure to follow the updated ideas.
Do not forget to put a Stop loss for your positions (For every position you want to open).
Please follow your strategy and updates; this is just my Idea, and I will gladly see your ideas in this post.
Please do not forget the ✅' like '✅ button 🙏😊 & Share it with your friends; thanks, and Trade safe.

GBPUSD hit its 1D MA50. Perfect buy signal.The GBPUSD pair has been trading within a Channel Up pattern since the January 13 2025 market bottom. Yesterday it hit its 1D MA50 (blue trend-line) for the first time since April 08.
This is the most efficient buy entry as the 1D MA50 has been supporting since the February 13 break-out. Even the 1D CCI turned oversold and rebounded, which is consistent with all bottom buys inside the Channel Up.
The Bullish Leg can extend to as high as +5.05% but due to the presence of the Inner Higher Highs trend-line, we first target 1.3850 (+3.43% rise).
-------------------------------------------------------------------------------
** Please LIKE 👍, FOLLOW ✅, SHARE 🙌 and COMMENT ✍ if you enjoy this idea! Also share your ideas and charts in the comments section below! This is best way to keep it relevant, support us, keep the content here free and allow the idea to reach as many people as possible. **
-------------------------------------------------------------------------------
💸💸💸💸💸💸
👇 👇 👇 👇 👇 👇

$GBINTR - Steady Rates by BoE (June/2025)ECONOMICS:GBINTR
June/2025
source: Bank of England
- The Bank of England voted 6-3 to keep the Bank Rate steady at 4.25% at its June meeting, amid ongoing global uncertainty and persistent inflation.
The central bank noted inflation is expected to remain at current rates for the rest of the year before easing back toward the target next year,
indicating that a gradual and cautious approach to further monetary policy easing remains appropriate.

GBPJPY Strong rebound. Buy opportunity.The GBPJPY pair has been trading within an Ascending Triangle pattern. Today's geopolitics made the price form its latest Higher Low at the bottom of the pattern, which also coincided with a 4H MA200 (orange trend-line) test, and rebounded.
That was a clear buy signal on the 4H RSI Support that signaled the last three bottom buys. Our Target is the top of the pattern at 196.300.
-------------------------------------------------------------------------------
** Please LIKE 👍, FOLLOW ✅, SHARE 🙌 and COMMENT ✍ if you enjoy this idea! Also share your ideas and charts in the comments section below! This is best way to keep it relevant, support us, keep the content here free and allow the idea to reach as many people as possible. **
-------------------------------------------------------------------------------
Disclosure: I am part of Trade Nation's Influencer program and receive a monthly fee for using their TradingView charts in my analysis.
💸💸💸💸💸💸
👇 👇 👇 👇 👇 👇

GBPJPY - BEARISH MOVE !Hello Traders !
The GBPJPY failed to create a new higher high!
The price broke the higher low (change of character).
So, I expect a bearish move📉
______________
TARGET: 192.790🎯

EURGBP Megaphone bottom. Strong buy opportunity.The EURGBP pair is trading within a Bullish Megaphone since the start of the year. For the past 2 weeks it has been ranging within the 1D MA50 (blue trend-line) and 1D MA200 (orange trend-line).
This is technically the bottom formation of the pattern on its new Higher Low, as the 1D RSI has been printing the same sequence as February's which priced the previous Higher Low.
We are expecting at least a Resistance 1 test at 0.87400.
-------------------------------------------------------------------------------
** Please LIKE 👍, FOLLOW ✅, SHARE 🙌 and COMMENT ✍ if you enjoy this idea! Also share your ideas and charts in the comments section below! This is best way to keep it relevant, support us, keep the content here free and allow the idea to reach as many people as possible. **
-------------------------------------------------------------------------------
Disclosure: I am part of Trade Nation's Influencer program and receive a monthly fee for using their TradingView charts in my analysis.
💸💸💸💸💸💸
👇 👇 👇 👇 👇 👇

GBPJPY Channel Down making a Lower High rejectionThe GBPJPY pair rose aggressively since the last time we gave our buy signal (April 11, see chart below), quickly hitting our conservative 109.250 Target:
The price has since made a Lower High rejection at the top of the Channel Down but remains supported by the 1D MA50 (blue trend-line). Once broken and it closes a 1D candle below it, we will have bearish break-out signal. Our Targe will be 185.250, which will be the standard -5.85% decline that all 3 previous Bearish Legs had within the Channel Down.
-------------------------------------------------------------------------------
** Please LIKE 👍, FOLLOW ✅, SHARE 🙌 and COMMENT ✍ if you enjoy this idea! Also share your ideas and charts in the comments section below! This is best way to keep it relevant, support us, keep the content here free and allow the idea to reach as many people as possible. **
-------------------------------------------------------------------------------
💸💸💸💸💸💸
👇 👇 👇 👇 👇 👇

GBPUSD: MACD Cross confirms more upsideGBPUSD is bullish on its 1D technical outlook (RSI = 59.696, MACD = 0.006, ADX = 36.278) as it's been inside a Channel Up since the start of the year (January 13th 2025 low). At the moment the 1D MA50 is holding and provides the short term support. The 1D MACD just formed a Bullish Cross, validating the new bullish wave. We are bullish, aiming for another +3.63% HH rise (TP = 1.3600).
See how our prior idea has worked out:
## If you like our free content follow our profile to get more daily ideas. ##
## Comments and likes are greatly appreciated. ##

GBPJPY - Important BreakdownHello Traders !
The GBPJPY failed to create a new higher high.
The price broke the support line!
So, I expect a bearish move📉
________________
TARGET: 190.680🎯

GBPNZD | 1H | SELL ZONEHey There,
After reaching my GBPNZD sell level, my target is now 2.23855.
Your likes keep me motivated to share my analyses, and I truly appreciate the support.
Big thanks to everyone showing love

EURGBP: Shifting to long term bearish.EURGBP is heavily bearish on its 1D technical outlook (RSI = 36.165, MACD = 0.000, ADX = 36.508), and most likely will close the day under its 1D MA50. At the moment it is crossing below the 2025 Channel Up and if it closes under it, we will have a validated trend shift to bearish long term. It will be similar to the August 2024 decline that made a new Low after a 1D MA50 rejection. We first aim for the S1 level (TP1 = 0.83500) and as long as it remains under the 1D MA50, resell on the bounce to the S1 level (TP2 = 0.82500).
## If you like our free content follow our profile to get more daily ideas. ##
## Comments and likes are greatly appreciated. ##

GBPJPY: Entering the most optimal medium-term Sell Zone.The GBPJPY pair is bullish on its 1D technical outlook (RSI = 59.237, MACD = 0.300, ADX = 16.909) as it is expanding the bullish wave of the 6 month Channel Down. The two prior peaked on the 0.786 and 0.9 Fibonacci retracement level respectively. This bullish wave has already reached the 0.786 Fib, so it has entered the most optimal Sell Zone for the medium term. Even if it peaks on the 0.9 Fib, a -5.90% bearish wave (similar with the 3 prior) would test 183.500.
See how our prior idea has worked out:
## If you like our free content follow our profile to get more daily ideas. ##
## Comments and likes are greatly appreciated. ##

GBPUSD | 1H | BULLGood Morning Traders;
My target level for GBP/USD is 1.33966—just wait for this level and stay patient.
I put in a lot of effort to prepare these analyses for you, so don’t hold back on showing your support with a like! A huge thank you to everyone who supports me—every single like is a source of motivation for me to keep sharing my insights.

GBPUSD - NEW BREAKOUT !Hello Traders !
The GBPUSD failed to create a new lower low!
At the moment, The last higher high is broken (break of structure).
So, I expect a bullish move🚀
______________
TARGET: 1.33630🎯

GBPJPY Channel Down bottom reached. Rebound expected.Last time we looked into the GBPJPY pair (March 20, see chart below) we had a sell signal which dully delivered our 188.550 Target:
This time we have the price at the bottom (Lower Lows trend-line) of the extended Channel Down, with the 1D RSI almost reaching the 30.00 oversold limit. All such bottoms were followed by a rebound that hit at least the 1D MA50 (blue trend-line) before a new Channel Down Lower Low.
As a result, we are going for a short-term buy here, targeting a potential contact with the 1D MA50 at 190.250.
-------------------------------------------------------------------------------
** Please LIKE 👍, FOLLOW ✅, SHARE 🙌 and COMMENT ✍ if you enjoy this idea! Also share your ideas and charts in the comments section below! This is best way to keep it relevant, support us, keep the content here free and allow the idea to reach as many people as possible. **
-------------------------------------------------------------------------------
Disclosure: I am part of Trade Nation's Influencer program and receive a monthly fee for using their TradingView charts in my analysis.
💸💸💸💸💸💸
👇 👇 👇 👇 👇 👇

GBPUSD - Support becomes ResistanceHello Traders !
The GBPUSD failed to break the resistance level (1.30490 - 1.29990).
The price broke the support (1.27592 - 1.28116).
This key level becomes new resistance !
So, I expect a bearish move📉
_____________
TARGET: 1.25900🎯

It's about to explodeThe British Pound looks very strong across the board. Check my post of GPBCHF lines below. Is forming a bullish flag at the monthly resistance to break it up violently. If it pulls back I'll add more. SL triggers is a weekly candles closes under the bottom of the flag but I hardly doubt it. I'm almost all in on the British Pound.

GBPUSD in Correction Phase – Potential for a Short OpportunityGBPUSD ( FX:GBPUSD ) is approaching the Support zone($1.286-$1.278) , Support lines and Important Support line .
Regarding Elliott Wave theory , GBPUSD appears to have completed the microwave 5 of the main wave 3 with the help of the Ending Diagonal Pattern and is currently completing the main wave 4 . The main wave 4 is likely to have a Double Three Correction(WXY) .
I expect GBPUSD to decline at least to the Support zone($1.286-$1.278) and Support lines .
Note: If GBPUSD goes above $1.30 we should expect more pumping. The worst Stop Loss(SL) for a SHORT position could be $1.30.
Note: If GBPUSD falls below $1.2760, we should expect more dumping.
Please respect each other's ideas and express them politely if you agree or disagree.
British Pound/U.S. Dollar Analyze (GBPUSD), 4-hour time frame.
Be sure to follow the updated ideas.
Do not forget to put a Stop loss for your positions (For every position you want to open).
Please follow your strategy and updates; this is just my Idea, and I will gladly see your ideas in this post.
Please do not forget the ✅' like '✅ button 🙏😊 & Share it with your friends; thanks, and Trade safe.

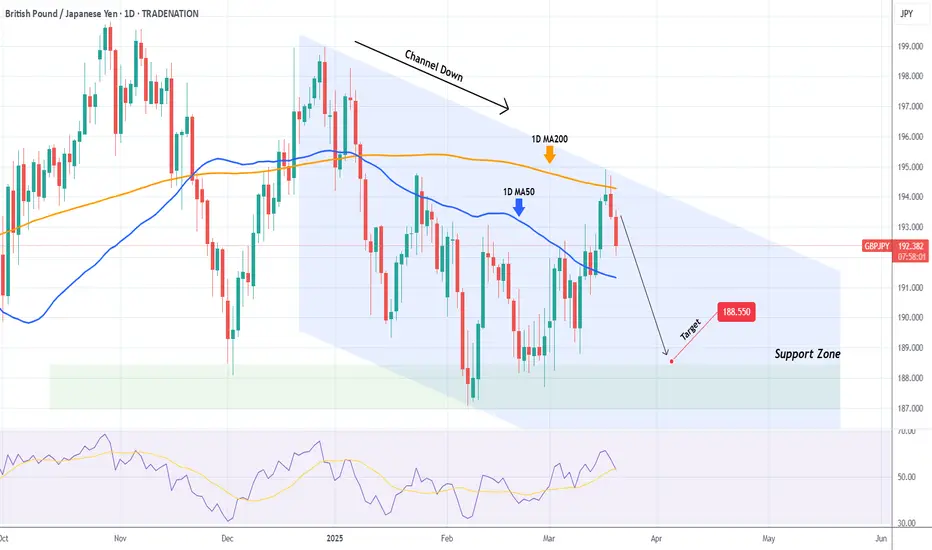
GBPJPY 1D MA200 rejection. Channel Down sell signal.The GBPJPY pair has been trading within a Channel Down pattern and the recent Bullish Leg got rejected yesterday on the 1D MA200 (orange trend-line). If the 1D RSI closes below its MA trend-line, we will have the ideal sell confirmation signal.
Our Target is the top of the 4-month Support Zone at 188.550.
-------------------------------------------------------------------------------
** Please LIKE 👍, FOLLOW ✅, SHARE 🙌 and COMMENT ✍ if you enjoy this idea! Also share your ideas and charts in the comments section below! This is best way to keep it relevant, support us, keep the content here free and allow the idea to reach as many people as possible. **
-------------------------------------------------------------------------------
Disclosure: I am part of Trade Nation's Influencer program and receive a monthly fee for using their TradingView charts in my analysis.
💸💸💸💸💸💸
👇 👇 👇 👇 👇 👇
GBP/USD: ID50 Setup Bullish Trade Opportunity1. **ID50 Setup Formation:**
- The market appears to have formed a **peak formation low**, followed by a reversal into an upward trend.
- The price retraced to the **50 EMA (blue line)**, which aligns with the **ID50 trade entry zone** in BTMM.
- A bounce off this moving average suggests **bullish continuation**.
2. **Market Structure & Momentum:**
- Higher highs and higher lows are evident, confirming an uptrend.
- The **red EMA (13 EMA)** remains above the **50 EMA**, reinforcing the bullish sentiment.
- Price recently tested the **50 EMA support**, indicating a potential **buying opportunity**.
3. **Key Levels to Watch:**
- The nearest **resistance zone** is around **1.29700**, which might serve as the next target.
- Support is currently around **1.29000**, aligning with the 50 EMA.
**Conclusion:**
If the price maintains support above the 50 EMA, the **bullish ID50 setup** suggests a continuation of the uptrend. A break above recent highs could lead to further gains. However, traders should watch for potential **stop hunts** before a strong move occurs.
