NIFTY at Best Resistance !!This is the 1 hour Chart of NIFTY 50.
NIFTY 50 is trading near it's Resistance zone at 24400 range.
NIFTY 50 is forming a broadening pattern; resistance lies near 24,500.
Nifty 50 is forming parallel channel inside the pattern ; resistance lies near 24350.
If this level is sustain, then we may see Lower prices in Nifty 50.
Thank You !!
Broadeningpattern

ZYDUS LIFESCIENCES AT BEST SUPPORT !!This is the 4 hour Chart of ZYDUSLIFE.
Zydus Lifesciences at good support zone near ₹920–₹930 range.
Zyduslife is moving in a Higher High and Higher Low (HH-HL) formation.
Stock has formed a broadening pattern within the channel.
If this level is sustain, we may see higher prices in ZYDUSLIFE.
THANK YOU !!

Godfrey Phillips India – Major Breakout in Progress! 📌 Technical Breakdown & Swing/Positional Trade Idea
Godfrey Phillips India is currently breaking out of a 150-day broadening pattern, signalling strong bullish intent with increasing volume participation. Let’s break it down:
Key Levels & Market Structure:
Monthly Resistance Breakout (Yellow Line): The price has convincingly broken above a key monthly closing resistance, marking a shift in trend.
Supply-to-Demand Zone Flip: A critical supply zone (marked in red) was breached and is now acting as an important demand area, where buyers are likely to step in for re-entries at better prices.
Broadening Structure: The stock has followed a classic expanding range (marked by white trendlines), showing volatility compression and breakout strength.
Weekly Counter-Trendline (CT): A hidden WTF resistance line (yellow) from the weekly timeframe was also taken out, adding further confluence to the move.
Cup & Handle Breakout (Cyan Zone): A recent cup & handle breakout with strong volume clusters confirms bullish momentum.
Trading at 50-Day High: The stock is now at a new short-term high, indicating sustained strength in price action.
Glossary (For Better Understanding):
Broadening Pattern: A technical formation where price swings increase in magnitude, forming an expanding structure.
Supply-Demand Flip: A price zone that initially acted as a supply (resistance) but later turned into a demand (support) after a breakout.
Counter-Trendline (CT): A hidden trendline that acts as a resistance within a prevailing trend, often creating liquidity traps.
WTF Hidden Resistance: A key level that isn't easily visible but plays a crucial role in price reactions.
Cup & Handle Breakout: A bullish continuation pattern indicating accumulation before a breakout.
Volume Clusters: Areas where heavy trading activity occurs, often signaling accumulation or distribution zones.
🚀 Conclusion: With multiple bullish confluences, volume backing, and a clean breakout, this trade setup presents a high-probability swing & positional opportunity. However, risk management remains key!
Let me know your thoughts in the comments! Are you tracking this setup?

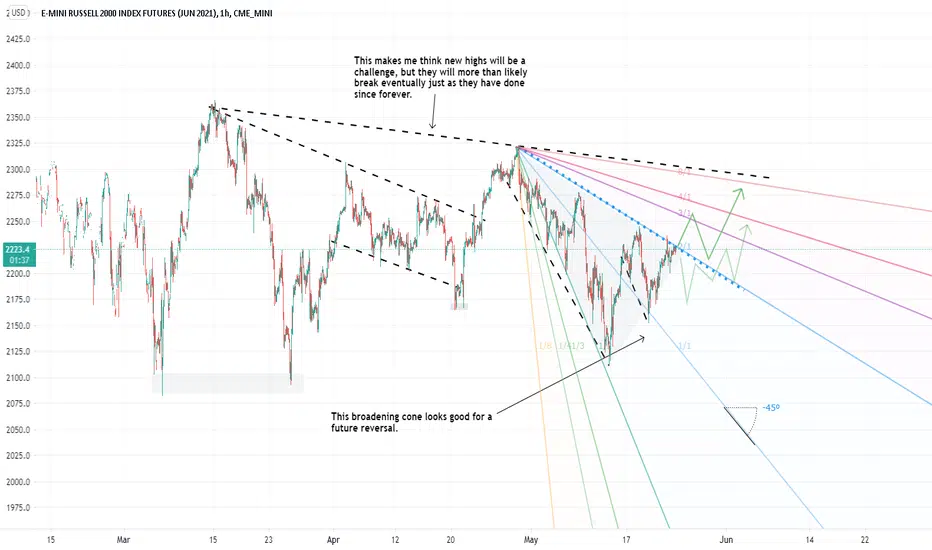
Broadening descending patterns on Russel. Makes me think Gann.It looks like it might have found the bottom already to me. The downward sloping upper trendline on the top looks like it could be trouble, but in the meantime I think it will trickle upward.
I have listed as 'neutral' because one of my two paths has Russel collecting at a lower level.
Pattern Cheatsheet: Identfying a Broadening Top PatternThe Broadening Top pattern appears when price makes a straight upwards run (similar to the "Flagpole" of a Bull Flag Pattern, then swings between two expanding broadening trendlines with at least 5 touches.
It is a neutral pattern which means it can break out in either direction, on the bottom right examples i have explained how the pattern is identified, measured and traded for both Bullish & Bearish breakouts.
The idea is to get a entry early by identifying the pattern, (point A) which allows for a better Risk:Reward ratio and closer stop loss. The second potential entry is at point B, which is considered a Bullish or Bearish retest ( Support/Resistance flip it is also known as), but this area is a bit risker and has less "room to move".
The pattern can give a a sign that the price may have a higher chance in heading in a certain direction, and we can measure the height of the straight run upwards, aswell as the height of the two LARGEST SWINGS within the pattern to get two possible price targets ; one conservative and one less so.
The Broadening Top appears frequently on Bitcoin & Ethereum and has one of the better success rates out of all the different Broadening Patterns and is one of the easiest to trade & identify because often it works similar to a Bull Flag pattern.
If you found this idea informative, Dont forget to show your support by liking & commenting thank you traders!
