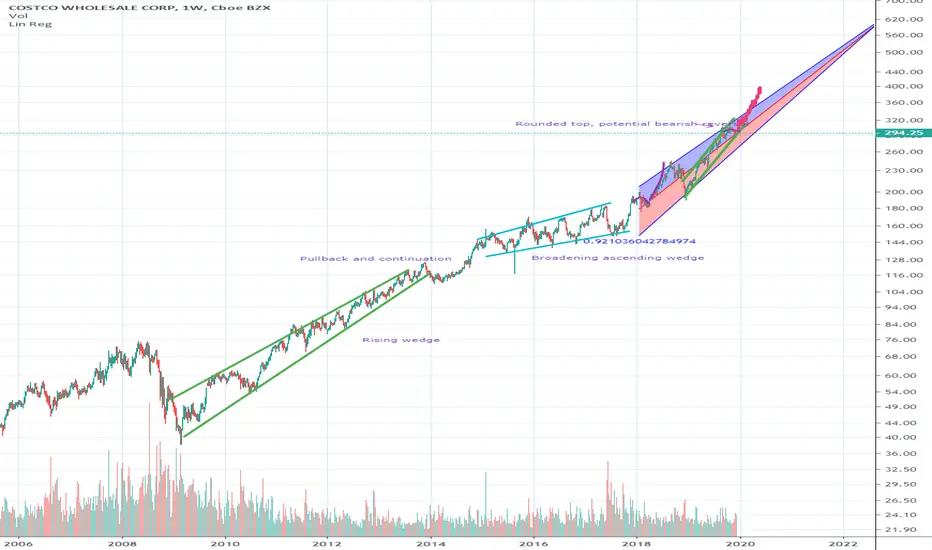
COST Regression analysisPresence of a rising wedge, broadening ascending wedge, Costco has been on a massive bull run. Rounded top also present which may be indicative of a bearish move, but with the strong rising channel and regression trend of 0.92 (strong regression trend according to Pearson's R value) the chart appears definitely more bullish rather than bearish.
Broadening Wedge
CBS - At The Bottom of 5 Year Broadening Formation
Very large broadening formation formed on the monthly dating back to 2013.
Current R:R ratio with a stop under the previous month low and a reward to the top of the broadening formation is 9:1.
Smart move would be to wait until previous month high is breached and get a confirmation close 3day at least and gauge risk from there.
But something tells me that a strong gap up won't give you that opportunity.
The risk of taking a small starter position here with strong closes is worth a look.
Beware: earnings next week...

What is an ascending broadening wedge? (Educational, Example) An ascending broadening wedge is a bearish chart pattern (said to be a reversal pattern). It is formed by two diverging bullish lines.
An ascending broadening wedge is confirmed/valid if it has good oscillation between the two upward lines. The upper line is the resistance line; the lower line is the support line.
Each of these lines must have been touched at least twice to validate the pattern.
NB: a line is said to be "valid" if the price line touches the support or resistance at least 3 times.
This implies that the ascending broadening wedge pattern is considered valid if the price touches the support line at least 3 times and the resistance line twice (or the support line at least twice and the resistance line 3 times).
An ascending broadening wedge does not mark the exhaustion of the buying current, but the sellers’ ambition to take control. The divergence of the two lines in the same direction (increase in price magnitude) informs us that the price continues to increase with movements that are increasingly high in magnitude. The buyers manage to make the price rebound on the support line but lose control after the formation of a new highest point. The lowest point reached during the first correction on the ascending broadening wedge’s support line forms the support. A second wave of increase then occurs with more magnitude, signalling the loss of buyers' control after a new highest point. A third wave is formed afterwards but buyers lose control again after the formation of new highest points.
During the formation of an ascending broadening wedge, volumes do not behave in any particular way but they increase strongly when the support line breaks.

AUD/USD Technical analysisThe counter is currently in a broadening wedge pattern.
It hit the resistive trendline, consolidated a bit and then fell down sharply.
Now, it has broken a critical support level which can cap a bullish rally from now on.
Hence, traders can short the pair and expect a plunge towards the lower end of the range.

Broadening WedgeBroadening wedge, with a target price calculated as 60% its broadest point subtracted from the area of the pattern breakdown, gives Target Price of $16.70. A secondary pattern that following the upward trendline (in black) also has a target price of $16.70. I would pre position with a buy at $16.75 and keep a stop loss below $16.30.

AUDCHF Analysis: Price following a broadening wedgeHi traders,
Price still in an uptrend and following a broadening wedge within the ascending channel.
Currently the price has hit the resistance line of the wedge and is likely to bounce off towards the wedge support level.
Breaking of the wedge resistance line will invalidate this short/sell signal.
Share your opinions in the comment section. If you agree with the analysis kindly hit like to show support.

US Deficit PutDescription: RISK ON
"Von Havenstein faced a real dilemma. Were he to refuse to print the money necessary to finance the deficit, he risked causing a sharp rise in interest rates as the government scrambled to borrow from every source. The mass unemployment that would ensue, he believed, would bring on a domestic economic & policital crisis, which in Germany's current fragile state might precipitate a real political convulsion. As the prominent Hamburg banker Max Warburg, a member of the Reichsbank's board of directors, put it, the dilemma was 'whether one wished to stop the inflation & trigger the revolution,' or continue to print money. Loyal servant of the state that he was, Von Havenstein had no wish to destroy the last vestiges of the old order."
Timeframe: already started
Indicators used: all of them
Shout out to: Luke Gromen, John Williams, and Jerome Powell

COUP - Plan The Coup!Broadening Wedge pattern has been forming since early September. The stock is coming out of an oversold condition while bouncing off the support trendline.
I am looking for the broadening wedge pattern to continue with a price target of $160. I will be looking for how the price reacts when RSI gets around 50 to see if it will continue rising or if it may hit resistance somewhere.

BITCOIN - Freedom - Part 7Something special happened in the first year or so after Satoshi gave us Bitcoin , something no one expected and many thought was impossible. Try to imagine Bitcoin back then, before you could buy things with it, before there was an exchange rate, before anyone really knew what, if anything, would happen with it. Bitcoin didn’t start out as money. It became money, but it did so unlike any money that came before it. For all the things Bitcoin has made possible, for all the ways it is changing our world, we don’t fully appreciate or even understand what happened in those early days, when it was just a play thing for geeks.
Every other money that predates Bitcoin — in the long history of human civilization — was valued for reasons other than its use as money. Cattle in Africa, postage stamps in prison, sea shells and precious metals all have been used as money and fit this pattern. The only exception is fiat money — something declared to be money by an authority — but even national fiat currencies were once backed by something with prior value, like gold .
Bitcoin changed all that. Bitcoin had no prior value, and no one was forced to use it, yet somehow it came to be a medium of exchange. People who don’t understand and care little for Bitcoin can nevertheless accept it as payment because they know it can be used to pay for something else or be exchanged into conventional money.
People often mention the pizzas that were bought for ten thousand bitcoins and, in hindsight, poke fun at the guy who ate what would become a multi-million dollar lunch. I’m more interested in the person who gave up two perfectly good pizzas for mere bitcoins . What did he see in those bits and bytes, that digital signature on something people were calling a blockchain? Whatever motivated the pizza seller may have also called to the early miners who could not liquidate but happily hoarded. It may have inspired the ones who simply gave bitcoins away by the thousands. Whatever it was, it was something new.
Classical economics says exchange won’t happen unless both parties value what they are getting more than what they are giving up. So where did the value come from? Bitcoin should never have gotten off the ground, but it did. Even a new product has some kind of value to it, and early adopters are taking a risk that they won’t get their money’s worth, but they still expect to gain from the exchange.
The early adopters of Bitcoin , on the other hand, had no way of knowing that we do now. All they had was a dream, a conviction and enough infectious enthusiasm to bootstrap a digital contrivance into a multi-billion dollar phenomenon we are only beginning to see the effects of.
I’ll tell you what I think happened, but the truth is no one knows. It is like magic that Bitcoin could somehow come from nothing, and without prior value or authoritative decree, become money. But Bitcoin did not appear in a vacuum. It was a solution to a problem cryptographers had been struggling with for many years: How to create digital money with no central authority that couldn’t be forged and could be trusted.
This problem persisted for so long that some left the solution to others and dreamed instead of what our future would be like if decentralized digital money did somehow come to be. They dreamed of a future where the economic power of the world is accessible to everyone, where value can be transferred anywhere with a key stroke. They dreamed of prosperity and freedom, dependent only on the mathematics of strong encryption.
Bitcoin was therefore birthed onto fertile ground and was recognized by those that had been waiting for it. This was an historic moment for them, far more important than pizzas or electric bills run up from mining. The promise of freedom and the allure of destiny energized the early community. Bitcoin was consciously, yet spontaneously taken up as money while no one was watching, and our world will never be the same.
F R E E D O M
Well keep you updated as this timely issue evolves.
We go together
Together we are stronger
Share and like
I am not Bearish long term. I am a Bull of Bulls.
Thanks
God bless you!
===============================================================================
Twitter > twitter.com
===============================================================================
CAUTION!
DISCLAIMER
Trading is risky.
Here s a small explanation about why Im giving insight into my trades. Crypto is all about trust and transparency and that is what ID like to bring. Dont expect me to tell you how much crypto I actually own because thats none of your business. But I Will tell you how big my position will be in regard to my trading portfolio.
Secondly and actually the main reason im doiing this, is to proof to all the HALTERS out there that you can earn money with trading crypto. Most people are skeptical about trading because they heard horror stories about people who lost all their money. Follow my journey and let me proof therm wrong.
At the end of the day, the most important thing is how good are you at risk control.
Booking some losses during trading is perfectly normal, so im not afraid to show those losses. Most traders dont give any insight in what they because they perfectly know they suck and dont have a clue what they are doing in regard to risk management.
Risk comes from not knowing what you're doing.
Just like every trader, Ive seen ups and downs in my journey. I started trading stocks. And you can guess what that meant for my portfolio. Yes thats right, it was almost completely wiped out.
But I pressed on, learned a lot about technical analysis and here we are. I have experience in trading stocks, options, and commodities .
So you can assume that I know how to deal with risks.
===============================================================================
$BTC $BCH $BNB $XLM $EOS $ETH $ADA $LTC $TRX $XRP $IOTA $LINK $XTZ $BTT $XMR $NEO $BTT $MATIC $XMR $MRK $XEM $ONT $DASH $BAT $ZRX $LSK $NANO $REP
#altcoins #bitcointrading #BuyTheFear #BuyTheDip
@btc @RedditBTC
#CRYPTO #BITCOIN #BTC
===============================================================================

Example of an Ascending Broadening WedgeThe ascending broadening wedge is considered to be a reversal pattern, and is bearish in nature. Though the pattern is typically a signal of reversal, continuation of the uptrend is still possible.
When present as a continuation pattern, the wedge will still slope to the upside, but the up-slope will typically be found as a pullback within a downtrend. When present as a reversal, the pattern will slope to the upside within an uptrend. Regardless of continuation or reversal, ascending broadening wedges are always bearish in nature.

Example of a broadening wedgeA descending broadening wedge is bullish chart pattern (said to be a reversal pattern). It is formed by two diverging bullish lines

Ethereum Bearish or Bullish?During the last analysis, we accurately obtained the price objective of the falling wedge, which was 220, it took a lot of time for the move to develop, and once the price objective was hit, there was a pretty immediate drop to 155. It was mentioned in my most recent BTC analysis that the descending triangle was most likely to break out within days, and that if it broke to the downside, then it would bring the entire crypto market down. Well, the entire crypto market did shed approximately 40 billion dollars within hours. I did spot the head and shoulder at the price objective, however, I did not make a post on it, so I apologize for that. But here is my most current ETHUSD analysis.
The Chart:
The red rectangles are areas of resistance and the green rectangles are areas of support. In light blue, there is a descending broadening wedge which tend to favor a more bullish outcome. However, volume isn't the best to support that argument and in addition, there are only two touches for the top trendline. It can be said that the bottom trendline has been acting as support, so if there are any drops, the bottom of the trendline has been a good region to buy. After the most recent drop, price appears to be in a very tight rising channel, since the highest volume occurred on the drop and volume has been significantly less afterwards, this is most likely a bear flag. The price objective of this bear flag is approximately 136 which is noted by the magenta horizontal line. Another thing to note is that there is a rising trendline on the RSI, which has been maintained since the drop.
Price Action:
There are several price actions to look for the most bullish is if price would pop to the upper region of the channel and hug the top trendline of it, consolidating there before breaking to the upside possibly to consolidate around the top trendline of the broadening wedge. The most bearish would be if price has already begun to weaken and that 185 was the highest price point in the bear flag, this can be identified if price tries several attempts to break into the resistance level or if it distributes in that area. Another bearish scenario is if price increases to the resistance region and distributes there before dropping.
Previous analysis:
ETHBTC Analysis:
BTC Analysis:

RAYTHEONSo this is more about finding a way to write all my calls and ideas and be accountable.
But I see a broadening wedge on Raytheon , I would hope RTH, would go above the top line and use that as support,
The current geopolitical environment with Iran , is one of the reasons why I think RTH, may be a semi-ok play
I feel more can happen that would make a RTH, bull case then bear case
I want to let this trade play out, before October 14th -> Trade talks
But if the position is in profit on Friday I make just bank it and leave
I will reconsider my position at 188, I have no hard stop, if only RTH goes down to that level and it isn't a entire market move , that is a situation I will reconsider my original thesis.
Going on my previous notation of October 14th
I will be looking at Brexit on October 31st If it happens to see how I play my open positions,
-> I'd rather be out during those events and see what happens

BTC ready for a swing up Head and Shoulders played out , What followed was a retest on of the level of the last peak of the descending wedge we broke out from yesterday ,
While doing that price did consolidate inside a descending broadening wedge which is bullish, Broke out to the upside , retested back on the top side of it and now we are set for another run to the upside,classic text book wedge analysis is manifesting nicely on the price action of bitcoin the last couple of days.
Being on a weekend though where volume tends to drop ,liquidation hunts from platforms are in full action , so one has to pay extra attention while swing trading - especially with stop limit orders -

P&G- How Micro Patterns Create Long Term Trends: PGIn this illustration, we observe how various micro patterns can translate into a longer-term macro pattern. With the case of PG, for prevailing micro patterns have progressed in what appears to be a bullish rising channel which has recently broken through. As the longer-term trend unfolds, the micro patterns will form in series of periods of high volatility and low volatility. Each pattern gives us an idea into the minds of the collective market consensus. Let’s examine what each pattern tells us in terms of an observational standpoint.
ABCD:
the ABCD pattern is commonly referred to as a reversal pattern. This is because the ABCD typically occurs at key turning points within a stock’s prevailing trend. The ABCD represents between B&C that light selling activity has commenced. The overall formation depicts a weakening of bullish accumulation and that although prices continue to raise exhaustion of buyers will likely proceed.
Rising channel:
The rising channel pattern is a highly reliable pattern that is typically considered one of the safer longer-term patterns to examine. The rising channel is characterized by a series of price changes which occur at intervals in between symmetric areas of support and resistance where the price respects these areas and makes sharp or distinct changes in between the zones. The rising channel displays that traders have a clearly defined consensus of the future value of the security, and that reasonable amounts of selling and buying activity is occurring meaning there is interest and activity and therefore opportunity.
Pennant:
The pennant pattern can occur in numerous phases. Typically, the phases are characterized by the ascending or descending slope of the support or resistance lines. The pennant pattern commonly occurs at consolidation zones or within the boundaries of macro patterns. Tenants represent an overall tightening and narrowing of volatility and can be used to pinpoint key turning points either bullish or bearish regarding the stocks long-term trend.
Symmetric Broadening Wedge:
the symmetric broadening wedge at any point in the stocks long-term trend represents an expansion of volatility. In the case of the symmetric broadening wedge, the battle between the Bulls and Bears is considered more volatile than in the case of a standard broadening wedge. Indicated by the slope of the support and resistance lines, a standard broadening wedge will likely display a flat support or resistance line and a slanted support or resistance line a symmetric broadening wedge displays two sloped lines and therefore demonstrates a maximum expansion of volatility.
By examining the chart of PG, it is much easier to determine that micro patterns do in fact subsequently lead to longer-term macro patterns. PNG appears to be bullish dominated and experiencing increased accumulation over time. Although 2018 was more turbulent than two years prior, 2019 yielded favorable results for the security along with other existing industry leaders.

Facebook, Holding between ranges. FB- Canary Jones
Market Climate:
Neutral. Hold. Going-Long.
Industry:
Internet Services
Indicators:
None
Patterns Identified:
Rising Channel
Broadening Wedge
Facebook stock price has for the better of eight years remained trading within a highly respected bullish rising channel. Similar to other major securities or blue chips currently on the S&P 500 or the Dow Jones, Facebook has recently broken beyond major resistance signifying a continued confidence in the integrity of both the security and of overall US economic health. During this breakout, volatility has significantly increased both abroad and domestically. This can be seen by the developing broadening wedge synonymous to the expansion of market volatility.
Canary Jones analysts have identified the broadening wedge of Facebook as a potential consolidating structure. Although the price has re-trended back into the original rising channel, the price has also exited and entered on other occasions. Yet, the stock continues to respect the prevailing macro trend.
Although Facebook user activity has remained a challenge for the company to retain high usage and greater amounts of screen time, Facebook has directly taken actions to prevent its consumers from spending exorbitant amounts of time on its platform. This has slightly made Facebook a less attractive advertising alternative to other existing platforms such as Google ads, YouTube, and even now Amazon.com.
Facebook’s continuing dominance of online social media has also for the most part created a negative consumer consensus that directly impacts their willingness to continue use for prolonged periods of time. Additionally, a string of data breaches and questionable ethical activities has simultaneously disrupted consumer image of the company and its brands.
Facebook’s stock price is currently trending between both the consolidating wedge, and the macro rising channel. This crossover has lead Facebook bulls to being indecisive of both direction and reasonable entry. Facebook bulls should consider entry on the supports of either the rising channel, or the broadening wedge so long as confirmation of candlesticks is also evident.

Visa. Examining potential downside risks. VAssessment:
Neutral Hold- Going Long.
Market Climate:
Bull controlled, increasing volatility.
Industry:
Financial Services
Indicators:
None
Patterns Identified:
Harmonic ABCD
Macro Broadening Wedge
Visa has seen steadily rising bullish accumulation since first breaking out in December 2012. Since then, the security has experienced a change in price of roughly 612%. The security has been methodically traded between two ranges demonstrated through the broadening wedge depiction. More importantly, the stock has broken beyond the major resistance line of the broadening wedge, pulled back, and continued a break out extension symmetric to the pole of the wedge structure.
However, with mid-2018 to late 2019 thus far facing significant increases in overall volatility by a variety of factors, the security is for the short-term from a technical standpoint demonstrating an increase of inherent risk to visa bulls. With echoing discussions of an impending recession, international trade tension, the effect of the Fed on the US economy, and the slowing of corporate earnings visa may be in a tight position that could affect the value of the underlying asset. Take note of the harmonic ABCD.
The ABCD demonstrates a breakout structure from the stock’s primary macro trend. An ABCD harmonic cresting either at or breaking beyond major resistance typically indicates the potential for change in trend or direction. Although the overall security remains controlled by bullish accumulation, visa bulls may begin to sit sidelined waiting for a more defined consolidation structure.
There is also room for down trending to occur back to the previous macro support within the wedge. Similarly, a pullback to the broken beyond resistance line now became support, displays significant area for the stock to decline before a more attractive entry becomes available. Long-term investors who have taken a long approach should consider reducing on other lagging securities while similarly waiting for an activity of greater confirmation. Keep in mind, that a short-term devaluation in the overall underlying asset does not necessarily signify a reversal of control from bulls to bears.

Bull Flag Gives 20% Gain OpportunityThere appears to be a bull flag forming on the $INS chart. If we can close above the upper resistance, i anticipate us to see a 20% increase at least. This is a hot coin right now and i think this chart looks healthy. This is all coming after $INS turned support into resistance. If the flag breaks down, I would anticipate price to touch the bottom of the wedge. As always, use a stop loss in this trade.
*This is not financial advice. I am not responsible for any losses of money.*

HSBA trending downwards, currently holding supportJust throwing some lines on HSBC (HSBA) .
We have a broadening channel, higher highs and lower lows on a 20 year timeframe.
Currently in a downward trend on the monthly, just about holding historical support.
This would probably be a good place to exit if we are expecting a market downturn.
"These formations are relatively rare during normal market conditions over the long-term" - Investopedia

BTC - Broadening Bottom halts more downside?Last month I saw a bearish gartley harmonic developing that probably ended closer to a bearish bat harmonic.
The long was successful and so far the short has been too (link below)
I had seen no potential for failure in this short until 2 days ago when we started to develop a broadening wedge. This analysis is neutral not long until a 4 hour close confirms this pattern and I'd want to see more upside before considering a long but I am considering it.
Good luck!

#bitcoin - Possible bearish diamond top "H2"During the day a new pattern, that is considered bearish has come into play and possibly marking a high, a diamond-top. Also taking into consideration, that we have developed a bearish ascending wedge, it becomes more likely that we have seen a local high now. Possible targets for this are not $8k .... those are $10.7 and $10k, where we would have to look at the possibility of making a symmetric triangle which can go both ways, instead of the former mentioned ascending triangle which is rather bullish nature.
This is only H2 interval, so nothing that is going to have an intense influence on the further longterm development. Keep an eye out.
_____________________________
Warm regards,
Neru
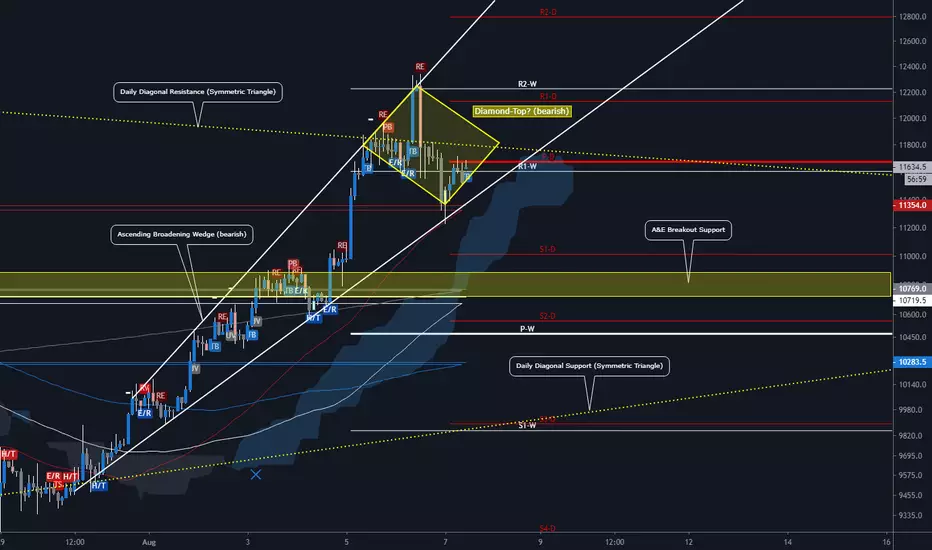

This is a beautiful chat, We hava two chart, Broardening wedge and Ascending wedge.
Diamond Formation
www.forexstrategieswork.com
The diamond pattern is a rare pattern but when it occurs you can expect price reversal on the horizon. This is usually formed at the top end of the rally and as the name suggests the consolidation leads to a diamond shape pattern.
Broadening Formation or Broadening wedge
The broadening wedge is where prices consolidate and in the process form higher highs and lower lows, thus expanding the range. At the end of the consolidation, the broadening wedge pattern breaks by forming a lower high before price fall sharply. The broadening wedge pattern occurs in a bullish trend. Similar to a rising or falling wedge pattern, the broadening wedge pattern is formed by five reference points.
