Is the upside move starting to reverse\consolidate?This big surge over 10k is starting to form a broadening topping pattern that suggests that once the support is broken BTC will either correct downwards to test the 10k mark once more, or at the very least start to consolidate for a bit.
That being said we are still inside the pattern and we could have another retest of that resistance at about 11k.
What do you think is happening?
Share your thoughts in the comments!
Broadening Wedge


Bitcoin has trolled the poor bulls so hard..Poor bulls.. I feel so bad for anybody who tried to catch these breakouts and waited for an actually substantial dead cat bounce with any kind of high leverage.. over and over again bitcoin has conformed to a broadening falling wedge that calls for a breakout, but instead of giving the bulls any kind of substantial dead cat bounce to trade, bitcoin was so bearish that it promptly reversed back down and scared away\liquidated anybody who thought this could lead to a stronger dead cat bounce or even a retest of the highs..
And that's why (should) use stop losses kids!
Bitcoin is STILL within one gigantic falling broadening wedge again that is actually legit and confirmed and everything, but it is so freaking enormous now that I have a strong feeling that this entire correction might be confined within this huge corrective pattern, and that that breakout could maybe possibly be (perhaps) the actual trend reversal back upwards (MAYBE) that will confirm the bull market and possibly take us back up to retest the 20k levels eventually.
Personally I am still holding onto several short positions from the 13k and 14k tops (whatever is left from those positions) and i am planning to hopefully gradually exit them almost entirely in the 8k to 9k range, with many orders stacked up in the 8.8k area and the 8.2 area.
What do you guys think is next for BTC?
Share your thoughts in the comments!


#Bitcoin - Hot Stuff, don´t get burned!We are with rather bigfoot steps approaching our leadline of bearish broadening wedge. Last nights close below monthly pivot, below the current daily trendline AND below the neckline of the w-top pattern is shipping us into deep waters. If this diagonal leadline get´s broken with volume we will go into further correcture. Overall first target 8,9k and 8k USD.
*Always set stops. Dyor. No financial advice.
If you are interested in using the NeruSuite v5 (final), please contact me in Telegram @NerubicaC or here in TradingView via DM .
____________________________________________________________________________________________
BitMEX Ref-Link for 10% Fee Discount the first 6 months: www.bitmex.com

#Bitcoin - Important Price Levels 3DGood morning everyone, I have been asked to label the important upcoming resistances and supports with a price tag. As you know me I am working with breakout-levels, PivotPoints and 3 SMAs. Here we go, please still keep an eye on the hidden bullish divergence on 3D that will be hopefully close bullish today to produce further upwards potential, as it did in the young past cycling us up in a parabola (that is not necessarily finished yet). Also watch the lower broadening wedge Leadlines, if they get broken we will likely see an adult correcture. Wait for things to happen if you are longterm trader and not in yet. Buying now before important levels have been broken again does not make sense for now, due to the fact there is a chance of getting the opportunity to buy lower than this. Intraday and shortterm traders obviously need to loo at lower timeframes <H4.
*Always set stops. Dyor. No financial advice.
If you are interested in using the NeruSuite v5 (final), please contact me in Telegram @NerubicaC or here in TradingView via DM.
____________________________________________________________________________________________
BitMEX Ref-Link for 10% Fee Discount the first 6 months: www.bitmex.com

#Bitcoin - the importance of Divergences and Pivot 3DI will leave this chart fairly uncommented, it should be very clear what happens, if we start a move up, or will close below the monthly Pivot Level on 3D. Everyone should know how to figure out targets and what happens if they are either met or failed. Pivot´s and Divergences (also Volume) are three of my seven favourite indicators that I have melted into a tool, and that for a very good reason.
*Always set stops. Dyor. No financial advice.
____________________________________________________________________________________________
BitMEX Ref-Link for 10% Fee Discount the first 6 months: www.bitmex.com

#bitcoin - Room for further correction H4I am back with updates. Bitcoin once again is within a quite important range (between Monthly and weekly PivotPoint, yellow and red), and also already once failed a breakout attempt. Tendency from here would be simply more down then up, knowing that this is not really tradable right now, due to the fact we all know Bitcoin has alot of surprising potential. Important ist the upper red trendline (breakout level), that need´s to be left behind to develop further up movement.
Don´t forget even if BTC correct even down to the red box, it´s still within the range of a perfectly normal and non-bearish correcture and should not raise fud. As well the broadening wedge support has not been hit yet, so for now we are still far away from a bearish scenario like a BumpnRun.
TO BREAK: $11700
NEAREST SUPPORT: $10700
BULLISH TARGET: $13900
BEARISH TARGET: $8770
(Broadening Wedge Support: $10100)
*Always set stops. Dyor. No financial advice.
____________________________________________________________________________________________
BitMEX Ref-Link for 10% Fee Discount the first 6 months: www.bitmex.com

6.84R 197.1 Pips 134.838 Target Price (GBPJPY)Measured Move 197.1 Pips | Measured Objective 134.838 | GBPJPY | Broadening Wedge | Risk Multiple 6.84

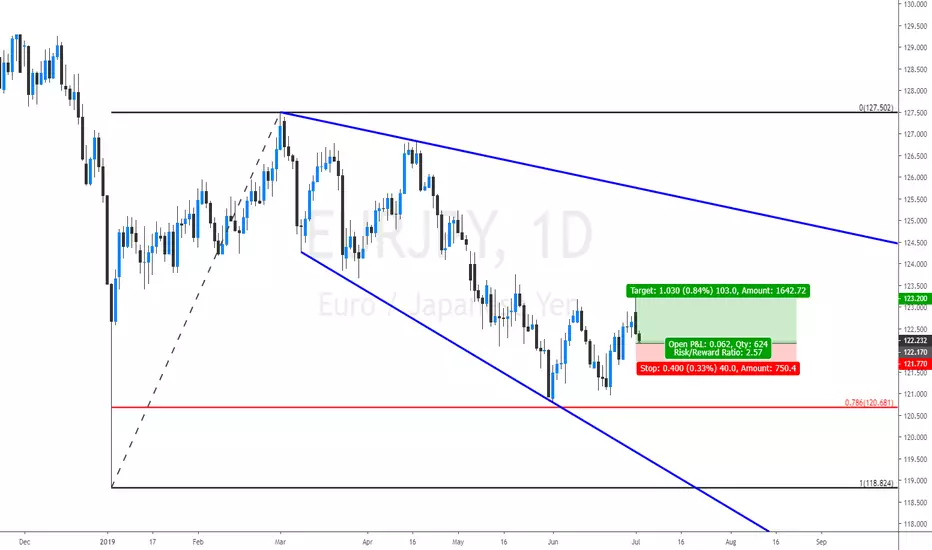
EURJPY - Exhaustion count on the intraday chart OANDA:EURJPY , FX:EURJPY , FOREXCOM:EURJPY , SAXO:EURJPY
Trade Idea
Intraday, and we are between bespoke support and resistance 122.17-123.20.
The selloff has posted an exhaustion count on the intraday chart.
Levels close to the 78.6% pullback level of 120.68 found buyers.
Price action has formed an expanding wedge formation.
The medium term bias remains bullish.
Further upside is expected and we look to set longs in early trade.
We look to Buy at 122.17
Stop: 121.77
Target 1: 123.20
Target 2: 125.60
#xbtusd #Bitcoin - Support Pivot failed for now.The new monthly Pivot failed for now, which means the broadening wedge support comes nearer, keep a good eye on that, simply cause a breakdown can cause a major selloff. Area of big stop losses is within reach now.
Always set stops, dyor, no financial advice.

Litecoin in a Broadening Wedge with $183-215 not Out of QuestionHi everyone! Before we get started, take a second to hit the like and follow button to get updates on this chart!
This is a follow up on the original LTCUSD idea published last week. At that time the 12H and 1D bollinger bands squeeze failed and Litecoin sold off.
Clearly, on the bigger picture Litecoin has been swinging back and forth within a large broadening wedge I am showing in blue. Although initially it broke the bull neckline at $119 and headed down to $110, it simply expanded the bull neckline a bit further with a previous wick we had few months ago and remains in the broadening wedge from which we bounced hard back from its bottom.
As of now the higher target of $183-215 by the halving remains a possibility. But you will have to hold though all this sideways action and the Bitcoin swings until then.
Stoploss: $109

#xbtusd #bitcoin - Broadening Wedge holding for nowDifferent technical analytic methods come to different conclusions. In my case there are a couple of reasons, why we have found resistance specifically here and why I think, we will likely be still volatile, but not break it up further before July:
1. Target 2 (Pivot R3) was hit AND yearly R1
2. Upper trendline of broadening wedge was reached
3. BTC extremely overbought
4. Fast paced market dominance jump followed by harsh cool-off
5. Monthly Candle-Close ATH reached (probably the most important)
All this was followed by profit taking + shorting resistance levels + tight long stops triggers.
Number 5 is functioning as major break-out level and will restrict the way up, anything above this on a Daily would cause more $20k fomo. Remember, Bitcoin retraces likely between 30-40% in runs before breaking-up and rising even faster. We have a new July Pivot, if we close somewhere here, around $11.4k which is near the old break-out level. That area looks like a good swing support to me. These swings are likely going to take place within the Support 1 and Breakout-Level. This plans are adjusted, in case one of them breaks.
*Always set stops. Dyor. No financial advice.
____________________________________________________________________________________________
BitMEX Ref-Link for 10% Fee Discount the first 6 months: www.bitmex.com

#xbtusd #bitcoin hitting Target 2 pre-mature Bitcoin is just hitting not only Target 2, also the broadening wedge upper trendline and nearly spiking to monthly R3. Without making any assumptions on further progress, this is nevertheless a wild ride on a market dominance of 67% still on the rise pointin g out it´s not yet time for altcoins. Even if we will find some sort of stabilization here, it doesn´t mean it´s not gonna go higher. Keep a close eye maybe on a smaller timeframe how the price action or volume changes. At the moment longs are still stronger than shorters + profit takers. It´s an imbalanced scenario. A classic #disbelief to quote a famous cycle theory.
*Always set stops. Dyor. No financial advice.
____________________________________________________________________________________________
BitMEX Ref-Link for 10% Fee Discount the first 6 months: www.bitmex.com

#xbtusd #bitcoin $btc - #pivot #risingbroadeningwedgeFollowing up the lately 3D targetting for BTC, the only thing that changed, a former resistance turns now support. Anything else stays as it is until our trading range is broken OR the new month starts and provides us new target structures regarding Pivot Points. The bearish broadening wedge, the possible Bump´nRun and the Leadline did not move nor been touched. BTC is in a rally, that will find correcture. Answering the question when is rather off the plate, simply cause we can´t know when greed is satisfied the first time. Remember you have to react to price action, and not force yourself into trades you WANT to happen. That´s a safe way to get #rekt.
Make plans. React. Set Stops. Trail Stops. Make new plans on trigger. Behave like the market does.
*Always set stops. Dyor. No financial advice.
____________________________________________________________________________________________
BitMEX Ref-Link for 10% Fee Discount the first 6 months: www.bitmex.com

Bitcoin's Possible Failure and RetracementCurrently, the price objective of the broadening wedge has not been hit, that is bitcoin's failure. If the top of the broadening wedge does not hold, then it will most likely retrace.
In White, there was a small ascending triangle/Double top on the 4 hour time frame, and it broke out to the down side, it is possible that BTC will retest the top of the broadening wedge, which is around 10100 to 10000, failure of this area to hold will most likely indicate a retracement to the 6k levels as previously mentioned. This would also void the previous analysis of the parabolic move.
There is still ample space in the 4hr RSI to fail, however, a bounce off of anything above 40 would still be indicative of bullish moment, however, if it fails to bounce in that region, then the daily must be analyzed to identify, whether bearish moment has seeped into a larger time frame. In addition, there is a bearish divergence, however, this may only be worth noting on this time frame.
Previous Analysis:

#xbtusd #bitcoin $btc - #bumpnrun #broadeningwedge 3DThis is a wild ride. Bitcoin has almost touched $11k and the next obvious Target is around $11.5k where a local high from 2018 and R2 monthly meet and greet.
Looking at this I´d like to update on of my charts that you find attached. If this ride goes on it would not be surprising, that at one point we will head to the Leadline and produce a Bump´nRun.
When this is and how low we will go solely depends on how high we will rise in the first place. Also the bearish broadening wedge is still intact.
Always set stops. Dyor. No financial advice.
____________________________________________________________________________________________
BitMEX Ref-Link for 10% Fee Discount the first 6 months: www.bitmex.com

Bitcoin - Possible Failure of Head and Shoulder TopI did not realize that the right shoulder no longer had the qualities of distribution, which is volatility ; instead, it seemed much more stable which is a hint of accumulation occurring once more. It is highly probable that this pattern fails, however, there is supply at low 9000 levels. There might be some front selling to push the price down, but it looks like there will be a push to invalidate the head and shoulders top and since there are a multitude of shorts, there might be a following short squeeze.
It is highly possible that there is a rally to 9200 and this might follow the Wyckoff Distribution with a upthrust and a upthrust after distribution to hunt for shorts as this rally has pushed through. In addition, because the price seemed more stable, it is possible that this is accumulation for more moves to the upside.
As for the RSI, it bounced off of a point higher than 40, thus, this is bullish despite the divergences and this means that there are likely more moves to the upside.
Previous Analysis:

BTC's Complex Head And Shoulder TopI wanted to do a more thorough analysis of the right shoulder in regards to this pattern, and after more scrutiny, it appears as if the right shoulder is a rising broadening wedge (blue) with a rising wedge (purple)contained within it.
There is approximately 8 hours to the resolution of the rising wedge within the broadening one. Rising wedges are naturally a bearish continuation pattern, however, it is possible that they break to the upside, if it does break to the upside, it will break through the broadening wedge. I think that this is unlikely because there were two strong pushes to 8300, known as an upthrust (bull trap) seen under the white curve on the right most shoulder, that both failed.
In addition, there were three total pushes through the upper trendline of the rising broadening wedge with no success. This principle follows the rules of three (something to note, but not use to dictate the outcome). Thus, I will favor the downside break of this rising wedge and a downside break of the overall broadening wedge completely forming the complex head and shoulder.
Previous Analysis:

Bitcoin - Bullish #broadening on #Pivot #supportGenerally I am not turning back bullish yet, cause I find it even though we see signs of life in the price far too early to tell if this is bottomed for now or not.
I would like at least to see the 8k back and then overcoming the 8770 in a higher high as bullish confirmation this correcture does not turn into an ugly 5-legged monster.
I do not have to make any adjustments in the chart yet.

#Bitcoin - Careful we could turn to 7.6k from here. If we break down the 4h there is a possibility we correct further heading towards the monthly Pivot around 7.6k. A Daily close lower than this is considered short-term bearish.

Bitcoin - #risingwedge #broadeningwedgeThere is a very good chance we will see short-term further rise within the small rising and the bigger (not confirmed) broadening wedge. It´s likely bringing us to a necessary correcture towards Q4 this year. For this month we have a new Pivot around 7.6k and R1 around 10k. which is defining our range until it get´s broken in one direction. Anything else is fud or fomo.
Stay safe. Set STOPS. Dyor. No financial advice.
