USDCHF technicalthe price is forming a Broadening triangle with correctional waves and intermediate waves, minor and minute waves are also in count, this is not included in the chart as is will be too much on the chart..
the price have been in a strong uptrend the last couple of weeks, and a correction to the break of the triangle, can occur any time soon. a short position can be taken, with a SL at the last top. where tp will be around 0.98500.
If you look at the weekly chart for the pair, a weekly evening star have been forming, and could be indicating a correction back to the triangle, before further upside.
Tuesday PPI m/m for CHF will be released where the numbers are expected to be greater than previously. this can help the price to make the correction,
Broadening Wedge

Possible Ascending Wedge on the 15-MinuteThere seems to be broadening wedge on the 15-minute chart. Price movement is contained and is alternating between the two non-parallel trend-lines (white lines). This tends to suggest the end of a rising price trend and the start of a reversal. Good risk/reward ratio. Will short here.
Average Entry Price: $9435
Stop Loss: $9603
Final Target Price: $8884
Risk/Reward Ratio: 3.07
I will also be watching the $9200 level, as there is decent support there. Will update accordingly.

WABI Ascending Broadening WedgeWabi appears to be in an ascending broadening wedge formation, right now with a partial pullback out of it's channel.
Look for a reversal once it reaches the top at 1.272 (0.00014309)
Breakout is most likely downwards from this pattern, with a 10-15% drop likely, retrace back to Fib 0.618 (0.00011388) or even the 0.5 Fib retrace.

Litecoin And Classical Charting - No Elliott Waves. Promise!Hello Dear Friends! :)
Today we are gonna look at only classical charting, and try to identify the different patterns. This is an educational chart - I hope you will enjoy it!
Let's start from the left:
1. Bear Flag (Steep downtrend, followed by a small consolidation to the upside, and then another steep downtrend)
2. Broadening Ascending wedge (bearish pattern)
3. Down Channel
4. Ascending Triangle (bullish pattern)
5. Symmetrical Triangle (neutral)
6. Another Bear Flag
7. Ascending wedge (bearish pattern)
8. Bullish MACD-Cross (When the blue line crosses the orange, which means that the bulls are gaining momentum)
9. RSI - Regular Bullish Divergence (The price is making lower lows, but the RSI is making higher lows, which means, that we are about to end our downtrend and will go into a reversal)
Can you find other patterns?
D4 Loves You <3
Please leave a LIKE for this alternative educational post :)

Here Is The BITCOIN-Path You Need To Know About - I Will Show U!Dear Friends!
D4rkEnergY is back with his A-game. It's a tough market at the moment, but I have been pretty spot on lately. I'll admit when I'm wrong - and I have been that several times - but we have to remember to give our self credit, when we do a good job too.
I can still see in the comment sections, that some ignorant (meant in a good way) people believe or think, that a good trader can be right all the time. Let me quote MY MAN, Peter L. Brandt, profitable trader since 1970s and authors to many books about TA and trading. He wrote the following on Twitter yesterday:
"I am wrong 60% of the time. This means that my default emotional expectation on a trade should be that this next trade will be a loser"
So next time you feel the urge to shout "WRONG AGAIN" to any Top Author here on TradingView on Twitter, then just have the above mentioned quote in your mind. One of the most famous traders in the world is "only" right 40 % of the time!
Now let's take a look, at the 1D BTCUSD Chart. So far it is going according to my prediction. I told you about our sideways movement for a while, and the corrective ABCDE-pattern. At this moment we are riding on the E-wave and I expect we will go a bit higher. We have a bullish MACD-Cross and the RSI, that give us room to finish our corrective pattern.
Hereafter I expect that we will fall. The ABCDE-pattern is a bearish sign in a bear market, and it will also match with the time we hit RSI resistance at level 45. We will then fall down to around 6,000 which will give us a bounce because of the double bottom and due to the fact that we are in a descending broadening wedge.
BUT it will NOT be enough to send us in an uptrend though. We will eventually fall lower again, and when we reach the....
.... MAGIC NUMBER.....
4,888.7 USD, we will FINALLY go in an uptrend and to EUROPA!
D4 Loves You <3
As always guys - Please hit that LIKE-BUTTON. It means a lot to me - thx in advance, my friends :)


Unclear ARDR directionLike many of the Altcoins ARDR has been in a long slow decline. The bottom support of 0.0000300 BTC have been tested a couple of times and seem to hold. During the last four days ARDR have forming a Symmetrical Broadening Wedge which is an indication of increasing price volatility but no indication of direction as these wedges can go up or down. The Bollinger Bands are tightening which indicates there is price movement on the way. The upper resistance have been touched four times. The MACD shows an upward trend. The RSI is staying above the 50 line.
Most of the indicators are positive but low volumes will likely see a drop to around the 0.000032 BTC level by the end of the weekend and then a slow climb and possible breakout around 30 May. Suggest a wait and see approach before making any ARDR decisions.
As always do your homework and make your own investment decisions.

BROADCOM Long Opportunity CHART TIMEFRAME: DAILY
PATTERN : BROADENING WEDGE
Details as described on the chart.
DISCLAIMER: This is a technical analysis study, not an advice or recommendation to invest money on.

BTC Busted BottomHad BTC broken out upwards, it would have confirmed the existence of ascending triangle which in turn, along with broadening descending wedge, would have confirmed that bottom was reached. However, breakout downwards suggests that it was a rising wedge which acted in line with the prior move, as per the direction of the butterfly.


BTCUSD Bullish after Declining broadening wedge, buy&sell quickHi Guys, quick Analysis,
i spotted a declining broadening wedge on BTC USD. After H&S formation the support couldnt even be broken by the downtrend after H&S, now trend switches probably and goes for formation target at the first highest high of formation @ 15300 USD after breaking declining broadening wedge top-line.
Wait for confirmation and once it breaks the falling trendline on top buy for quick profits with sell order at 15300 or close below.
Formatino confirmed by 2 touches on each line !!

EURJPY Broadening WedgeBroadening Wege pattern.
Conservative: wait for better retest or a trend continuation setup.

EURJPY Broadening WedgeBroadening wedge after volatile momentum short yesterday. Watching out for a breakout to initiate a respite probably back to 30 min EMA.

Broadening wedge earnings playUSM is now in a broadening wedge pattern. Past volatility has proven profitable, hence my long order is till 50 MA and my short order is till the last low.Also, the volume has decreased showing there maybe a large breakout about to come and the Coppock curve is in a horizontal pattern and has also gone negative so it may rebound and go positive.

EURCHF Broadening WedgeEur consolidated and tested the 4h 100 EMA multiple times, broke out and retested the EMA.


Ascending broadening wedge - two possible scenariosThis is an interesting move folks; identifying an ascending broadening wedge pattern has the same chance more or less to continue downward or to breakout and go upward. In my opinion, based on the bigger trend's descending triangle wedge, and the minor descending triangle wedge following it (the fib retracements placed on the graph), my bet would go towards the bearish breakout.
What do you guys think?
Below are some interesting facts to use in your strategies:
Bearish breakout
If the wedge’s lower support line breaks, the probability that the price will reverse and continue back up is higher than it falling lower. The odds are close at about 51:49.
Selling at a downward break of the mid line of the pattern greatly improves the odds of success. If the price breaks the mid line of an ascending broadening wedge, there’s a 53% chance that a further downward move will happen.
Bullish continuation
From historical currency data, there is about a 55% probability of a further bullish advancement after a break of the upper resistance line. The bullish move lasts at least for the same duration as the pattern itself.
Based on historical forex data, the ascending broadening wedge typically ends in a bearish or downwards correction in price. But only just.In 47.8% of the patterns, the upside move was greater.
Reference/Read more at:
forexop.com

Broadening WedgeA beautiful broadening wedge? Seems if fit the properties perfectly. Breakout target at 124 yens. Go long around 117.
Close long if it doesn't close above resistance and wait for the next swing.

EURGBP Daily StructureI am watching for price the .83000 level. Here and only here will I look for a buy setup for this pair. If price decides to break the area then the idea will change.

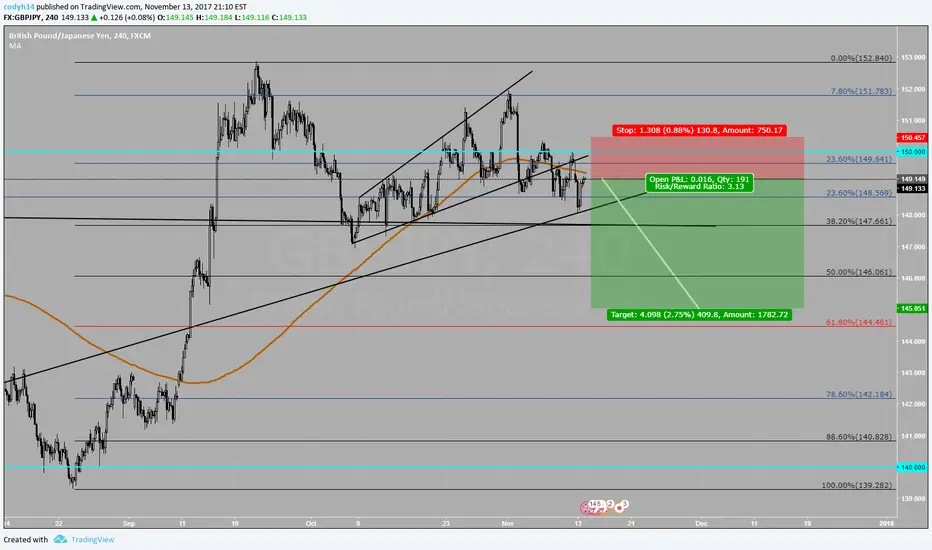
GBPJPY - broadening wedge & HS patternWait for retest of neckline
Will it test the neckline? not sure? but it will be the best risk reward ratio setup
Don't chase, wait for it


GBPCAD - Easy 600 pips trade setupA close below the broadening wedge would expose the bottom of the broadening wedge
Great risk reward ratio trade
