BTC LTF UPDATE! $50K OR $43K?Hello everyone, if you like the idea, do not forget to support with a like and follow.
Welcome to this BTC/USDT update. BTC looks fine in LTF.
BTC is making a broadening wedge structure in 1hr time frame. Currently, it is trading at $45,900 and holding the support of $45,500 well so far. I'm expecting a good bounce from here.
BTC has a resistance at $47k. Once it breaks as well as this broadening wedge then we are ready to go $50k
If BTC looses $45,500 support then next support for BTC is at $44k and at $43k
I'm expecting a big move incoming soon. Let's send it to $50k
What do you think guys?
Do you think $50k is incoming or we have to see more correction?
Share your views in the comment section.
If you like this idea then do support it with like and follow.
Thank You!
Broadening Wedge

ENJ In in a Broadening wedge & It can Do 2 Things!ENJ is in a Broadening Wedge Pattern. This Means It can range In It Since There is no Break out Happend yet! But The odds of Doing a Break out Right now Is Not Zero! Since The Market Has Started a New Bullish Trend It is Possible for ENJ to be able To Break the Broadening Wedge Pattern.Right now The Best Support Level for ENJ Sits around 1.7$. There are 2 Scenarios Right now! One Is That ENJ would Like To Stay in The Broadening Wedge & Reach 2.150$ and Start Correction From The Top of it Back to the Mentioned Support Level! another Thing Is That Enjin Coin Would Break the Pattern and Start a Strong Bullish Wave From There! The Biggest Resistance afterward is 3$! We Shall See The Reaction From The Resistance (2.150$ The Red line ) Soon!
_ _ _ _ _ _ _ _ _ _ _ _ _ _ _ _ _ _ _ _ _ _ _ _ _ _ _ _ _ _ _ _ _
Thank you for seeing idea .
Have a nice day and Good luck

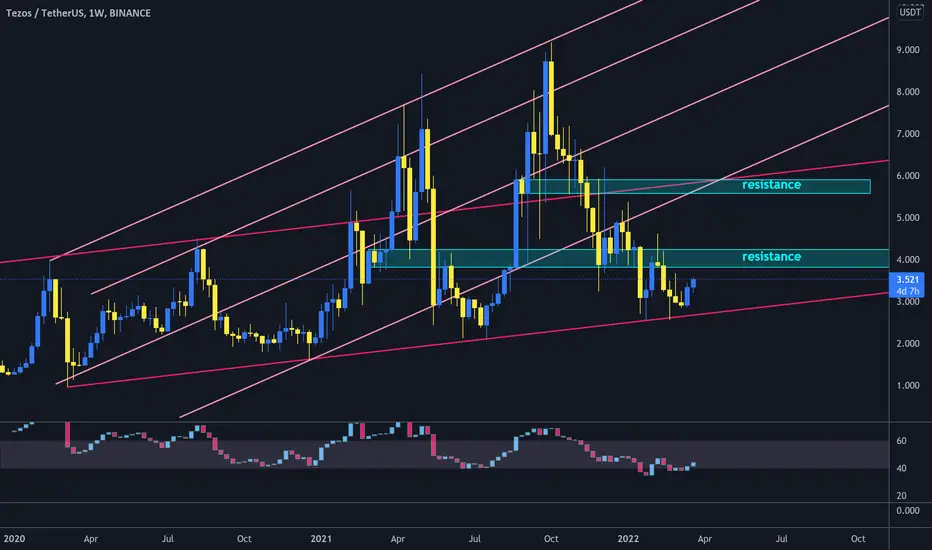
XTZ inside broadening wedge#XTZ/USDT
$XTZ touched the lower line of broadening wedge and hold it as support. and now try to break out from descending resistance in daily time frame.
🐮 price can head up to resistance zone around $4.
break out from $4.3 can increase price to resistance zone around $6 that is the same with 2 ascending trend lines.
MIR - Broadening Descending WedgeJust a quick simple overview of what I see on the MIR chart. It seems to be forming a textbook descending broadening wedge, and from the counts I receive I expect one more leg down near .90 before a massive move up.
This fits in with my bearish perspective on Alts, such as FTM - Idea here
And the macro perspective of BTC market as a whole - Idea here

Bullish Shark PCZ at Bottom Half of Broadening WedgeWe have Two Instances of Bullish Divergence on the 4 Hour MACD at the Demand-line of a Descending Broadening Wedge and PCZ of Bullish Shark and if it plays out we could very well see the top half of the Channel from here.

GBPJPY Analysis >>> BearishGBPJPY breaks the Descending Broadening Wedge Pattern on H1 and going to the yellow horizontal line
Price will retest the Classic Support on H1, EMA 34 on H4 and EMA 200 on Daily time frame before it continues down
Enter Short Sell trade after MACD crossover above 0 level on H1
Target Price is on the 1.618 External Retracement Cluster
FX:GBPJPY
-Fibomic International-

🌳BTC has a Great Bullish Chance !🔵🟡Chart is speaking it self!
Bitcoin / U.S. Dollar
-BTC Is in a Broadening wedge.
-The Price can range in this pattern as long as there is no Break out.
-Right now The Price is at The Bottom of the Pattern
-(+HD) on Both MACD & RSI
-The Odds of A Great Bullish Movement Is High!
- The chart is in Weekly Time Frame
-Mid Term Target 72K!
_ _ _ _ _ _ _ _ _ _ _ _ _ _ _ _ _ _ _ _ _ _ _ _ _ _ _ _ _ _ _ _ _
Thank you for seeing idea .
Have a nice day and Good luck

$MCD to 236 by end of quarter or all time highs$MCD - it took out the quarterly top, is now below 50% on the quarterly, and will likely make an outside bar candle (3) to take it to 236 by the end of the quarter. SHEEESSHHHH. This could also go the other way and look to make new highs again.
Quarterly (White Fib & Red 50%): Currently a 2-2 with the high taken out, possible 3 down candle this quarterly as price has now passed 50% at 252.93.
Monthly (Blue Fib): 2-1D Monthly 50% trigger
Weekly (Yellow Fib): 2-2D Weekly Bearish Continuation if it breaks 250 to the downside. Also has the potential for a Bullish Randy Jackson if price breaks above 256.92 which also happens to be the weekly rejection to the downside.
Daily (Grey): 2-1D Bearish Continuation or 2-1U Daily Reversal.
Volume Sentiment: The downtrending candles show more volume of sellers when compared to buyers on the uptrend. I would expect this trend to continue if we are expecting to see 236 by the end of the quarter. Should this ticker decide to get bullish, I will be watching for price to move to the upside increased volume of buyers for confirmation.
Bullish Targets: Look for a break above 252.29 on the daily with volume and take it up to 254.6. Should things continue with volume and if the area turns into support then you can take it up to 262 for the Bullish Randy Jackson for the week.
Bearish Targets: Look for a break below 250 on the daily with volume. Take it to 245.25 and 243.95. If we retest 250 and aren't able to break above that then you can continue to take it down to 236.16 for the rest of the quarter.
Overall I look for MCD to keep it hot with many options from the dollar menu bearish continuation to the big mac daddy bullish Randy Jackson (with volume) should things reverse from here.

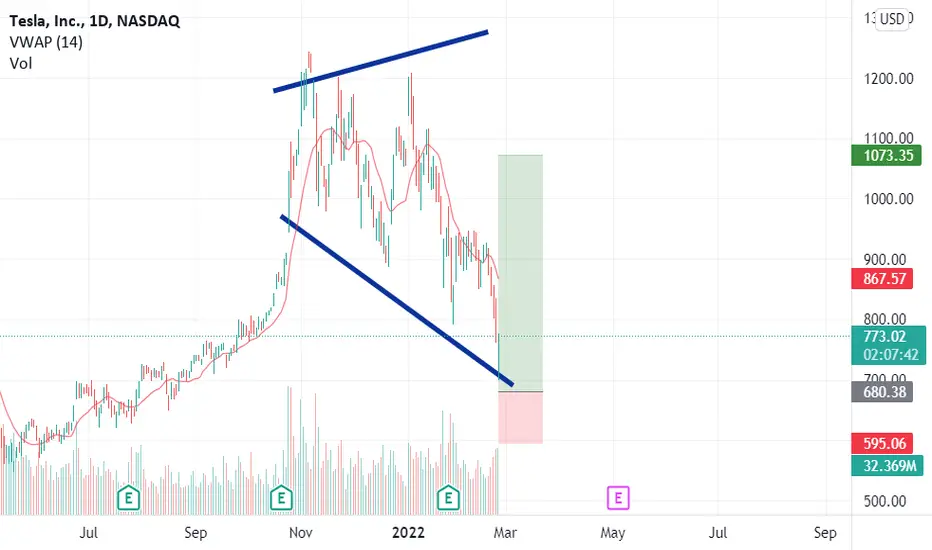
GOOD DAY TO BUY "TESLA"after the downward trend in the last 4 days today there is a big green volume and although it's so far under the VWAP and the candles is under the resistance but there is a broadening triangle and a few wedges and I think it's the end of the broadening triangle and there is an upward tendency and I think it's good time to buy although the war between the Russia and Ukraine
Expanding wedge pattern in 1 hour time frameWe can go long when it touches and form a bullish price action on lower wedge


DOT/BTC: Expecting Bullish MovementHi every one
DOT/ BTC
DOT/BTC is in a Broadening Wedge Pattern. This Means The Price has a Great chance To Still Range In This Pattern cuz There is No Break out Here yet. We Can See That The Price is right at the Bottom Of The Mentioned Pattern. So This Means The Price has a Great Chance to Increase From Here and Reach The Top of The Broadening Wedge Pattern Which is also a Resistance Zone For it as well. There are also Regular Bullish Divergences (+RD) On MACD & RSI which Makes Us Think The Expected Bullish Movement is Pretty Reliable.
What Is Polkadot (DOT)?
Polkadot is an open-source sharded multichain protocol that connects and secures a network of specialized blockchains, facilitating cross-chain transfer of any data or asset types, not just tokens, thereby allowing blockchains to be interoperable with each other. Polkadot was designed to provide a foundation for a decentralized internet of blockchains, also known as Web3.
Polkadot is known as a layer-0 metaprotocol because it underlies and describes a format for a network of layer 1 blockchains known as parachains (parallel chains). As a metaprotocol, Polkadot is also capable of autonomously and forklessly updating its own codebase via on-chain governance according to the will of its token holder community.
Polkadot provides a foundation to support a decentralized web, controlled by its users, and to simplify the creation of new applications, institutions and services.
The Polkadot protocol can connect public and private chains, permissionless networks, oracles and future technologies, allowing these independent blockchains to trustlessly share information and transactions through the Polkadot Relay Chain (explained further down).
Polkadot’s native DOT token serves three clear purposes: staking for operations and security, facilitating network governance, and bonding tokens to connect parachains .
Polkadot has four core components:
Relay Chain: Polkadot’s “heart,” helping to create consensus, interoperability and shared security across the network of different chains;
Parachains: independent chains that can have their own tokens and be optimized for specific use cases;
Parathreads: similar to parachains but with flexible connectivity based on an economical pay-as-you-go model;
Bridges: allow parachains and parathreads to connect and communicate with external blockchains like Ethereum.

10 Year Note - Testing Weekly Upper Bound of Broadening WedgeAll eyes turn back to inflation and rates as the economy is creating jobs. Scouting the reopening trade for Q2.

TOTAL inside broadening wedge#TOTAL
TOTAL MARKETCAP is inside broadening wedge that touched the lower line and now can head up to 1.82 trillion level, this level can increase BTC price to $40k.
breaking out from 1.9 trillion level will certainly reach #BTC to $42k.
but if reject from resistance zone it will drop to support zone around 1.4 trillion that makes BTC price around $29k or less.

Bond Broadening - in 3DVolatility is the name of the game as the major indexes were in a big range all week. The Nasdaq is testing it's 2 hour UBB with a Bull Flag under resistance. The Russell 2000 also has a Bull Flag after finding 2hr LBB support, setting up a potential Lower High under the 2h 50 SMA. The Bonds gave back the bull break during the FOMC meeting and are now showing a choppy head and shoulders, on the 30 minute, which does not have the nice rolling shoulders. The weekly iH&S neckline remains a point of control.

We look for Reversals...Just an insane day in the Markets, As we knew.. we did not hold short. What did we know, we look for a reversal. We hit our outside quarter target and fell a bit more towards our 420 level before ripping almost 20 points into the close. Is this the bottom? It does NOT MATTER. We trade what we see, each day is a new day. This market can fall just as quick. We add our probabilities and take the highest set ups. Good job to those who caught the reversal here.

BTC - Broadening in 3DEquities and BTC found their short-term relief rallies. BTC has a broadening range beginning to shape-up.

ATOM's Movement scenarios In The Next Few DaysHi every one
COSMOS / TETHERUS
ATOM is in a Broadening wedge. The Price is gonna range In this Pattern For Now Since There are no Clue of a Break out or Sign of It. So right Now The Price is at The Top of The wedge But It shall Start To Decrease Soon. ATOM has Not been Able To Break It's ATH 3 Times in a Row(Around 44$) So The Odds of Doing It for The 4th Time Is Pretty low. In The Best Possible Scenario It would Decrease to The Drawn Support Zone and Then It would Start To Increase Again. Even a Break out Might Happen & we would See ATOM above 44$!
This is only an idea and not a financial advise ( NFA )🔴
💎Traders, if you liked this idea or have your opinion on it, write in the comments, We will be glad.
Thank you for seeing idea .
Have a nice day and Good luck

#SPY - Possible Reversal or Earnings Tank?SPY hit our Outside Month target this week and has yet to gain momentum to the upside. If bears can continue here we can drop to 427 next. We are nearing seller exhaustion and the broadening formation. For this week it can get choppy if we don’t break below 435. Id be looking for a sign of reversals around these level for a pullback before another dip down. Calls will be easier once we can close above 448.

Outside Month Achieved! SPY hit our Outside Month Target today at 448.91. Nice run on the drop here. Harder to enter puts now until we see a break below the broadening range. Can still push further down a bit. Almost time to look for a long reversal to get in on a pullback.

Triple trend line intersection on BTC daily. I have had a descending, broadening wedge drawn for a while. Somewhat later I identified a falling wedge inside of the broadening wedge. I noticed an intersection of the supply lines of the two wedges and the demand line of the falling wedge. It corresponded to the lowest daily price for BTC, so maybe it does have some significance. BTC previously broke out of the broadening, descending wedge. This low represents a backtest of the previous supply line (now acting as a demand line). I'm not sure if back testing the previous supply line of a broadening wedge is something that has much significance. I would think it does have some significance but possibly not a very strong signal?

Tyson Expanding WedgeNoticed this and thought I would share.
Unsure how to trade this.
Elliott waves would seem to say its bullish.
Moving averages are trending with positive momentum.
Thomas Bulkowski book seems to say possibly bearish.
I am limited on time today. More to come.
I think this will be bullish but am unsure

XTZ can Be Bullish Here is Why.Hi every one
TEZOS / TETHERUS
XTZ is In a Big Broadening Wedge Pattern. This Means The Price Can Range Between This Pattern Freely Until a Break out Happens.Now The Price is at The Bottom of This Patter So There is a High Chance For Bullish Movement To Happen Soon. The Resistance Is Shown on The Chart.
This is only an idea and not a financial advise ( NFA )🔴
💎Traders, if you liked this idea or have your opinion on it, write in the comments, We will be glad.
Thank you for seeing idea .
Have a nice day and Good luck
