BSE
Nifty Demand and supply zone for Nov. 2018 and Dec 2018
Sharing the Idea after long time, was busy with some personal work.
In today's idea i am sharing two charts, Nifty daily and weekly chart. Have marked Demand and supply zones on chart.
Every demand zone may provide the long opportunity and supply zone will give shorting opportunity.
Once price closes above or below demand/supply zone they change the role(Check the demand supply zone concepts on internet if you dont know them).
For near Future the up move can be expected as we are trading in demand zone, if price closes below the current zone then demand zone below the price will become target. There are many support and resistances which i haven't marked, please identify them and mark them on your chart along with demand and supply zones shared in this idea.
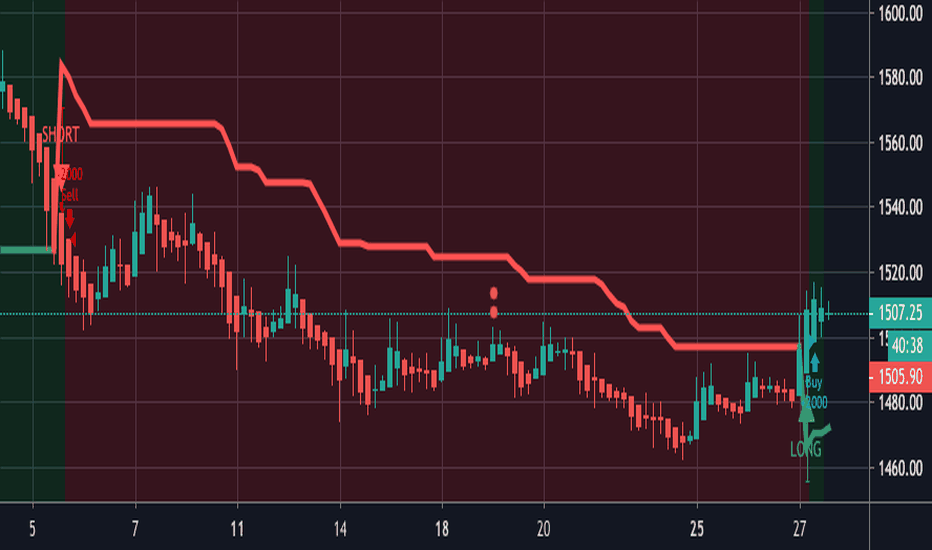
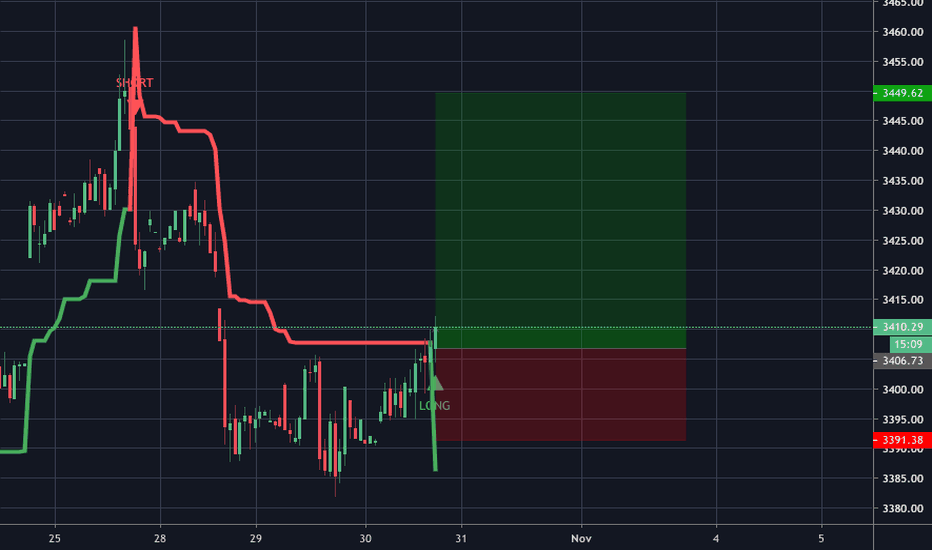
For entry and exit use my Vstop indicator script, have shared link for the same in this idea.
Following will be imp dates in future, we can expect price reversal on these dates.
30/10/2018
13/11/2018
27/11/2018
10/12/2018
24/12/2018
This idea is not investment advice, dont risk your money on the basis of this idea.
SBIN Showing Bearish Trend for Long Term investmentDont take any new entry in SBIN if you bought already then must use Stop loss 225.
if cames any good news for banking sector then you can some good movement otherwise Trend is Bearish .
Banking sector is not Right Time For investment wait some Years.
SBIN Very Good Opportunity Between 140-150.
Stay Tuned.......!!
Learn Here , Earn EveryWhere
VALIANTORG - A possible multibagger.BSE listed:
Name : Valiant Organics Ltd.
Code: 540145
Trading idea:
Long suggested above 1185
Stop at 935
Lots 40 (for a capital of Rs 1 lac and a risk appetite of 10%).
Technical rationale:
Stock has corrected 22% from 52wks high with low volumes
and has been in a consolidation phase for the last few days,
effectively scaling up by 10%.
Stock possibly finding support at R4 Cam pivot.
Fundamental rationale:
ROCE 47%
ROE 30%
D/E nil
Promoter holding 46%
YoY d_CFO 100%
YoY d_NP 41%
YoY d_Sales 64%
(all as on Mar 2018 ; Quarterly fig not available).
Risk:
Low volume stock.
Only BSE traded.
Highly susceptible to downward freeze in case of broader market correction.
BSE-500 SMA Technicals Chart50 days and 200 days Simple Moving Average (SMA) indicators for BSE-500 index chart
TATA CONSULTANCY SERVICES SHARE HOLDERS SHOULD KNOW THIS!the chart is self explanatory
i know many Indians with family and kids are holding their life savings in this stock
please read this and see the obvious bear in the room
DISCLAIMER - i don't have any TCS shares..... so hopefully this analysis is emotionally uncompromising
SADHNANIQ - A PROSPECTIVE MULTIBAGGER#SADHNANIQ
BSE listed
CMP 722
lONG SUGGESTED ABOVE 760
Stop 670
Target Open
Logic
Technicals
Stock in a strong uptrend with all key MAs sloping upwards.
VCP observed in daily charts.
Fundamentals
Strong exponential growth in eps in the last 4 quarters
Qn-4 Qn-3 Qn-2 Qn-1
Sales 15.27 15.9 27.38 51.39
Sales YoY qrly growth 20.1% 127.6% 166.8% 331.0%
OP 1.9 2.14 10.65 19.52
OP YoY qrly growth 19.6% 706.8% 730.6% 1730.5%
NP 0.83 8.08 21.86 22.32
NP YoY qrly gr 4050.0% -2706.5% 1648.8% 3620.0%
OPM 13.46% 38.90% 37.98% 52.84%
NPM 5.22% 29.51% 42.54% 33.91%
Promoter holding 74%
D/E 0.3
Operating cash flow mar 2017 to 2018 : 440% growth
RACLGEARTECH - VCP pattern observed#RACLGEAR
BSE listed
Long suggested above 73.
Stop 65
Target Open
Logic :
#VCP
Volatility contraction pattern
A TO B 43%
C TO D 23%
E TO F 13%
Fundamentals
Qn-4 Qn-3 Qn-2 Qn-1
Sales 13.1% 18.7% 77.0% 53.1%
OP -0.7% -9.0% 13.7% 165.3%
NP 53.7% 45.2% 68.0% 147.7%
OPM 8.50% 8.80% 14.76% 13.36%
NPM 3.23% 4.68% 10.71% 4.20%
Positives -
EPS has been on an exponential grwoth for the last 4 quarters.
Negatives -
Debt to Equity 0.82
Mkt cap Rs 70 cr
Promoter holding 48% (15% pledged; 33% unpledged)
HIGH RISK INVESTMENT. HENCE PLEASE ENSURE YOUR POSITION SIZE IS AS PER YOUR RISK APPETITE
POSITION SIZE CALCULATION:
Eg : Total Capital allocated for trading stocks : Rs 10 lacs
Risk appetite : 0.5% of Total trading capital = Rs 5,000
Entry price 73
Stop 66
Risk planned in this stock = Rs 7
Position size 5000 / 7 = 714 (Around 710 to 720)
So when 715 stocks are bought and if price reaches the stop of 66, the loss is Rs 5000 which is the risk accepted.