INDUS TOWERSINDUS TOWERS has breakout and retest major resistance level then some of consolidation level also breakout TGT up to ATH and this is only for educational purpose
BSE


KRISHCA KRISHCA STRAPPING has breakout consolidation level and TGT are mation in chart and this is only for educational purpose

GRWRHITGARWARE HI TECH FILMS LIM has breakout ATH resistance level TGT up to 4917 sl bellow 1951 and this is only for educational purpose not any buy and sell recommendation

SHRADHA AI TECHNOLOGIESShraaitech has breakout ipo resistance level and TGT up to 134 sl bellow 62 and this is only for educational purpose not any buy and sell recommendation

RATNAVEER PRECISION ENGThis stock has breakout IPO resistance level TGT up to 227 SL bellow 140
and this is only for educational purpose not any buy and sell recommendation

SOLARA ACTIVE PHARMA LONG TERM VIEWSolara Active Pharma is forming a rounding bottom formation or W pattern on Monthly TimeFrame.
The Entry and Stoploss would be considered on Candle Closing Basis.
Entry - Above 470
Stoploss - Below 273
Target - 1509
( This Target would be achieved in 2 years max from the date of entry).
NOTE:- This view is purely based on Technical Analysis and is for educational purposes only. Please consult your financial advisor before taking any trade

360 one wam ltdThis stock breakout HH HL pattern and ATH level so further up move will come and this is only for educational purpose


NSE:NESCO - Long term uptrend - slow mover👍
✅ Long term uptrend
✅ Averaging up
✅Key levels ( blue line) monthly closing basis
✅Company is debt-free K
✅Office, exhibition and food ( cloud kitchen) and Mumbai Real Estate play
👎
❎ Post COVID-19 office rental space to watch out
❎ Slow mover
❎ Missing growth is the Indabrator engineering business
Disc: Invested , do you own research

JUPITER LIFE LINE HOSPW pattern breakout Sl bellow 1200 TGT upto 1648 This is only for educational purpose

ELGI EQUIPMENT LTDThis stock breakout recent high and further up move will come TGT upto 915 SL bellow 645 and this analysis only for educational purpose

THANGAMAYIL JEWELLThis stock has breakout recent ATH resistance TGT upto 2579 SL bellow 1348 and this analysis only for educational purpose

BASFBASF INDIA has breakout 3 years resistance level and retest that level so further up move will come TGT upto 6439 SL bellow 4320
this is only for educational purpose

MISHTAAN FOODS LONGbroken out of a 5 year consolidation with good volume. looks good for the tp1 and final tp's at 200's which sounds unrealistic right now. but we will come back to this chart in a years time and see where we at.
#DYOR

RICO AUTORico auto has breakout nearly 19 years resistance and retest that level
TGT upto 229 SL bellow 120
and this is only for educational purpose

HARSHA ENGINEERSHarsha engineers breakout ATH TGT upto 882 SL bellow 445
and This is only for educational purpose

POEL All Time High Breakout with Volume.
Above all Key EMA.
Good for Short term.
Do Like ,Comment , Follow for regular Updates...
Keep Learning ,Keep Earning...
Disclaimer : This is not a Buy or Sell recommendation. I am not SEBI Registered. Please consult your financial advisor before making any investments . This is for Educational purpose only.

Bank Nifty Possible Next TragetEven though last week was a roller coaster ride and all were bullish , even though with the same government it is hard to go with the bullish sentiment .
I would still go with shorting as it has been almost 50% of recovery and now it go can down with much faster pace

SJS ENTERPRISES LTDThis stock breakout and retest there respective level
and this analysis for educational purpose only

ASHIANA HOUSING LDThis stock breakout ATH and Retest that level TGT upto 789 SL bellow 312
and This analysis for educational purpose only

GRINDWELL NORTON This stock breakout triangle pattern
and retest of this ATH resistance level
TGT will be 3571 SL 2300
This analysis for educational purpose only

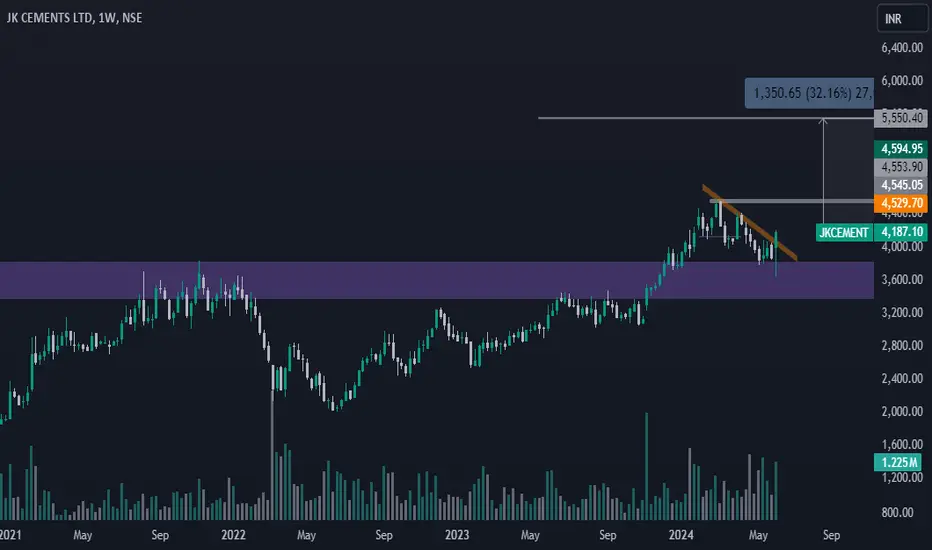
JK CEMENT This stock breakout and retest major levels and TGT upto 5550 and sl 3640
and this is only for educational purpose