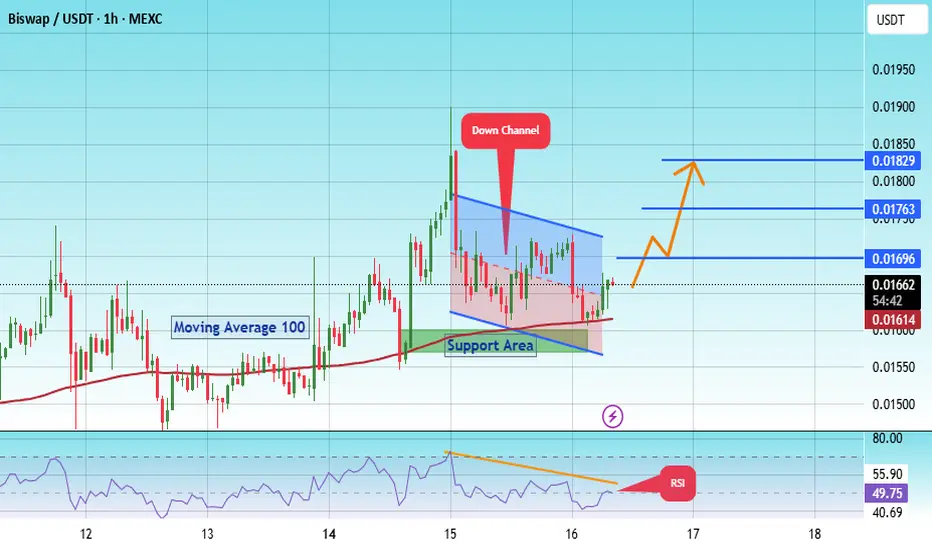
#BSW/USDT is bullish engulfing and also took ?#BSW
The price is moving within a descending channel on the 1-hour frame, adhering well to it, and is on its way to breaking it strongly upwards and retesting it.
We have a bounce from the lower boundary of the descending channel. This support is at 0.01580.
We have a downtrend on the RSI indicator that is about to break and retest, supporting the upward move.
There is a key support area in green at 0.01573, which represents a strong basis for the upward move.
Don't forget one simple thing: ease and capital.
When you reach the first target, save some money and then change your stop-loss order to an entry order.
For inquiries, please leave a comment.
We have a trend of stability above the Moving Average 100.
Entry price: 0.01650
First target: 0.01696
Second target: 0.01763
Third target: 0.01829
Don't forget one simple thing: ease and capital.
When you reach the first target, save some money and then change your stop-loss order to an entry order.
For inquiries, please leave a comment.
Thank you.
Bsw
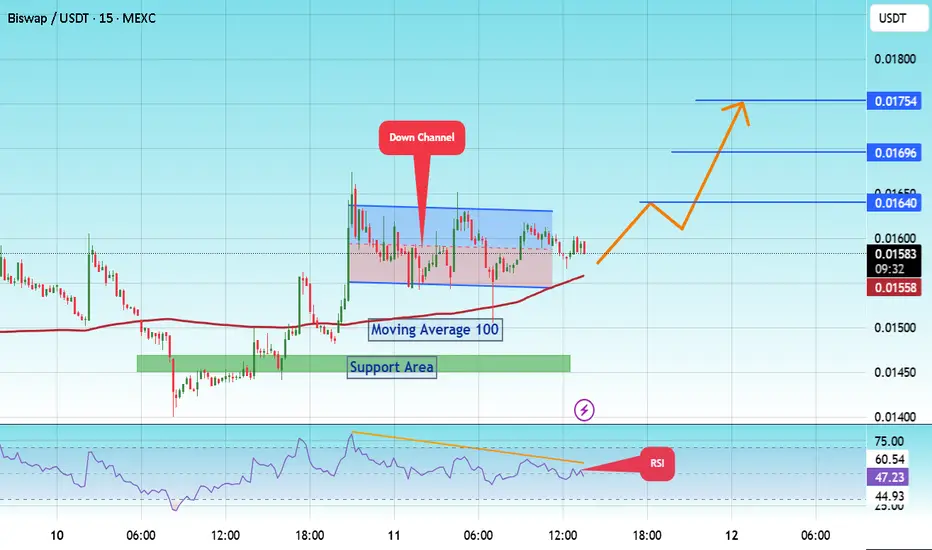
#BSW/USDT How Long Will It Take For A $0.01754 Target?#BSW
The price is moving within a descending channel on the 15-minute frame and is expected to break and continue upward.
We have a trend to stabilize above the 100 Moving Average once again.
We have a downtrend on the RSI indicator that supports the upward break.
We have a support area at the lower boundary of the channel at 0.01546, acting as strong support from which the price can rebound.
We have a major support area in green that pushed the price upward at 0.01450.
Entry price: 0.01595
First target: 0.01640
Second target: 0.1696
Third target: 0.01754
To manage risk, don't forget stop loss and capital management.
When you reach the first target, save some profits and then change the stop order to an entry order.
For inquiries, please comment.
Thank you.
#BSW/USDT is bullish engulfing and also took#BSW
The price is moving within a descending channel on the 1-hour frame and is expected to break and continue upward.
We have a trend to stabilize above the 100 moving average once again.
We have a downtrend on the RSI indicator that supports the upward break.
We have a support area at the lower boundary of the channel at 0.01060, acting as strong support from which the price can rebound.
We have a major support area in green that pushed the price upward at 0.01020.
Entry price: 0.01300
First target: 0.01545
Second target: 0.01817
Third target: 0.02083
To manage risk, don't forget stop loss and capital management.
When you reach the first target, save some profits and then change the stop order to an entry order.
For inquiries, please comment.
Thank you.

The opportunity to earn money on the vib exit pumpIn the coming days, against the background of the beginning pullback in the market, oversold coins from the delisting announcement may become very interesting for speculators, since for strong altcoins that have shown good growth this month, the probability of falling within the rollback prevails, and the threat of assigning the monitoring tag in the second half of the week hangs over weak coins. Today, there was not enough volatility in the market for the breakdown of vib wing and pda due to the lack of futures on them. After the stock market closes over the weekend, there is a possibility of a stable payback of these instruments with major breakouts. There is also a possibility of growth impulses at the beginning of the new week, especially from Tuesday evening to Wednesday, as part of a pullback on the current monthly candle, and on May 1st, a new monthly candle. Against the background of the beginning of the sales period, there is a possibility of disruptions tonight and from Sunday to Tuesday. Vib is in an extremely oversold position, and therefore a slight additional drawdown is possible. If the price approaches 0.01, there will be a good opportunity to buy, which will bring up to 150% profit even with weak dynamics and a retest of 0.025. An additional drawdown of up to 0.5 is possible for wing, and up to 0.00600-750 for pda. With sufficient volatility, there is a chance of growth up to 0.050-75 for vib, 2.5-3.5 for wing and 0.021-25 for pda.
Working with coins from the delisting announcement is extremely dangerous due to high volatility, but it can be extremely profitable, which we observed during the pumps of the previous delisting and the example of alpaca.
In the second half of the week, after assigning the monitoring tag, I will select coins without the tag that are insured against delisting.

The end of seasonal growth, reducing work positionsThe seasonal growth cycle is ending this week. For most of the market, the sales cycle begins on Sunday. In the new week, we can still expect pumps for the turn of the month for individual coins. From Sunday to Tuesday, the probability of a market drawdown prevails as part of a pullback on the current weekly candle and shadow rendering for the new week. For coins that have already attempted to turn the month around, the probability of stable sales until the end of May already prevails from this week. From Tuesday to May 7-9 or 11-12, there will still be a flat period, when, with a general market pullback, individual coins may show growth, then the probability of a return of ether to 1500-1600 prevails, with a possible reversal and drawdown of the altcoin market. Today and tomorrow, I recommend reducing positions on coins, especially those that have shown good growth, in order to avoid drawdowns in the new month.
In the first half of the new week, growth impulses for coins that have not yet attempted to turn the current monthly candle into a bullish one are more likely. In particular, pumping is possible using vib wing and pda, which are awaiting delisting. For coins without the monitoring tag, it is better to make further purchases after the announcement of the tag assignment in the new week, because after the rollback from Sunday to Tuesday, coins can lose up to 50% additionally in the second half of the week if the tag is assigned. I will collect the list of coins for work in May after the announcement of the tag assignment.

My parabolic ride with BSWUSDT 👀The past is the mirror of the future ❤
It is not investment advice 🐋🐋🐋

🔥BSW is Future Binance Top Gainer: Are U Ready to it❓Biswap fell by -97% from it's highs. It take 2 years and lot's of investors tears. Now the time is come and no one wants to buy it.
BSW is a very low-cap altcoin ($40mln) for a such huge exchange (Binance).
The targets and resistances are $0.134, $0.25 and $0.6-0.65 order flow.
💥 Altcoin with a $40mln cap is a real "Gem" and I think it can't test the wedge and break it with 1 single candle. Usually, it happens even without the squeese to the trendline above.
like❤️ and follow
Check the links and get a BONUS🎁 from me👇

BSWUSDT(Biswap) Daily tf Range Updated till 26-12-23BSWUSDT(Biswap) Daily timeframe range. after a pump we can see a wickout which already trapped some positions. touched 0.1727 it needs to close above 0.1354 to find a valid way back if not than back to 0.1024 level.

Biswap BSW Coin Price Prediction🔥 Price on the 4H chart might come at these support area and we might get a potential bounce🔥
Potential bounce areas for Buying 0.1339 and 0.1125
👉 Follow me for More Real Time Opportunities.
Share your Thoughts if you have any?

$BSW near to Break down\ward trendline **$BSW near to Break down\ward trendline **
Trading trendline breakouts is a popular strategy in technical analysis. It involves identifying key trendlines on a price chart and then executing trades when the price breaks through these trendlines. Here's a step-by-step guide on how to trade trendline breakouts:
1. **Identify the Trendlines:**
- Start by identifying the prevailing trend in the price movement. This can be an uptrend (higher highs and higher lows) or a downtrend (lower highs and lower lows).
- Draw trendlines connecting the lows in an uptrend and the highs in a downtrend. These trendlines should slope in the direction of the prevailing trend.
2. **Confirmation of the Trendline:**
- Ensure that the trendline has been touched or respected by the price multiple times. The more times it has been tested, the stronger it is considered.
3. **Entry Point:**
- Plan your entry point for a breakout trade. For an uptrend, consider buying when the price breaks above the upper trendline. For a downtrend, consider selling when the price breaks below the lower trendline.
4. **Use Additional Indicators:**
- It's often beneficial to use other technical indicators to confirm the breakout. Common indicators include moving averages, Relative Strength Index (RSI), or Stochastic Oscillator. These can help filter out false breakouts.
5. **Set Stop-Loss and Take-Profit Orders:**
- Determine your stop-loss and take-profit levels. A stop-loss is placed below the breakout point for long trades and above the breakout point for short trades to limit potential losses. A take-profit level is set at a point where you aim to lock in profits.
6. **Risk Management:**
- Calculate the position size based on your risk tolerance. Do not risk more than a small percentage of your trading capital on a single trade.

BSW successful trading and investmentHello, friends of the cryptocurrency world! 🚀
Today, I want to share my thoughts with you about the current situation in the altcoin market. It seems that many projects are now very close to their bottom points, and this could be an opportune moment for making well-informed choices and investments.
It's important to understand that the cryptocurrency market is always unpredictable, and no one knows exactly when prices will hit rock bottom. However, it's precisely these moments that can create unique opportunities for successful trading and investment.
Today, I've paid special attention to the BSW token and noticed that its price is currently at its minimum. I've decided to consider this token for my trading and investment activities. Of course, this isn't advice or a recommendation for everyone; it's merely my personal choice based on analysis and my own strategy.
Regardless of the market situation, I recommend adhering to the fundamental principles of risk management and never investing funds you're not prepared to lose.
Wishing you successful trades and smart investments!

BSWUSDT 🚀🚀
#BSWUSDT as you can see at the chart in daily chart time-frame we are in over sold area MACD is showing bullish RSI showing bullish EMAs is neutral ZELMA is showing uptrend-move Fib retracement is showing bullish Accumulation distribution is bullish i expect the price will fly to the target at the chart buy and hold it to the next targets at the chart

BSW/USDT - Biswap: Trend_Reversal◳◱ Hey traders, A Trend Reversal has been identified on the $BSW / CRYPTOCAP:USDT chart. The trend of the price has reversed, indicating a potential trend change. The next resistance levels are located at 0.0892 | 0.0933 | 0.1008, while the main support levels can be found at 0.0817 | 0.0783 | 0.0708. Consider buying at the current price of 0.0881 and benefiting from the trend continuation.
◰◲ General info :
▣ Name: Biswap
▣ Rank: 443
▣ Exchanges: Binance, Kucoin, Bybit, Gateio, Mexc
▣ Category/Sector: N/A
▣ Overview: None
◰◲ Technical Metrics :
▣ Mrkt Price: 0.0881 ₮
▣ 24HVol: 557,474.218 ₮
▣ 24H Chng: 4.632%
▣ 7-Days Chng: 3.38%
▣ 1-Month Chng: -29.17%
▣ 3-Months Chng: -53.10%
◲◰ Pivot Points - Levels :
◥ Resistance: 0.0892 | 0.0933 | 0.1008
◢ Support: 0.0817 | 0.0783 | 0.0708
◱◳ Indicators recommendation :
▣ Oscillators: BUY
▣ Moving Averages: STRONG_BUY
◰◲ Technical Indicators Summary : STRONG_BUY
◲◰ Sharpe Ratios :
▣ Last 30D: -6.61
▣ Last 90D: -5.51
▣ Last 1-Y: -1.79
▣ Last 3-Y: -0.77
◲◰ Volatility :
▣ Last 30D: 0.72
▣ Last 90D: 0.58
▣ Last 1-Y: 0.65
▣ Last 3-Y: 1.47
◳◰ Market Sentiment Index :
▣ News sentiment score is N/A
▣ Twitter sentiment score is N/A
▣ Reddit sentiment score is N/A
▣ In-depth BSWUSDT technical analysis on Tradingview TA page
▣ What do you think of this analysis? Share your insights and let's discuss in the comments below. Your like, follow and support would be greatly appreciated!
◲ Disclaimer
Please note that the information and publications provided are for informational purposes only and should not be construed as financial, investment, trading, or any other type of advice or recommendation. We encourage you to conduct your own research and consult with a qualified professional before making any financial decisions. The use of the information provided is solely at your own risk.
▣ Welcome to the home of charting big: TradingView
Benefit from a ton of financial analysis features, instruments and data. Have a look around, and if you do choose to go with an upgraded plan, you'll get up to $30.
Discover it here - affiliate link -

BSW is a good project, take a lookGreetings, friends. The #BSW coin is looking to go long. Locally we have an uptrend. The coin is swinging in the range. Marked a good liquidity zone. Had a MM, would have dragged the price there, or even lower, and then let it go on targets.) In general, with the potential BSW. Targets marked, fix partial with a shift of stop in the boo. The risk is necessary to observe, they can well saw!


Biswap (BSW) formed bullish Gartley for upto 45.50% pumpHi dear friends, hope you are well and welcome to the new trade setup of Biswap (BSW) with US Dollar pair.
On a daily time frame, BSW has formed a bullish Gartley pattern.
Note: Above idea is for educational purpose only. It is advised to diversify and strictly follow the stop loss, and don't get stuck with trade

BSWUSDT: Elliott Waves Intraday TradingTrade plan for BSWUSDT from my basket of investment decisions.
On BSWUSDT, a correction has been formed in the assumed wave 4 and momentum has already started to form in wave 1 of wave 5 (in wave C of wave 4).
I have already opened a long position and plan to increase volume in case of further growth.
All in all, the current situation allows me to plan an excellent trade with a risk to profit ratio of 1:5.
In case of successful development of the situation and completion of wave 5 above $0.42 level I plan to look for the point to open a short position with the purpose to gain profit in case of price decrease to $0.22 level.
Best Regards,
CEO Tornado Capital

🆓Biswap (BSW) May-05 #BSW $BSW
BSW could still have bull runs this May. However, it needs to hold onto the $1 zone because if it loses this zone, it will plummet to the $0.7 or even $0.6 zone by mid-May.
📈RED PLAN
♻️Condition : If 1-Day closes ABOVE 1$ zone
🔴Buy : 1.1 - 1
🔴Sell : 1.3 - 1.5 - 1.8
📉BLUE PLAN
♻️Condition : If 1-Day closes BELOW 1$ zone
🔵Sell : 1
🔵Buy : 0.7 - 0.6
❓Details
📈Red Arrow : Main Direction as RED PLAN
📉Blue Arrow : Back-Up Direction as BLUE PLAN
🟩Green zone : Support zone as BUY section
🟥Red zone : Resistance zone as SELL section


Bullish on $BSWThis trade has hit a nice daily OB.
If it trade reverses and BTC does a flash crash. I am taking buys at 0.80 area

BSW end of correction, beginning of a trendThe coin has good liquidity and excellent work of Elliot waves, completed the abc correction with a run-out and according to the first wave 12345, we buy more at fibonacci retracement levels
Thanks to our investors for their trust <3

Analysis: BiSwap(BSW) Breaking Out; Keep an Eye BSW has been consolidating for a while, but now it has done a breakout of the triangle pattern and the 0.236 Fib in the chart, with strong increasing volume. The RSI also did an early breakout. For a successful breakout, we might need to wait for the 1.30$ resistance to be broken(colored in aqua). I'll update this analysis as time passes.

