#BSW/USDT is bullish engulfing and also took ?#BSW
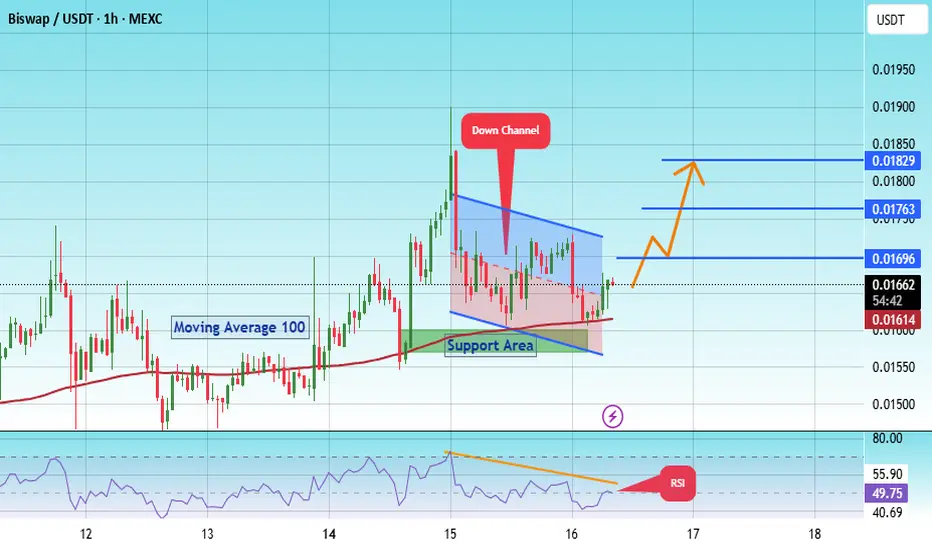
The price is moving within a descending channel on the 1-hour frame, adhering well to it, and is on its way to breaking it strongly upwards and retesting it.
We have a bounce from the lower boundary of the descending channel. This support is at 0.01580.
We have a downtrend on the RSI indicator that is about to break and retest, supporting the upward move.
There is a key support area in green at 0.01573, which represents a strong basis for the upward move.
Don't forget one simple thing: ease and capital.
When you reach the first target, save some money and then change your stop-loss order to an entry order.
For inquiries, please leave a comment.
We have a trend of stability above the Moving Average 100.
Entry price: 0.01650
First target: 0.01696
Second target: 0.01763
Third target: 0.01829
Don't forget one simple thing: ease and capital.
When you reach the first target, save some money and then change your stop-loss order to an entry order.
For inquiries, please leave a comment.
Thank you.
Bswlong
#BSW/USDT How Long Will It Take For A $0.01754 Target?#BSW
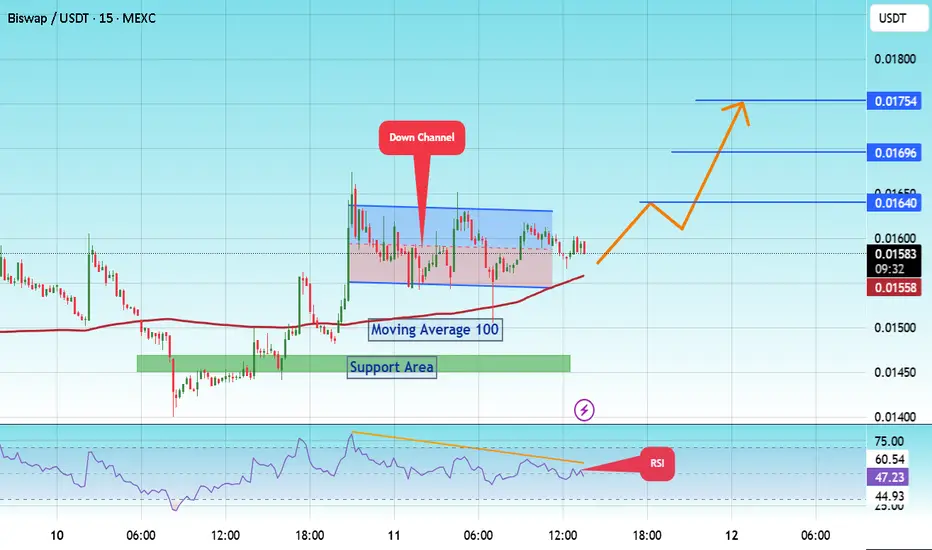
The price is moving within a descending channel on the 15-minute frame and is expected to break and continue upward.
We have a trend to stabilize above the 100 Moving Average once again.
We have a downtrend on the RSI indicator that supports the upward break.
We have a support area at the lower boundary of the channel at 0.01546, acting as strong support from which the price can rebound.
We have a major support area in green that pushed the price upward at 0.01450.
Entry price: 0.01595
First target: 0.01640
Second target: 0.1696
Third target: 0.01754
To manage risk, don't forget stop loss and capital management.
When you reach the first target, save some profits and then change the stop order to an entry order.
For inquiries, please comment.
Thank you.
#BSW/USDT is bullish engulfing and also took#BSW
The price is moving within a descending channel on the 1-hour frame and is expected to break and continue upward.
We have a trend to stabilize above the 100 moving average once again.
We have a downtrend on the RSI indicator that supports the upward break.
We have a support area at the lower boundary of the channel at 0.01060, acting as strong support from which the price can rebound.
We have a major support area in green that pushed the price upward at 0.01020.
Entry price: 0.01300
First target: 0.01545
Second target: 0.01817
Third target: 0.02083
To manage risk, don't forget stop loss and capital management.
When you reach the first target, save some profits and then change the stop order to an entry order.
For inquiries, please comment.
Thank you.

BSWUSDT Forming Falling WedgeBSWUSDT is currently showcasing a classic falling wedge pattern, a bullish reversal signal often associated with a sharp move to the upside once the pattern resolves. This technical structure forms when price action consolidates with lower highs and lower lows, while volume typically decreases — setting the stage for a breakout. In BSWUSDT’s case, the falling wedge has matured, and bullish interest is beginning to surface with improving volume levels, suggesting that accumulation is underway.
The technical breakout from this pattern could unlock strong upside potential, and current projections indicate a possible 90% to 100% gain in the coming sessions. This aligns well with historical performance of similar wedge formations in the crypto market, where the price often surges after breaking the upper resistance trendline. Traders are closely monitoring key resistance zones for confirmation and volume spikes that can validate the trend shift.
Investor sentiment toward the (BSW) ecosystem is growing steadily due to its utility in DeFi services and low trading fees. The increase in volume also indicates that smart money could be positioning ahead of a major move. Coupled with market-wide bullishness, BSWUSDT may soon experience a strong rally, driven by both technical and fundamental catalysts.
This setup offers a high-reward opportunity for swing traders and technical analysts who are focused on breakout trades and pattern-based strategies. The falling wedge combined with rising investor engagement makes BSWUSDT a potential breakout star to watch closely.
✅ Show your support by hitting the like button and
✅ Leaving a comment below! (What is You opinion about this Coin)
Your feedback and engagement keep me inspired to share more insightful market analysis with you!

BSWUSDT 🚀🚀
#BSWUSDT as you can see at the chart in daily chart time-frame we are in over sold area MACD is showing bullish RSI showing bullish EMAs is neutral ZELMA is showing uptrend-move Fib retracement is showing bullish Accumulation distribution is bullish i expect the price will fly to the target at the chart buy and hold it to the next targets at the chart

Biswap (BSW) formed bullish Gartley for upto 45.50% pumpHi dear friends, hope you are well and welcome to the new trade setup of Biswap (BSW) with US Dollar pair.
On a daily time frame, BSW has formed a bullish Gartley pattern.
Note: Above idea is for educational purpose only. It is advised to diversify and strictly follow the stop loss, and don't get stuck with trade

BSWUSDT: Elliott Waves Intraday TradingTrade plan for BSWUSDT from my basket of investment decisions.
On BSWUSDT, a correction has been formed in the assumed wave 4 and momentum has already started to form in wave 1 of wave 5 (in wave C of wave 4).
I have already opened a long position and plan to increase volume in case of further growth.
All in all, the current situation allows me to plan an excellent trade with a risk to profit ratio of 1:5.
In case of successful development of the situation and completion of wave 5 above $0.42 level I plan to look for the point to open a short position with the purpose to gain profit in case of price decrease to $0.22 level.
Best Regards,
CEO Tornado Capital


