#BSW/USDT is bullish engulfing and also took ?#BSW
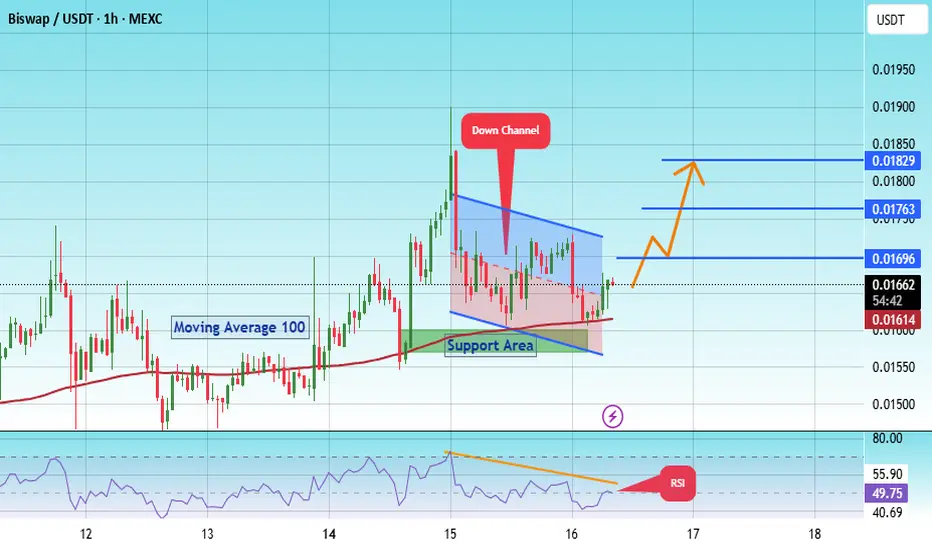
The price is moving within a descending channel on the 1-hour frame, adhering well to it, and is on its way to breaking it strongly upwards and retesting it.
We have a bounce from the lower boundary of the descending channel. This support is at 0.01580.
We have a downtrend on the RSI indicator that is about to break and retest, supporting the upward move.
There is a key support area in green at 0.01573, which represents a strong basis for the upward move.
Don't forget one simple thing: ease and capital.
When you reach the first target, save some money and then change your stop-loss order to an entry order.
For inquiries, please leave a comment.
We have a trend of stability above the Moving Average 100.
Entry price: 0.01650
First target: 0.01696
Second target: 0.01763
Third target: 0.01829
Don't forget one simple thing: ease and capital.
When you reach the first target, save some money and then change your stop-loss order to an entry order.
For inquiries, please leave a comment.
Thank you.
BSWUSDT
#BSW/USDT How Long Will It Take For A $0.01754 Target?#BSW
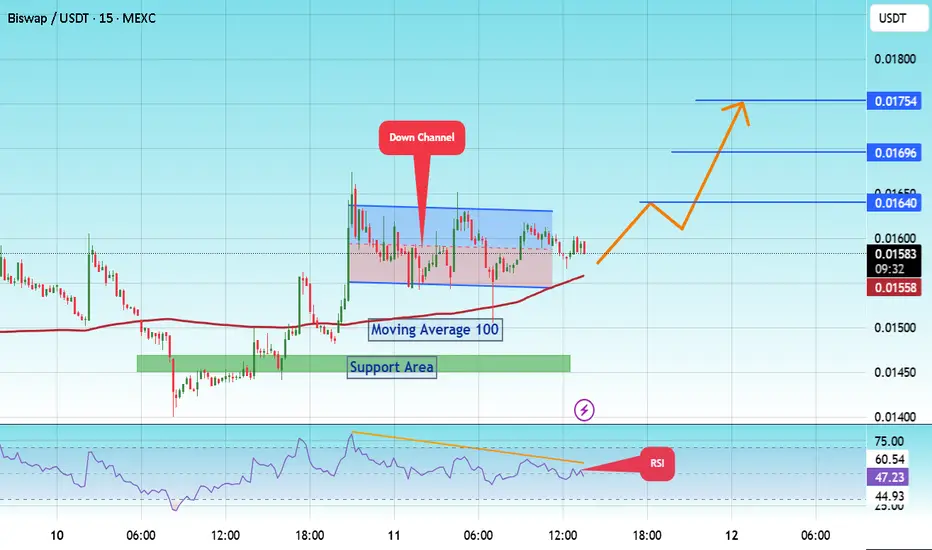
The price is moving within a descending channel on the 15-minute frame and is expected to break and continue upward.
We have a trend to stabilize above the 100 Moving Average once again.
We have a downtrend on the RSI indicator that supports the upward break.
We have a support area at the lower boundary of the channel at 0.01546, acting as strong support from which the price can rebound.
We have a major support area in green that pushed the price upward at 0.01450.
Entry price: 0.01595
First target: 0.01640
Second target: 0.1696
Third target: 0.01754
To manage risk, don't forget stop loss and capital management.
When you reach the first target, save some profits and then change the stop order to an entry order.
For inquiries, please comment.
Thank you.
#BSW/USDT is bullish engulfing and also took#BSW
The price is moving within a descending channel on the 1-hour frame and is expected to break and continue upward.
We have a trend to stabilize above the 100 moving average once again.
We have a downtrend on the RSI indicator that supports the upward break.
We have a support area at the lower boundary of the channel at 0.01060, acting as strong support from which the price can rebound.
We have a major support area in green that pushed the price upward at 0.01020.
Entry price: 0.01300
First target: 0.01545
Second target: 0.01817
Third target: 0.02083
To manage risk, don't forget stop loss and capital management.
When you reach the first target, save some profits and then change the stop order to an entry order.
For inquiries, please comment.
Thank you.

BSW Bull Trap:Binance Delisting + Weak Fundamentals = -50% AheadToday, I want to analyze the Biswap project ( BINANCE:BSWUSDT ) with the BSW token for you and examine the opportunity for a short position on the BSW token from a Fundamental and Technical perspective.
First, let's examine the conditions of the Biswap project from a Fundamental perspective.
Biswap is a decentralized exchange (DEX) built on the BNB Chain, offering features like token swaps, farming, staking, and an NFT marketplace. It became popular due to its very low trading fees (0.1%) and an aggressive referral & reward system.
However, the project is facing key fundamental issues:
Decline in trading volume and user activity
Drop in TVL rankings among DEX platforms
Inflationary tokenomics with constant reward emissions, increasing sell pressure
Most critically, Binance announced the delisting of BSW (effective July 4, 2025), shaking investor confidence severely .
In summary, while Biswap started strong, its fundamentals have weakened significantly, especially after the Binance delisting, which casts doubt over its future viability.
---------------------------------------------------
In terms of Technical Analysis , the BSW token managed to reach the Heavy Resistance zone($0.060-$0.0315) and Potential Reversal Zone(PRZ) with the previous hours' pump( more than +100% ), but then started to decline again.
In terms of Elliott wave theory , I consider the recent hours pump as a wave C of the Zigzag Correction(ABC/5-3-5) .
I expect that given the delisting(soon) of the BSW token and the technical analysis of the BSW token, it will fall by at least -50% . In fact, this pump could act as a Bull Trap .
Note: Stop Loss(SL)= $0.0422 = We can expect more pumps.
Please respect each other's ideas and express them politely if you agree or disagree.
Biswap Analyze (BSWUSDT), 1-hour time frame.
Be sure to follow the updated ideas.
Do not forget to put a Stop loss for your positions (For every position you want to open).
Please follow your strategy and updates; this is just my Idea, and I will gladly see your ideas in this post.
Please do not forget the ✅' like '✅ button 🙏😊 & Share it with your friends; thanks, and Trade safe.

BSWUSDT Forming Falling WedgeBSWUSDT is currently showcasing a classic falling wedge pattern, a bullish reversal signal often associated with a sharp move to the upside once the pattern resolves. This technical structure forms when price action consolidates with lower highs and lower lows, while volume typically decreases — setting the stage for a breakout. In BSWUSDT’s case, the falling wedge has matured, and bullish interest is beginning to surface with improving volume levels, suggesting that accumulation is underway.
The technical breakout from this pattern could unlock strong upside potential, and current projections indicate a possible 90% to 100% gain in the coming sessions. This aligns well with historical performance of similar wedge formations in the crypto market, where the price often surges after breaking the upper resistance trendline. Traders are closely monitoring key resistance zones for confirmation and volume spikes that can validate the trend shift.
Investor sentiment toward the (BSW) ecosystem is growing steadily due to its utility in DeFi services and low trading fees. The increase in volume also indicates that smart money could be positioning ahead of a major move. Coupled with market-wide bullishness, BSWUSDT may soon experience a strong rally, driven by both technical and fundamental catalysts.
This setup offers a high-reward opportunity for swing traders and technical analysts who are focused on breakout trades and pattern-based strategies. The falling wedge combined with rising investor engagement makes BSWUSDT a potential breakout star to watch closely.
✅ Show your support by hitting the like button and
✅ Leaving a comment below! (What is You opinion about this Coin)
Your feedback and engagement keep me inspired to share more insightful market analysis with you!

BSW/USDT: Looking Promising for a Breakout! BSW/USDT: Looking Promising for a Breakout!
BSW/USDT is showing signs that it may be gearing up for a strong upward move. This setup is catching attention as traders anticipate a potential rally in the coming days. Here’s a detailed breakdown to help you navigate this breakout trading opportunity:
Breakout trading tips 💡
1. Confirm the breakout: A true breakout occurs when the price pushes above the resistance level with strong momentum. Look for a decisive candle close above this level, supported by increasing volume. This shows that buyers are in control and reduces the chances of a “fake-out.” Avoid entering too early without confirmation 📊
2. Watch for retests: Breakouts often come with a pullback where the price retests the old resistance level as support. This is a key moment to watch, as successful retests usually confirm the breakout’s strength. Retests can also offer better entry points with reduced risk 🔄
3. Set smart stop-losses: Managing risk is crucial. For breakout trades, a stop-loss placed just below the breakout or retest level can limit potential losses if the breakout fails. This ensures you protect your capital while staying in the game 🛡️
4. Track market sentiment: The overall market trend can influence BSW’s performance. Monitor Bitcoin and other major cryptocurrencies, as their movement can impact smaller assets like BSW. A bullish trend in the broader market can amplify breakout momentum 🌐
5. Set realistic targets: Identify potential resistance levels above the breakout point. These can act as targets for taking profits. Consider taking partial profits at these levels while leaving some position open if the uptrend continues 📈
Trade carefully and use these tips to make the most of BSW/USDT’s promising move. Always remember, this isn’t financial advice—DYOR before making any decisions! 🔥

My parabolic ride with BSWUSDT 👀The past is the mirror of the future ❤
It is not investment advice 🐋🐋🐋

🔥BSW is Future Binance Top Gainer: Are U Ready to it❓Biswap fell by -97% from it's highs. It take 2 years and lot's of investors tears. Now the time is come and no one wants to buy it.
BSW is a very low-cap altcoin ($40mln) for a such huge exchange (Binance).
The targets and resistances are $0.134, $0.25 and $0.6-0.65 order flow.
💥 Altcoin with a $40mln cap is a real "Gem" and I think it can't test the wedge and break it with 1 single candle. Usually, it happens even without the squeese to the trendline above.
like❤️ and follow
Check the links and get a BONUS🎁 from me👇

BSWUSDT(Biswap) Daily tf Range Updated till 26-12-23BSWUSDT(Biswap) Daily timeframe range. after a pump we can see a wickout which already trapped some positions. touched 0.1727 it needs to close above 0.1354 to find a valid way back if not than back to 0.1024 level.

Get Ready for BSW Pump! (:Hi everyone, I hope you are doing well and I have put my opinion in BSWUSDT price on the chart for you.
big Divergence on (W) TF and bullish Trendline still not broken.
and hope this helps you! Simple, concise, useful
Best Regards-

Biswap BSW Coin Price Prediction🔥 Price on the 4H chart might come at these support area and we might get a potential bounce🔥
Potential bounce areas for Buying 0.1339 and 0.1125
👉 Follow me for More Real Time Opportunities.
Share your Thoughts if you have any?

$BSW near to Break down\ward trendline **$BSW near to Break down\ward trendline **
Trading trendline breakouts is a popular strategy in technical analysis. It involves identifying key trendlines on a price chart and then executing trades when the price breaks through these trendlines. Here's a step-by-step guide on how to trade trendline breakouts:
1. **Identify the Trendlines:**
- Start by identifying the prevailing trend in the price movement. This can be an uptrend (higher highs and higher lows) or a downtrend (lower highs and lower lows).
- Draw trendlines connecting the lows in an uptrend and the highs in a downtrend. These trendlines should slope in the direction of the prevailing trend.
2. **Confirmation of the Trendline:**
- Ensure that the trendline has been touched or respected by the price multiple times. The more times it has been tested, the stronger it is considered.
3. **Entry Point:**
- Plan your entry point for a breakout trade. For an uptrend, consider buying when the price breaks above the upper trendline. For a downtrend, consider selling when the price breaks below the lower trendline.
4. **Use Additional Indicators:**
- It's often beneficial to use other technical indicators to confirm the breakout. Common indicators include moving averages, Relative Strength Index (RSI), or Stochastic Oscillator. These can help filter out false breakouts.
5. **Set Stop-Loss and Take-Profit Orders:**
- Determine your stop-loss and take-profit levels. A stop-loss is placed below the breakout point for long trades and above the breakout point for short trades to limit potential losses. A take-profit level is set at a point where you aim to lock in profits.
6. **Risk Management:**
- Calculate the position size based on your risk tolerance. Do not risk more than a small percentage of your trading capital on a single trade.

BSW successful trading and investmentHello, friends of the cryptocurrency world! 🚀
Today, I want to share my thoughts with you about the current situation in the altcoin market. It seems that many projects are now very close to their bottom points, and this could be an opportune moment for making well-informed choices and investments.
It's important to understand that the cryptocurrency market is always unpredictable, and no one knows exactly when prices will hit rock bottom. However, it's precisely these moments that can create unique opportunities for successful trading and investment.
Today, I've paid special attention to the BSW token and noticed that its price is currently at its minimum. I've decided to consider this token for my trading and investment activities. Of course, this isn't advice or a recommendation for everyone; it's merely my personal choice based on analysis and my own strategy.
Regardless of the market situation, I recommend adhering to the fundamental principles of risk management and never investing funds you're not prepared to lose.
Wishing you successful trades and smart investments!

BSWUSDT 🚀🚀
#BSWUSDT as you can see at the chart in daily chart time-frame we are in over sold area MACD is showing bullish RSI showing bullish EMAs is neutral ZELMA is showing uptrend-move Fib retracement is showing bullish Accumulation distribution is bullish i expect the price will fly to the target at the chart buy and hold it to the next targets at the chart

BSW/USDT - Biswap: Trend_Reversal◳◱ Hey traders, A Trend Reversal has been identified on the $BSW / CRYPTOCAP:USDT chart. The trend of the price has reversed, indicating a potential trend change. The next resistance levels are located at 0.0892 | 0.0933 | 0.1008, while the main support levels can be found at 0.0817 | 0.0783 | 0.0708. Consider buying at the current price of 0.0881 and benefiting from the trend continuation.
◰◲ General info :
▣ Name: Biswap
▣ Rank: 443
▣ Exchanges: Binance, Kucoin, Bybit, Gateio, Mexc
▣ Category/Sector: N/A
▣ Overview: None
◰◲ Technical Metrics :
▣ Mrkt Price: 0.0881 ₮
▣ 24HVol: 557,474.218 ₮
▣ 24H Chng: 4.632%
▣ 7-Days Chng: 3.38%
▣ 1-Month Chng: -29.17%
▣ 3-Months Chng: -53.10%
◲◰ Pivot Points - Levels :
◥ Resistance: 0.0892 | 0.0933 | 0.1008
◢ Support: 0.0817 | 0.0783 | 0.0708
◱◳ Indicators recommendation :
▣ Oscillators: BUY
▣ Moving Averages: STRONG_BUY
◰◲ Technical Indicators Summary : STRONG_BUY
◲◰ Sharpe Ratios :
▣ Last 30D: -6.61
▣ Last 90D: -5.51
▣ Last 1-Y: -1.79
▣ Last 3-Y: -0.77
◲◰ Volatility :
▣ Last 30D: 0.72
▣ Last 90D: 0.58
▣ Last 1-Y: 0.65
▣ Last 3-Y: 1.47
◳◰ Market Sentiment Index :
▣ News sentiment score is N/A
▣ Twitter sentiment score is N/A
▣ Reddit sentiment score is N/A
▣ In-depth BSWUSDT technical analysis on Tradingview TA page
▣ What do you think of this analysis? Share your insights and let's discuss in the comments below. Your like, follow and support would be greatly appreciated!
◲ Disclaimer
Please note that the information and publications provided are for informational purposes only and should not be construed as financial, investment, trading, or any other type of advice or recommendation. We encourage you to conduct your own research and consult with a qualified professional before making any financial decisions. The use of the information provided is solely at your own risk.
▣ Welcome to the home of charting big: TradingView
Benefit from a ton of financial analysis features, instruments and data. Have a look around, and if you do choose to go with an upgraded plan, you'll get up to $30.
Discover it here - affiliate link -

BSW is a good project, take a lookGreetings, friends. The #BSW coin is looking to go long. Locally we have an uptrend. The coin is swinging in the range. Marked a good liquidity zone. Had a MM, would have dragged the price there, or even lower, and then let it go on targets.) In general, with the potential BSW. Targets marked, fix partial with a shift of stop in the boo. The risk is necessary to observe, they can well saw!


Biswap (BSW) formed bullish Gartley for upto 45.50% pumpHi dear friends, hope you are well and welcome to the new trade setup of Biswap (BSW) with US Dollar pair.
On a daily time frame, BSW has formed a bullish Gartley pattern.
Note: Above idea is for educational purpose only. It is advised to diversify and strictly follow the stop loss, and don't get stuck with trade

BSWUSDT: Elliott Waves Intraday TradingTrade plan for BSWUSDT from my basket of investment decisions.
On BSWUSDT, a correction has been formed in the assumed wave 4 and momentum has already started to form in wave 1 of wave 5 (in wave C of wave 4).
I have already opened a long position and plan to increase volume in case of further growth.
All in all, the current situation allows me to plan an excellent trade with a risk to profit ratio of 1:5.
In case of successful development of the situation and completion of wave 5 above $0.42 level I plan to look for the point to open a short position with the purpose to gain profit in case of price decrease to $0.22 level.
Best Regards,
CEO Tornado Capital


Bullish on $BSWThis trade has hit a nice daily OB.
If it trade reverses and BTC does a flash crash. I am taking buys at 0.80 area

BSWUSDT trade analysisBSWUSDT according to technical analysis, trade is in the accumulation range. As it is crossing the yellow area then we will see strong bullish position. We publish precise and compact information after careful consideration which give you quick glimpse for comparative analysis. Our aim is to deliver simple and compact information which can be used by beginner to give them brief understanding of trades without any complexity. if you have any question or want to ask about analysis of other pairs or you have any confusion about analysis then feel free to ask us. Don't forget to support by share your ideas and hit like and subscribe button. You can support us through coins donation for more frequent signals.
