HelenP. I Bitcoin can correct to trend line and start move upHi folks today I'm prepared for you Bitcoin analytics. In this chart, we can observe how the price developed a gradual upward trend, respecting the trend line as dynamic support multiple times. After each interaction with this line, the price showed a consistent pattern of rebounding and continuing its upward movement. Recently, the price faced a notable correction, which pushed it back toward this trend line once again, a critical zone that has proven its relevance as a support area. Upon touching the line, the market reacted with a bounce, signaling that buyers are still active and defending the structure. The price began to climb again, regaining some momentum, though it hasn’t yet managed to break the previous highs. Now BTCUSD is hovering near the ascending trend line, preparing for what could be another retest. If the trend holds, we may see a short-term decline toward this line, followed by a bullish rebound. I expect the price to push higher from this level, targeting the resistance zone near 108300, which also acted as a rejection area in the past. If you like my analytics you may support me with your like/comment ❤️
Disclaimer: As part of ThinkMarkets’ Influencer Program, I am sponsored to share and publish their charts in my analysis.
Btc!

Bitcoin may rebound from support line of wedge and start to growHello traders, I want share with you my opinion about Bitcoin. Initially, the price was trading inside a well-defined range, moving sideways with repeated rejections from both support and resistance. After several attempts to stay above the support zone, BTC finally broke down and sharply declined below the 104000 level, entering the buyer zone. However, the decline was short-lived. Price quickly rebounded from the lower boundary and formed a strong bullish candle, suggesting that buyers were still active. After this recovery, BTC began forming a wedge pattern, with a gradually narrowing structure between the resistance line and the ascending support line. This kind of price action typically signals a buildup of pressure and potential breakout. Currently, BTC is once again testing the support line of the wedge and hovering near the buyer zone, where it previously reversed. This level has proven significant and is now being retested. Given the current structure, the wedge formation, and price behavior near the support, I expect BTC to rebound from this zone and start climbing back toward the upper resistance area. My current TP 1 is set at 106800 points, which aligns with the mid-level of the previous impulse zone and the inner resistance of the wedge. Please share this idea with your friends and click Boost 🚀
Disclaimer: As part of ThinkMarkets’ Influencer Program, I am sponsored to share and publish their charts in my analysis.

Bitcoin Strategic Interval – Latency & Asymmetric Bias.⊢
⟁ BTC/USD – Binance – (CHART: 1D) – (June 20, 2025).
⟐ Analysis Price: $106,025.88.
⊢
⨀ I. Temporal Axis – Strategic Interval – (1D):
▦ EMA21 – ($105,772.44):
∴ The price remains fractionally above EMA21, retaking the short-term reactive axis;
∴ Despite prior rejection, current candle shows renewed traction with a solid close above;
∴ The slope is flat–rising, signaling the potential reactivation of local trend continuation.
✴️ Conclusion: EMA21 is tentatively reclaimed – a short-term bullish signal under close scrutiny.
⊢
▦ SMA200 – ($95,921.92):
∴ Long-term structure preserved: price maintains a wide buffer over SMA200;
∴ The moving average exhibits a healthy upward slope, uninterrupted since Q4 2023;
∴ No technical threat detected to the macro-trend structure.
✴️ Conclusion: SMA200 acts as the primary institutional defense line. No stress present.
⊢
▦ Ichimoku Cloud – (105,899 | 105,738 | 102,433 | 105,576 | 106,025):
∴ Price is nestled precisely within the flat upper cloud band – a known zone of consolidation;
∴ Span A and B are beginning to flatten, suggesting temporary exhaustion of momentum;
∴ Chikou remains above price – confirming trend integrity.
✴️ Conclusion: Ichimoku signals a pause, not a break – directional clarity pending.
⊢
▦ MACD (12,26,9) – (Histogram: -364.87 | MACD: 257.20 | Signal: 622.06):
∴ Bearish histogram remains negative, but shrinking for three sessions;
∴ MACD line curling upward with initial convergence to Signal line;
∴ Reversal signal forming but not yet triggered.
✴️ Conclusion: Early signs of MACD cross; confirmation requires follow-through.
⊢
▦ RSI – (53.17 | Avg: 51.74):
∴ RSI reclaims neutral-positive zone, stabilizing above 50;
∴ Structure shows divergence fading, with momentum recovering slowly;
∴ Still far from exhaustion thresholds.
✴️ Conclusion: RSI favors the bulls with cautious optimism.
⊢
▦ Volume (Last 5 Days):
∴ Volume remains muted, averaging 110–120k Bitcoin/day;
∴ No aggressive buy or sell pressure confirmed;
∴ Current move lacks conviction – suggests passive spot activity.
✴️ Conclusion: Price is advancing without volume confirmation – fragility persists.
⊢
🜎 Strategic Insight – Technical Oracle:
∴ Structural trend remains intact and undisturbed on the macro scale;
∴ Short-term bullish reclaim of EMA21 within the cloud, but momentum and volume still lag;
∴ Absence of conviction demands validation from price action or macro catalyst.
⊢
∫ II. On-Chain Intelligence – (Source: CryptoQuant):
▦ 🝰 Exchange Inflow Mean - (MA7):
∴ Metric sits near historic lows (≈0.4 BTC), denoting multi-week suppression of inflows;
∴ Correlates directly with reduced sell-side pressure from whales and institutions;
∴ Price structure remains unchallenged by inflow spikes – consistent with strategic holding.
✴️ Conclusion: Absence of fear or distribution among large holders – bullish backdrop intact.
⊢
▦ 🜍 Estimated Leverage Ratio – (Current: 0.259):
∴ Leverage steadily increasing, now entering historical danger zone;
∴ Elevated risk of cascade liquidations on any sharp downside move;
∴ Suggests the current rally is not organically fueled by spot demand.
✴️ Conclusion: Price structure is leveraged, not grounded – risk of synthetic instability.
⊢
▦ 🝗 Exchange Reserves - (Binance) – (≈544.5K BTC):
∴ Continuous net outflows – multi-month drain confirmed;
∴ Reflects silent accumulation or self-custody migration;
∴ No exchange-driven supply pressure visible.
✴️ Conclusion: Structural supply depleting – passive bullish signal.
⊢
▦ ⚒ Miners’ Position Index - (MPI) – (-1.1):
∴ Readings below 0 indicate minimal miner distribution;
∴ Suggests miners are confident, or at least not forced to sell at current levels;
∴ Historically coincides with market support zones.
✴️ Conclusion: Miner behavior aligned with trend preservation – not resistance.
⊢
▦ 🜚 Funding Rate - (All Exchanges) – (+0.003):
∴ Rates mildly positive, indicating slight dominance of long positioning;
∴ No excessive funding imbalance – healthy sentiment baseline;
∴ Reflects controlled bullish bias with no speculative overheating.
✴️ Conclusion: Longs exist, but not in a way that endangers trend integrity.
⊢
🜎 Strategic Insight – On-Chain Oracle:
∴ On-chain metrics echo the technical chart: structurally sound, short-term vulnerable;
∴ Long-term holders remain disengaged from distribution behavior;
∴ The system is healthy, but carries hidden leverage that may trigger volatility.
⊢
⧉ III. Contextvs Macro–Geopoliticvs – Interflux Economicus:
▦ 🇺🇸 United States – Federal Axis & Risk Channels:
∴ Treasury Yield Curve remains slightly positive (+0.44%), removing short-term recession signal;
∴ 10Y yield elevated at 4.42% – reflects sustained inflation resistance and risk demand;
∴ Fed has signaled no rate cuts before September – QT policy remains;
∴ Speculative expectations for only 1–2 cuts in 2025;
∴ Trump administration signals potential military action in Iran, igniting geopolitical risk premium.
✴️ Conclusion: U.S. monetary regime is steady–tight; geopolitical volatility injects asymmetric risk into crypto valuations.
⊢
▦ 🇨🇳 China – Internal Stimulus & Soft Deflation:
∴ Industrial Production slows to +5.8% YoY – weakest in 6 months;
∴ Retail sales climb to +6.4% YoY due to stimulus programs ("618 event", consumption vouchers);
∴ PPI remains deflationary (-3.3% YoY), compressing industrial margins;
∴ Fiscal revenue down -0.3% YTD – signals internal fragility despite easing efforts.
✴️ Conclusion: China is applying targeted stimulus, but lacks decisive global impact – neutral crypto flow effect.
⊢
▦ 🇪🇺 European Union – Disinflation & Rate Reversal:
∴ HICP inflation falls to 1.9% – below ECB’s 2.0% target;
∴ ECB cuts deposit rate by 25bps – now 2.00%;
∴ PMI Composite remains below 50 – economic contraction underway;
∴ ECB forward guidance signals data-dependence and hesitation for further cuts.
✴️ Conclusion: Europe is easing rates amidst stagnation – weak driver for global risk flows.
⊢
🜎 Strategic Insight – Interflux Macro Oracle:
∴ U.S. tight policy + Iran tension = dual pressure point on risk assets;
∴ China’s mild stimulus is not yet globally inflationary – no volatility trigger;
∴ EU drifts silently – supportive, but irrelevant to Bitcoin in current configuration;
∴ Global system is stable in appearance, but tactically charged beneath – setup aligns with Bitcoin volatility potential.
⊢
IV. ♝ Market Sentiment - Media & Institutional Lens:
▦ The Block – Corporate Stockpiling Thesis:
∴ Ongoing accumulation of Bitcoin by public and private entities continues across Q2;
∴ Institutional wallets showing strategic DCA behavior – interpreted as positioning for either macro easing or geopolitical hedge;
∴ Unlike past cycles, no major corporate selloffs have been detected.
✴️ Conclusion: Institutional base remains in passive accumulation – potential catalyst insulation.
⊢
▦ CoinDesk – Sentiment Report – BTC at $92K Risk Threshold:
∴ Despite price climbing above $106K, analysts caution of technical rejection scenarios;
∴ Zones near $92K identified as high-liquidity, high-reaction clusters;
∴ Chart analysis frames current movement as vulnerable if macro catalysts turn hawkish.
✴️ Conclusion: Sentiment remains cautiously bullish but alert to correction windows.
⊢
▦ InfoMoney – U.S. Military Risk – Iran Strike Potential:
∴ Reported internal briefing of U.S. military planning toward Iranian targets;
∴ Trump’s media team leveraging geopolitical strength posture to influence sentiment;
∴ Markets (Dow Futures) showing pre-market decline on the headline.
✴️ Conclusion: Bitcoin holds narrative premium under geopolitical fear – but risk surge remains volatile.
⊢
🜎 Strategic Insight – Media Oracle:
∴ The crypto narrative is suspended between structural trust (institutional accumulation) and external fear (macro-political instability);
∴ Bitcoin presently benefits from asymmetric narrative positioning — but lacks transactional confirmation;
∴ Media flows suggest that sentiment will pivot swiftly if Powell’s tone confirms further hawkish stance or if Iran tension escalates.
⊢
⊢
⚜️ Magister Arcanvm (𝟙⟠) – Vox Primordialis!
⚖️ Wisdom begins in silence. Precision unfolds in strategy.
⊢
⌘ Codicillus Silentii – Strategic Note:
∴ The 1D reclaim of EMA21 inside the Ichimoku flat cloud reflects a market in suspended potential, where trend continuation and failure share equal weight;
∴ On-chain dynamics remain structurally undisturbed, yet veiled in a fragile layer of leveraged positioning;
∴ Exchange reserves continue their descent, detaching the market from traditional sell-side threat, but increasing reliance on thin liquidity zones;
∴ Macro vectors (Fed policy + Middle East tension) hover as dual shadows, capable of igniting volatility without prelude;
∴ Institutional accumulation remains active, but no longer decisive - the market awaits external ignition, not internal strength;
∴ Sentiment is asymmetrically bullish, yet explicitly unconfirmed in transactional volume and price aggression;
∴ The system is quiet - not because it is resolved, but because it is observing itself. This is a moment of ritual latency.
⊢
⌘ Market Status – Tactical Mode:
✴️ Strategic Position: “Structurally Bullish – Tactically Suspended”;
✴️ Primary Mode: “Observation Priority”;
✴️ Tactical Stance:
∴ No active positioning expansion without confirmation beyond Ichimoku flat zone;
∴ Watch for MACD confirmation and volume acceleration;
∴ Monitor geopolitical escalation and Powell’s tone – both capable of shifting structural balance.
✴️ Directional Bias: Neutral–Bullish, contingent upon validation;
✴️ Key Zone of Collapse Risk: $92,000;
✴️ Ascent Gate: $110,800 + (confirmation threshold).
⊢

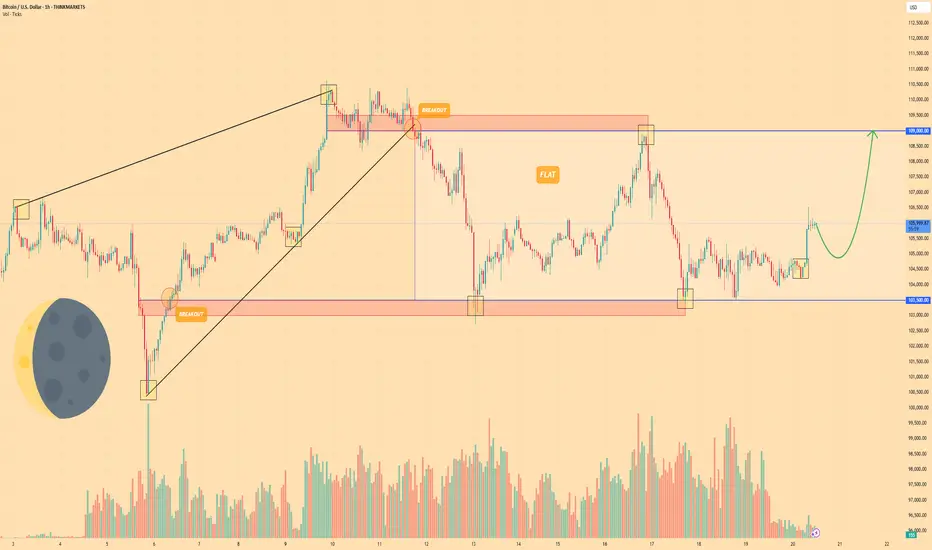
BITCOIN - Price can continue grow inside flat to $109000 levelHi guys, this is my overview for BTCUSD, feel free to check it and write your feedback in comments👊
A few days ago, the price entered a wedge, declining below the $103500 level and then making a strong impulse up.
Next, price broke $103500 level one more time and rose to resistance line of wedge, after which started to decline.
BTC broke $109000 level and started to trades inside a flat, where it declined to support level and then bounced up.
Price rose to resistance level, which is top part of flat, and then at once dropped back and started trading close.
But some time later, price bounced from this level and started to grow, and even now it continues to grow.
So, I think that BTC can make a small correction movement and then continue to grow to $109000 level.
If this post is useful to you, you can support me with like/boost and advice in comments❤️
Disclaimer: As part of ThinkMarkets’ Influencer Program, I am sponsored to share and publish their charts in my analysis.
BTC - Key Battle Between Bulls and Bears – Symmetrical TriangleBitcoin ( BINANCE:BTCUSDT ) is currently consolidating within a Symmetrical Triangle , showing indecision among Bulls and Bears around the Support zone($104,380-$103,060) and just above the 50_SMA (Daily) .
From an Elliott Wave perspective, the current range may represent a WXY corrective structure . The market seems to be waiting for a breakout direction , potentially aiming to complete wave 5 after this correction.
The Monthly Pivot Point($103,300) and the presence of significant Cumulative Liquidation Leverage Zones (both Long and Short ) are key liquidity magnets to watch in the short term .
I expect Bitcoin to re-attack the Support zone($104,380-$103,060) AFTER breaking the lower line of the Symmetrical Triangle Pattern and decline to the targets I have outlined on the chart.
Note: Stop Loss: $106,703 = Worst Stop Loss(SL)
Please respect each other's ideas and express them politely if you agree or disagree.
Bitcoin Analyze (BTCUSDT), 1-hour time frame.
Be sure to follow the updated ideas.
Do not forget to put a Stop loss for your positions (For every position you want to open).
Please follow your strategy and updates; this is just my Idea, and I will gladly see your ideas in this post.
Please do not forget the ✅' like '✅ button 🙏😊 & Share it with your friends; thanks, and Trade safe.

Bitcoin– bearish momentum builds after rejection at $109KIntroduction
Bitcoin (BTC) is currently showing weakness after forming a lower high at $109,000. This level acted as a significant point of rejection, and since then, BTC has been moving lower. The price has broken through key support areas, indicating a possible shift in market structure. In this analysis, we’ll break down the recent price action, explain the technical signals behind the move, and discuss what could be expected in the short term.
Rejection from the 0.786 Fibonacci Level
The rejection at the $109,000 level aligns perfectly with the 0.786 Fibonacci retracement on the 4-hour timeframe. This level is often seen as a strong resistance point during corrective moves, and in this case, it held firmly. The precision of this rejection gives it more weight, and since hitting that point, BTC has been steadily declining. This move down suggests that buyers were unable to push through the resistance, leading to increased selling pressure.
Break of the 4H Bullish FVG
As BTC started its decline from $109,000, it broke through the bullish Fair Value Gap (FVG) that had formed earlier on the 4-hour chart. This gap previously served as a support zone but has now been decisively broken with strong volume. The loss of this level is significant, as it marks a breakdown of the bullish structure and opens the door for further downside movement. In the process of this move lower, BTC has created a new bearish FVG on the 4-hour timeframe. This gap remains open and could potentially act as a magnet for price to revisit, offering a possible short entry if price retraces into that zone. However, the clear break below the previous bullish FVG indicates a shift in momentum and supports a more bearish bias for now.
Downside Target at $102.7K
Given the recent breakdown, the next key level to watch is around $102,700. This area marks the wick low on the 4-hour timeframe and stands out due to the size and sharpness of the wick. Such large wicks often leave behind unfilled orders, which markets tend to revisit over time. The presence of these resting orders makes this level a likely target for the ongoing move down. It also acts as a strong area of potential support, where buyers might step back in if the price reaches that point.
Conclusion
With the rejection from the 0.786 Fibonacci level and the failure to hold the bullish 4H FVG, BTC has shown clear signs of weakness. The breakdown in structure suggests a continuation to the downside is likely, with $102.7k being the most immediate target. This level could serve as a strong support zone due to the unfilled orders left behind by the previous wick. Until BTC reclaims key support levels or shows a shift in momentum, the bias remains bearish in the short term, and traders should remain cautious while expecting further downside.
Thanks for your support.
- Make sure to follow me so you don't miss out on the next analysis!
- Drop a like and leave a comment!

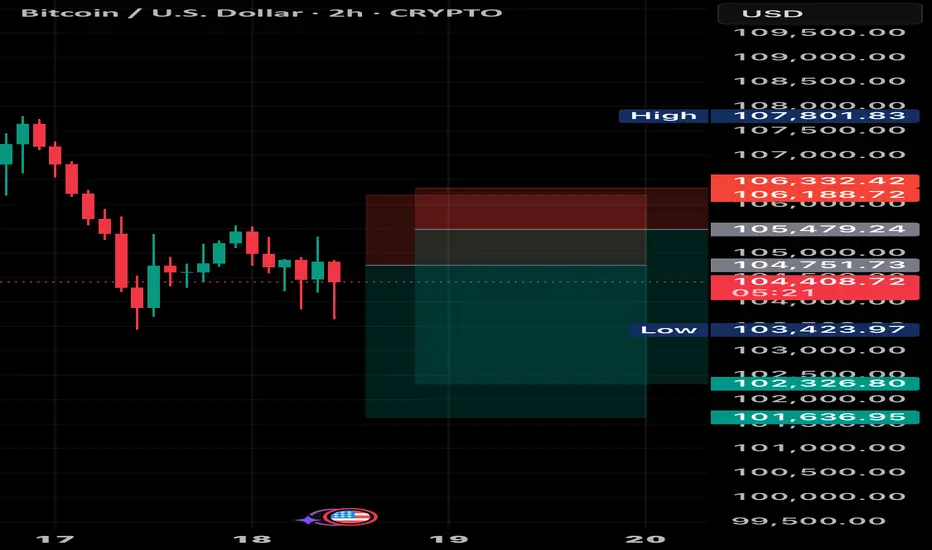
BTC SHORT TP:102,200 18-06-2025Let’s keep it simple: this pump looks fake.
I’m entering SHORT between 104,550 and 105,500, aiming for a target between 101,300 and 102,300. Average RR: 3.4 — solid and clean.
⏱️ Timeframe: 2H
⏳ Estimated duration: 12 to 24 hours
⚠️ Context: Bearish continuation — let’s ride the wave, not the noise.
Use your stop-loss based on your risk strategy. If price doesn’t move within the expected time, the setup is invalid.
We don’t use indicators, we’re not out here drawing lines or cute little shapes — I just give you a clean trade.
BITCOIN This is the long-term picture. Don't get distracted.Bitcoin (BTCUSD) has been consolidating lately after making a new All Time High (ATH) last month and this is already making part of the market nervous over whether that's the Cycle Top or not.
This is one of those times when it would be best to ignore the short-term noise/ volatility and stick to the long-term picture. And that's exactly what's shown on this chart, with BTC on the 1M time-frame showing the incredible symmetry among its 4-year Cycles, with Bear Markets lasting 12 - 13 months and Bull Markets 35.
Based on that, this Cycle's Top is expected to be priced by October (2025). This also matches the Sine Waves as implied by the 1M RSI, which as been trading within a Channel Down (diminishing returns) since Bitcoin's inception.
So do you also think that we have around 4 months before the market tops? Feel free to let us know in the comments section below!
-------------------------------------------------------------------------------
** Please LIKE 👍, FOLLOW ✅, SHARE 🙌 and COMMENT ✍ if you enjoy this idea! Also share your ideas and charts in the comments section below! This is best way to keep it relevant, support us, keep the content here free and allow the idea to reach as many people as possible. **
-------------------------------------------------------------------------------
💸💸💸💸💸💸
👇 👇 👇 👇 👇 👇

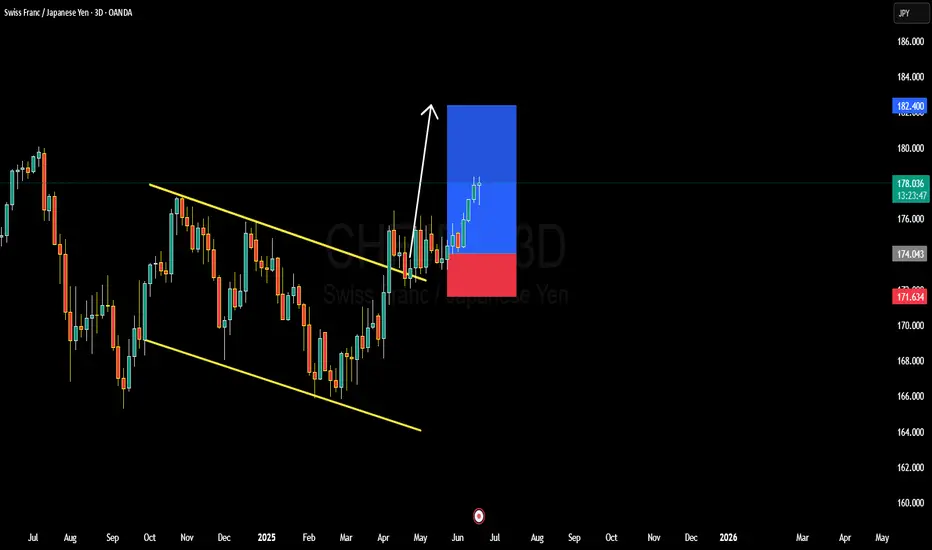
CHFJPY BULLISH OR BEARISH DETAILED ANALYSISCHFJPY has continued to play out exactly as forecasted, breaking out cleanly from the descending channel on the 3D timeframe and rallying strongly above key structure. Price is currently trading around 178.00, already delivering solid upside from the breakout zone. The bullish breakout was confirmed by consecutive impulsive candles with minimal retracement, a clear sign of institutional strength behind this move. As long as this momentum holds, the next major target is 182.00 – a psychological level and previous structure high, now acting as a magnetic zone for price.
On the fundamental side, the Swiss Franc continues to enjoy safe-haven flows as global macro uncertainty persists. The Swiss National Bank has maintained a relatively tight stance, with inflation staying stable and CHF demand picking up. On the flip side, the Japanese Yen remains broadly weak due to ultra-loose monetary policy from the Bank of Japan. BOJ’s reluctance to shift away from yield curve control and negative interest rates makes JPY one of the most attractive funding currencies, driving consistent CHFJPY upside.
Technically, this move is supported by a textbook breakout from a falling wedge pattern, which historically has a high probability of bullish continuation. The volume and momentum on the breakout were strong, and we have a clean higher high and higher low structure forming. This confirms the end of the correction phase and a transition into a trending bullish cycle. With the current risk sentiment leaning toward CHF strength and JPY weakness, I’m confident in further upside toward my 182.000 target.
I’ll continue to trail stops below 174.00 to lock in profit while giving the trade room to breathe. If price consolidates near 179.50–180.00 with low volume, I may look for re-entry setups on pullbacks. As of now, CHFJPY remains one of the strongest trending pairs on the board, and I’ll stay long as long as the structure holds.
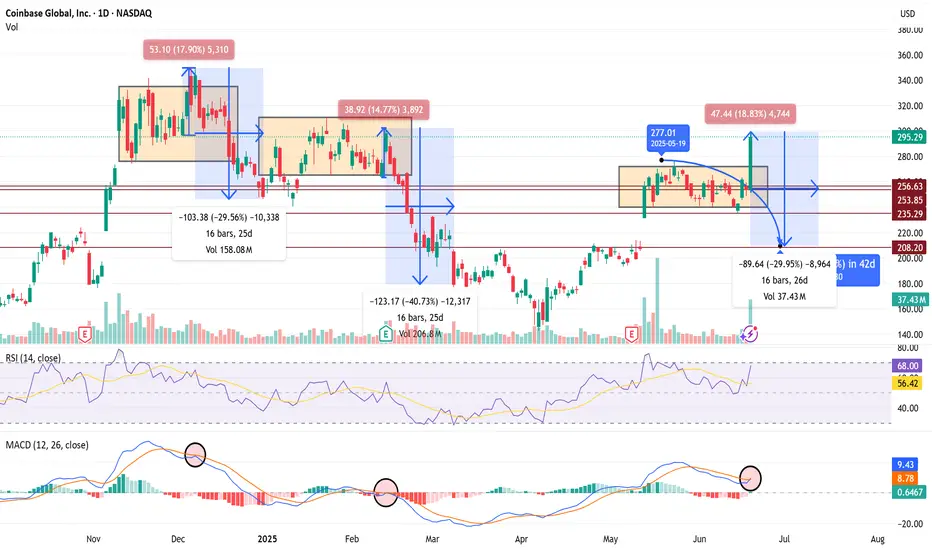
$COIN 30% Pullback Confirms if we Fakeout Recent 15%+ Rally 🧨 COIN SHORT TRADE IDEA — FAKEOUT TRAP IN PLAY
Ticker: NASDAQ:COIN
Date: June 20, 2025
Thesis: Breakout trap setup — expecting a rug pull / red reversal tomorrow to confirm.
🔍 Context
Price broke above range today with a big +18.8% candle to $295 — but...
Volume spike may signal exhaustion, not strength.
RSI = 68 → near overbought
MACD curling into a bearish cross — same signal preceded the last -30% and -40% drawdowns.
History: Same range-break setups in Dec and Feb collapsed hard (-30 to -40%) over 16–25 days.
💣 Trade Plan (Short Setup)
Entry Trigger:
🔻 Enter short if price closes below $277 tomorrow — confirms breakout trap.
Targets:
🎯 Target 1: $253 (top of old range)
🎯 Target 2: $235 (mid-range support)
🎯 Target 3: $208 (full breakdown move, matches last 2 cycles)
Stop Loss:
🛑 Above $297 (breakout highs)
Timeframe:
1–3 weeks (16–26 bars historically)
🧠 Bias
Bearish unless bulls hold $280+. If we get a big red daily candle tomorrow, fakeout confirmed — high-probability follow-through expected.
BTC will get doomed to 96k?NO not now, but you can see it ditto follows the movement as said earlier and shown. with little liquidity left on the top of it!

NXPCUSDT → The coin is being killed. Searching for a new bottomNXPCUSDT is testing the bottom at 1.1675 while Bitcoin and the top 10 cryptocurrencies are in a global/local bullish trend...
NXPCUSDT is showing its weakness in the cryptocurrency market. There is no potential or driver for the coin, and it continues to be killed... Against the backdrop of a growing market and Bitcoin forming a bullish trend, the NXPC coin is testing the bottom...
After a strong and long-term decline, the NXPC coin is forming a flat (consolidation) in the range of 1.5637 - 1.1675. A pre-breakdown base is forming relative to support, which could lead to the price breaking out of consolidation downwards...
Resistance levels: 1.2532
Support levels: 1.1675
Focus on support for the range and bottom in the current coin at 1.1675. This is a risk zone and a panic zone. If the price breaks out of this consolidation, there are no obstacles below and the fall could be aggressive. A breakout of the consolidation support could trigger a continuation of the rally or a decline with the aim of forming a new bottom...
Best regards, R. Linda!

The Importance of the 104463.99 Point
Hello, traders.
Please "Follow" to get the latest information quickly.
Have a nice day today.
-------------------------------------
(BTCUSDT 1D chart)
This volatility period is around June 22nd (June 21-23rd).
Therefore, waves can be generated at any time during the volatility period.
The 104463.99 point is the DOM (60) indicator point of the 1W chart, which corresponds to the end of the high point of the 1W chart.
Therefore, it seems that the price defense is being done well.
I think that defending the price at the high point is significant because it raises expectations for further increase.
-
If it falls after a period of volatility, there is a possibility that it will meet the M-Signal indicator of the 1W chart, and I think the important point at that time is the 99705.62 point.
Therefore, when it falls, you need to check whether the M-Signal indicator of the 1W chart rises to around 99705.62 and whether it is supported.
-
Even if it rises after receiving support near 104463.99, the key is whether it can maintain the price by rising above 108316.90.
The 108316.90 point is the HA-High indicator point of the 1D chart, which corresponds to the middle value of the high point range.
Therefore, in order to continue the uptrend, it must be supported and rise in the 108316.90-111696.21 range.
Currently, both the Low Line and High Line of the auxiliary indicator OBV are showing a downward trend.
Therefore, in order for the uptrend to begin, OBV must rise above the High Line and be maintained.
If not, it is highly likely that it will fall due to selling pressure.
One hopeful(?) thing is that the PVT oscillator is showing an overall upward trend.
(Changed from OBV oscillator to PVT oscillator.)
Therefore, we can see how important the area around 104463.99 is playing a role of support and resistance.
-
In my chart, the basic trading strategy is to buy near the HA-Low indicator and sell near the HA-High indicator.
Therefore, it is virtually impossible to create a trading strategy at the current price level.
In such cases, you should conduct trading through day trading or quick response.
If not, you may experience a lot of psychological fear and anxiety.
The basic time frame chart of all indicators is the 1D chart.
Therefore, if you cannot read the flow of the 1D chart, you are likely to end up getting faked and suffer losses.
Therefore, you should read the flow of the 1D chart and create a big picture of how to create a trading strategy, and respond in detail on the time frame chart below the 1D chart.
-
Thank you for reading to the end.
I hope you have a successful trade.
--------------------------------------------------
- This is an explanation of the big picture.
(3-year bull market, 1-year bear market pattern)
I will explain more details when the bear market starts.
------------------------------------------------------

Bitcoin Short-Term 1H Timeframe, Next Target ConfirmedWe have two drops on this chart. The one of the left is more extended and long lasting compared to the one on the right. When a move is sudden with major force, it tends to end suddenly as well.
The recent drop was very steep and the force needed to keep pushing prices lower cannot be maintained, it requires too much energy; for this reason, a higher low is in place and the bulls win the game.
The action is happening above the blue line and space on the chart, this is the 0.618 Fib. retracement support. This is the most important level and so far it holds. Prices went below just to recover. Can be called a failed signal or a bear-trap, whichever you choose, the action is bullish above this level and bearish below.
Bitcoin's main support stands around $102,663, this level was not challenged. Since bears failed to push prices lower, the next logical move is a challenge of higher resistance. And the same pattern repeats, up and down, up and down... This is the short-term noise. When all is set and done, Bitcoin will resolve going up.
Patience is key.
Thank you for reading.
Thanks a lot for your continued support.
Namaste.

Upon reaching PDL price
Previous Day rejected the previous day's low.
When price reaches PDL if price shows a bullish CHOCH to the upside
there could be a bullish orderflow change @ near previous day low's
Could be a good long entry towards previous day high

BTC – 15min Reversal Structure & Fibonacci ReclaimWe’re currently witnessing a potential short-term reversal on BTC’s lower timeframe after a volume-supported breakdown and sweep of local lows.
🔍 Key Observations:
Price swept liquidity at local lows (~103,929.27)
Entered into a clear reaccumulation box with responsive buyers
Volume profile shows prior POC just above – room for fill
Fibonacci retracement aligns with key structure:
0.5 = 104,372.94
0.618 = 104,268.23
1.0 = 104,816.60 (final high target for this impulse)
📈 Potential Play:
Entry Zone: Just above the sweep candle (104,100–104,200)
Target 1: 0.382 at 104,477
Target 2: 104,816.60
Invalidation: Close below 103,926
🧠 Mindset:
This is a classic liquidity sweep → reaction → reclaim pattern. If BTC flips the 0.5 level with strong momentum, a short squeeze toward the 104.8K area becomes likely.
Great opportunity for scalpers or day traders.
Let me know if you want this turned into a long-form breakdown or sent in another format.

BTCUSD: Israel-Iran conflict like October 2024.Despite the Middle East tension, Bitcoin remains long term bullish on its 1W technical outlook (RSI = 63.167, MACD = 6883.200, ADX = 33.150). It remains supported on its 1D MA50, in fact in the same manner it was during the previous Israel-Iran conflict. I was on October 26th 2024, when Israel launched three waves of strikes against 20 locations in Iran and other locations in Iraq, and Syria. Simila to the June 13th 2025 attacks. It is more than striking how similar the two price patterns are. Assisted by the U.S. elections on November 5th 2024, a massive rally followed the Middle East conflict. A repeat of that may very well send Bitcoin to $150,000 and above.
## If you like our free content follow our profile to get more daily ideas. ##
## Comments and likes are greatly appreciated. ##

BTC Approaching Key Confluence Zone: Pivot + PRZ + LiquidationsBitcoin ( BINANCE:BTCUSDT ) appears to have broken the Support lines and is currently declining .
In terms of Elliott Wave theory , Bitcoin appears to be completing a corrective wave C . The corrective wave structure is a Zigzag Correction(ABC/5-3-5) .
I expect Bitcoin to start rising again from the Support zone($104,380-$103,660) , Potential Reversal Zone(PRZ) , Cumulative Long Liquidation Leverage($104,471-$103,124) , Monthly Pivot Point , Support line , and 50_SMA(Daily) , and the small CME Gap($106,190-$106,150) will also fill.
Note: Stop Loss: $102,520
Please respect each other's ideas and express them politely if you agree or disagree.
Bitcoin Analyze (BTCUSDT), 1-hour time frame.
Be sure to follow the updated ideas.
Do not forget to put a Stop loss for your positions (For every position you want to open).
Please follow your strategy and updates; this is just my Idea, and I will gladly see your ideas in this post.
Please do not forget the ✅' like '✅ button 🙏😊 & Share it with your friends; thanks, and Trade safe.

SUPER Long Setup – Confluence of Fibonacci and Major SupportSUPER has retraced into a strong confluence zone, aligning with the 61.8% Fibonacci level and a major support area. The $0.55–$0.58 range offers a solid opportunity to enter a long swing trade.
📌 Trade Setup:
• Entry Zone: $0.55 – $0.58
• Take Profit Targets:
o 🥇 $0.75 – $0.90
o 🥈 $1.05 – $1.20
• Stop Loss: Daily close below $0.50


ADAUSDT IDEAlower lows and a flat. Seems to be a trade opportunity which ever side it goes off breaking its current structure.

BTC
BTC is currently in local consolidation. After a liquidity grab on either side, potential entry setups may form via the AMD pattern — but only if key conditions are met.
No setup — no trade. Wait for confirmation.

₿itcoin: Holding steadySince our last update, Bitcoin has traded in a relatively stable range. As expected, there's still a strong case for the crypto leader to climb into the upper blue Target Zone between $117,553 and $130,891. However, a deeper pullback below the $100,000 mark remains a real possibility before that move unfolds. Regardless of the path it takes, we continue to expect Bitcoin to reach this upper zone, completing green wave B. From there, a corrective wave C—also in green—is likely to follow, driving the price down toward the lower blue Target Zone between $62,395 and $51,323. This move would mark the end of the broader orange wave a. For now, we’re watching for a potential b-wave recovery before the final leg lower toward the bottom of blue wave (ii) takes shape. That said, there's still a 30% chance that blue wave (i) isn’t done yet and could extend significantly above $130,891 before any meaningful correction begins.
📈 Over 190 precise analyses, clear entry points, and defined Target Zones - that's what we do.
