Bitcoin Turns Bullish, What To Expect—$200,000 New All-Time HighWe have good news here. Bitcoin continues trading above $100,000-$102,000, in fact, this range hasn't been tested as support so far and this is a bullish development. Not moving below 100K can lead to a new all-time high in the coming months.
What to expect short-term.
The action is bullish now and we see some rising volume. Very little volume but still rising with two green candles. We have multiple levels to consider.
1) The $106,000-$107,000 price range. This is the zone labeled "local resistance" on the chart. If Bitcoin manages to move and close above this level on a daily basis, we can say the bulls are back in. While Bitcoin trades below this level, market conditions remain bearish and you can expect lower prices. Right now it is still bearish.
2) Once this local resistance is broken the next resistance to consider sits around $110,000. As soon as Bitcoin breaks this level it is hyper-bullish and we can aim for 200K.
Let's visit the all-time high potential in late 2025.
» If Bitcoin crashes below 100K and reaches the low 90Ks or lower, then the 200K target for a new ath later this year becomes less likely.
» If Bitcoin never moves below 100K then 200K becomes a high probability target, makes sense?
Right now conditions are still bearish because Bitcoin trades below "local resistance." The small green candles are not enough and it is still too early to say. Market conditions remain the same.
A good scenario would be consolidation, sideways, before additional growth. This would produce the best possible conditions for the altcoins market to thrive and grow.
Namaste.
Btc!

BITCOIN - Bearish Double TOPHello Traders !
On the 1H time frame, The Bitcoin price formed a double top pattern.
Currently, The neckline is broken !
So, I expect a bearish move📉
________________
TARGET: 103170🎯

Bitcoin (BTCUSDT) - Price Testing 26EMA and 12EMA - Daily ChartBitcoin (BTCUSDT) price is currently testing the 26EMA and 12EMA price levels on the Daily chart.
Bitcoin price has been in a medium-term uptrend since April and May 2025.
However, a short-term downtrend pullback has occurred and the price recently bounced up from the 26EMA zone ($104,000).
A morning star candle price pattern printed above the 26 EMA support line.
Large buyer volume could confirm the price candle pattern and Bitcoin price could rally up above 12EMA resistance ($106,000).
If price continues to reject and fall below $106,000 the downtrend would likely continue into June 2025.
Breaking news and stock market correlations could affect the price of Bitcoin and cryptocurrencies.
Tariff news and trade deals are supposed to occur throughout June and July 2025.

Explanation of indicators indicating high points
Hello, traders.
If you "Follow", you can always get new information quickly.
Have a nice day today.
-------------------------------------
(BTCUSDT 1D chart)
If it falls below the finger point indicated by the OBV indicator, it can be interpreted that the channel consisting of the High Line ~ Low Line is likely to turn into a downward channel.
And, if it falls to the point indicated by the arrow, it is expected that the channel consisting of the High Line ~ Low Line will turn into a downward channel.
Therefore, if it is maintained above the point indicated by the finger, I think it is likely to show a movement to rise above the High Line.
In this situation, the price is located near the M-Signal indicator on the 1D chart, so its importance increases.
To say that it has turned into a short-term uptrend, the price must be maintained above the M-Signal indicator on the 1D chart.
In that sense, the 106133.74 point is an important support and resistance point.
(1W chart)
The HA-High indicator is showing signs of being created at the 99705.62 point.
The fact that the HA-High indicator has been created means that it has fallen from the high point range.
However, since the HA-High indicator receives the value of the Heikin-Ashi chart, it indicates the middle point.
In other words, the value of Heikin-Ashi's Close = (Open + High + Low + Close) / 4 is received.
Since the HA-High indicator has not been created yet, we will be able to know for sure whether it has been created next week.
In any case, it seems to be about to be created, and if it maintains the downward candle, the HA-High indicator will eventually be created anew.
Therefore, I think it is important to be able to maintain the price by rising above the right Fibonacci ratio 2 (106178.85).
Indicators that indicate high points include DOM (60), StochRSI 80, OBV High, and HA-High indicators.
Indicators that indicate these high points are likely to eventually play the role of resistance points.
Therefore,
1st high point range: 104463.99-104984.57
2nd high point range: 99705.62-100732.01
You should consider a response plan depending on whether there is support near the 1st and 2nd above.
The basic trading strategy is to buy at the HA-Low indicator and sell at the HA-High indicator.
However, if it is supported and rises in the HA-High indicator, it is likely to show a stepwise rise, and if it is resisted and falls in the HA-Low indicator, it is likely to show a stepwise decline.
Therefore, the basic trading method should utilize the split trading method.
Other indicators besides the HA-Low and HA-High indicators are auxiliary indicators.
Therefore, the trading strategy in the big picture should be created around the HA-Low and HA-High indicators, and the detailed response strategy can be carried out by referring to other indicators according to the price movement.
In that sense, if we interpret the current chart, it should be interpreted that it is likely to show a stepwise rise since it has risen above the HA-High indicator.
However, you can choose whether to respond depending on whether there is support from other indicators that indicate the high point.
On the other hand, indicators that indicate the low point include the DOM (-60), StochRSI 20, OBV Low, and HA-Low indicators.
These indicators pointing to lows are likely to eventually serve as support points.
I will explain this again when the point pointing to the lows has fallen.
-
Thank you for reading to the end.
I hope you have a successful trade.
--------------------------------------------------
- Here is an explanation of the big picture.
(3-year bull market, 1-year bear market pattern)
I will explain the details again when the bear market starts.
------------------------------------------------------

BTC Scalping / Intraday Signal – Entry, Stop & Target Ready!🕒 Timeframe: 15min / 5min
⚠️ Note: Manage your risk — intraday volatility is high.
This is a short-term opportunity, not a long hold.
Disclaimer: This is our personal analysis and not financial advice. Always do your own research before making any investment decisions.
💬 What’s your take on this? Drop your thoughts in the comments and feel free to share this with your friends! ❤️

BTCUSD: Neutral but long term still intact.Bitcoin has turned neutral on its 1D technical outlook (RSI = 50.968, MACD = 1795.700, ADX = 23.670) a direct consequence of last week's correction. That correction is though just a pullback on the 1W timeframe, which is more bullish than ever as it's coming off a May 1W MACD Bullish Cross. Since the 1W MA50 supported April's bottom and produced the current rebound (even ATH has been made) that also respected the powerful P1 trendline, this is a bullish wave similar to all prior since the late 2022 Bear Cycle bottom. As all 3 rallied by +100%, we can stay bullish aiming for 150,000 towards the end of the year.
## If you like our free content follow our profile to get more daily ideas. ##
## Comments and likes are greatly appreciated. ##

Bitcoin Bullish Bias Becomes Stronger —New All-Time High EasyWith every day that passes and Bitcoin doesn't move below 100K the bullish bias becomes stronger. It is a death sentence for the bears. Bitcoin can't never move lower as long as the $100-$102,000 mega support barrier continues intact. And it hasn't been tested yet.
Good afternoon my fellow Cryptocurrency genius, how are you feeling today?
The market gives, the market also takes.
When looking at Bitcoin with a short-term mindset, everything is possible, it is hard to predict what will happen next but, when we focus on the actual price action, no doubt remains. Let me explain.
It doesn't matter if a candle is big or small...
It doesn't matter if Michael Saylor and the ETFs are buying or selling Bitcoin, what matters most is resistance and support.
Bitcoin's strong long-term mega-support remains intact and that is $102,000. Bitcoin is hyper-bullish above $100,000 and this is obvious. We are near the all-time high and the closer the action happens to resistance, the stronger the market. As Bitcoin moves sideways, consolidation, the altcoins will grow.
The altcoins cannot grow if Bitcoin is going to crash and yet the altcoins are starting to recover and some are looking great. I will continue to share more and the more I share the more convinced you will become that the next major move is up. We are set to experience growth long-term.
Aim higher, we are now-already in the 2025 bull market.
Never short Bitcoin within a bull market.
Namaste.

BTC Enters Price Discovery Above $110K—A New Bull Cycle BeginsHistoric Breakout:
Bitcoin has officially entered uncharted territory, breaking decisively above the previous all-time high of $108,364 to surge past $110,000. This isn’t just psychological — it's a clear technical confirmation that the corrective phase is over and a new bullish cycle is underway.
Momentum Without Pause:
The impressive rally has unfolded with minimal pullbacks, a sign of:
Strong institutional accumulation
Growing retail FOMO
This sustained buying pressure suggests we’re witnessing more than a short-term rally — this could be the start of a parabolic move.
Risk Management & Key Support:
Even with minor pullbacks, the technical picture remains bullish.
The $102,000–$106,000 zone (previous resistance) is now key support
This area offers a strategic entry point for those waiting to buy the dip
Price Discovery Mode:
Now in true price discovery, Bitcoin faces no historical resistance overhead. The path of least resistance remains upward, with potential for explosive gains as we move into the summer months.
🚀 Next stop? Price targets in the $130K+ zone may soon come into focus.
#Bitcoin #BTC #AllTimeHigh #CryptoBreakout #PriceDiscovery #BullRun #CryptoMarket #TechnicalAnalysis #BitcoinToTheMoon

$BTC not finished yetHey!
I'm still me, just a quick rebranding honoring my father.
CRYPTOCAP:BTC cycle is far from over. Not saying we bottomed yet. I think prices bewteen 96 - 102k could be reached on the upcoming days.
Althought this bearish momentum, we should encounter a goooood support level which would lead us to a great short absortion. If price holds those levels this week (maybe next too) there is a high chance we will see a new leg above the ATH level.
Im long here. Stay tuned

Bitcoin Daily: It Will Go Lower, I Will Explain WhyIt is hard to make these predictions because there are so many different points of view, so many opinions. There is so much data available that one can easily become confused. We can write an entire book about Bitcoin's next move and still not know what will happen next. I will keep it simple and straight forward and you will be able to understand and appreciate how easy it is when we focus on the chart only. Bitcoin is breaking below 100K.
Bitcoin is already trading at support. The mid-May consolidation range. From this range Bitcoin produced an advance and hit a new all-time high. The all-time high is a triple-top when we take the highs from January 2025 and December 2024. The fact that the action happens below this level now is bearish and this range has been confirmed as resistance.
The market will look for strength and this simply means lower.
Since resistance has been confirmed after a 50% rise, it is normal to see a retrace, can be medium-sized to balance out the strong-long bullish wave. Bullish action was present between 7-April until 22-May, 45 days.
The current retrace can take only a few weeks, think about 15-21 June as a rough estimate but nothing more (can end much sooner).
If you are unprepared and don't have map of the bigger picture, this can become terrifying and even lead to poor decisions at some point. If you know that this is only a retrace and the market will continue growing after a test above 90K, you can rest easy or even take advantage of this situation.
Now, what Bitcoin does is not the entire market. In a bull market, when Bitcoin moves down, money flows to the Altcoins. When Bitcoin goes sideways, the Altcoins grow. So dynamics will be much, much different now compared to what you saw in 2024, 2023 and 2022. The way the market will behave it is basically new for most participants.
The conclusion is that all is good and the chart is pointing lower short-term. After a short-term retrace, we get additional growth. Simple isn't it? It is...
Thank you for reading.
Namaste.

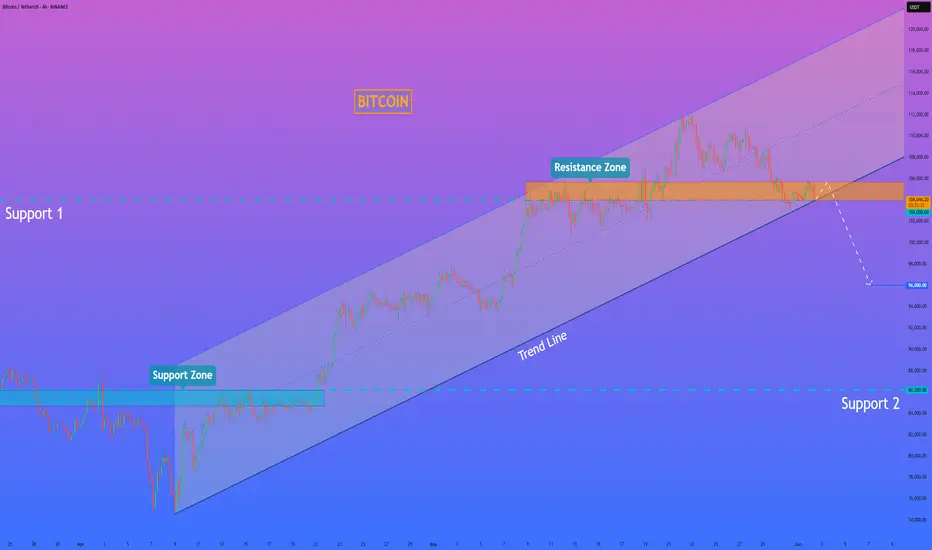
HelenP. I Bitcoin can exit break trend line and continue to fallHi folks today I'm prepared for you Bitcoin analytics. After looking at the chart, we can see how the price declined and broke support 2, which coincided with the support zone. Then the price rose to the support zone but turned around and dropped to the trend line. After this movement, BTC started to grow inside an upward channel, where it soon rose to support 2, which soon broke it and continued to move up. In the channel, price rose to support 1 and some time traded near this level. Later, BTC broke it and rose to the resistance line of the channel and turned around, and dropped to support 1. And at the moment, it traded inside the resistance zone, which coincided with the support level. So, I expect that BTCUSDT will break the support level, which coincides with the trend line, and continue to decline, thereby exiting from upward channel. That's why I set my goal at 96000 points. If you like my analytics you may support me with your like/comment ❤️
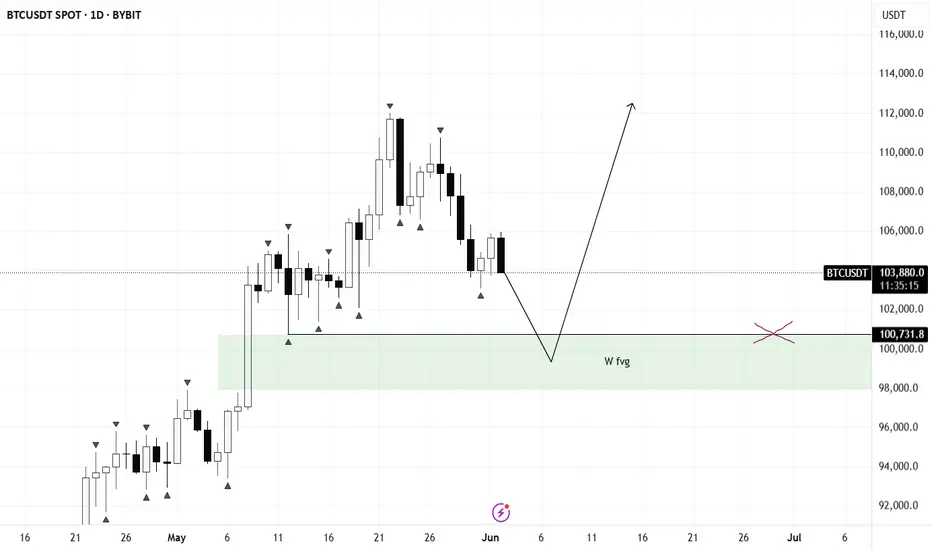
BTC/USDT🔔 New Month Kicks Off — Caution with Futures
I wouldn’t rush into aggressive futures trading right now.
Key long zones to watch:
• Liquidity sweep near 100,700
• Entry into the weekly FVG zone
That’s where I’ll be monitoring closely for potential position building.
🧠 The logic is simple:
For a solid entry point, the market needs to define the monthly and weekly lows.
This reduces the risk of getting chopped in volatility and offers a cleaner market structure.
☀️ Seasonal Context:
Summer is here — market dynamics shift.
Don’t expect explosive volatility; a prolonged sideways phase is on the table.
📉 If BTC sweeps the lows from current levels — we can consider a continuation of the long setup.
Otherwise, it’s best to wait for confirmation before entering.
02/06/25 Weekly OutlookLast weeks high: $110,718.68
Last weeks low: $103,065.74
Midpoint: $106,892.21
As we approach the middle of the year, Bitcoin is back above $100,000 despite pulling back from a new ATH of $112,000. In the month of MAY BlackRocks ETF had record inflows of over $6B propelling prices 11% higher.
Last week we saw as the month closed and with that it's natural to have a window dressing period that usually leads to de-risking slightly. BTC stayed within the previous weeks range and maintains the pattern of:
Chop/consolidation --> expansion to the upside --> chop/consolidation...
However in this case the consolidation week had a much larger range than in the past which is a sign to me that the rally is exhausted for now. It's because of this I feel we may see a weekly low break for the first time in a month and get a more meaningful pullback than we've seen since early April. My target would be around the $97,000 area.
The case for the bulls is still a convincing one despite some red flags. Record ETF inflows continue to pour, M2 money supply continues to grow and a general shift to risk-on assets is clear. However these are longer term factors and just for this weeks outlook the momentum is with the bears briefly.

BTC (Post Weekly Close Update)CRYPTOCAP:BTC (Post Weekly Close Update)
We’ve confirmed a weekly SFP and observed a bearish engulfing weekly close, signaling caution at the very least. Whether the price corrects to our target, BOs here, or reaches a new ATH remains uncertain, so we’ll play it level by level. Imo, subtle signs of bullish exhaustion are worth noting.
That said, I don’t expect a collapse to 70K, though anything is possible. I anticipate a drop below the key 100K level, targeting the 18H HOB and weekly FVG around 98K. We could even see a wick into the CME gap, YO, and VRVP support observed at 94K. This move may spark fear, traders anticipating lower, with some calling for a bear market. However, I expect the price to reverse, reclaim key levels, and resume the uptrend.
On LTF/MTF - charts, we’re trading level by level. A range may form, allowing the market to gather liquidity to sustain the trend, especially since we missed liquidity at 72K. As long as the price remains below 107K, scalping makes more sense than swing trading in the short term. A break above 107K could target 110K or a new ATH. However, if the price reaches 107K - around 107800 - I’d consider shorting. A daily close above 107K might trap retail traders into opening longs, only for the price to retrace and head lower (keep this scenario in mind).
VELO data:
Market dynamics are stable. Spot is flat or selling, while perps are driving pric. OI has dropped from dangerous levels, and funding rates remain slightly positive. Overall, nothing significant is occurring, which aligns with the current range-bound market.

Bitcoin - Will Bitcoin reach $120,000?!Bitcoin is in its short-term descending channel on the four-hour timeframe, between the EMA50 and EMA200. Personally, I would look to sell Bitcoin at a target of $100,000. Either from the channel ceiling or after an invalid breakout of the specified channel. If this corrective move occurs, Bitcoin buying opportunities can be sought within the demand zone.
It should be noted that there is a possibility of heavy fluctuations and shadows due to the movement of whales in the market, and capital management in the cryptocurrency market will be more important. If the downward trend continues, we can buy within the demand range.
The Bitcoin 2025 Conference, widely regarded as the largest global event dedicated to Bitcoin and blockchain technology, took place from May 27 to 29 at the Venetian Convention Center in Las Vegas, Nevada. First launched in 2019 and held annually since, the conference has become the central meeting point for Bitcoin enthusiasts and professionals, offering a platform for knowledge exchange, ideation, and innovation within the Bitcoin ecosystem. With over 30,000 attendees, 400 speakers, and participation from around 5,000 companies, this year’s event played a significant role in advancing the global adoption of Bitcoin—often referred to as “hyperbitcoinization.”
The 2025 edition covered not only technical subjects such as Layer 2 scaling solutions and privacy enhancements, but also broader themes like institutional adoption, strategic Bitcoin reserves, and its implications for financial freedom on a global scale.From an economic perspective, there was a strong emphasis on Bitcoin’s role as a store of value amid inflationary pressures and unstable monetary policies. Forecasts presented by key figures such as Michael Saylor and Paolo Ardoino pointed to Bitcoin’s potential to emerge as a foundational asset within global financial systems. These projections were further supported by the expansion of the M2 money supply in 2024 and expectations for continued growth into 2025.
In addition to highlighting opportunities, the event also addressed the challenges facing Bitcoin. One major concern was the lack of clear legal and regulatory frameworks in certain countries—a topic addressed by Caitlin Long and other speakers. Such regulatory uncertainty could hinder broader Bitcoin adoption. Moreover, Bitcoin’s price volatility—highlighted by a 3.4% decline in the weeks leading up to the conference—raised questions about the market’s long-term stability.
Meanwhile, Coinbase reported that the repayment of debts related to the bankrupt FTX exchange could act as a $5 billion liquidity injection into the crypto market. This development is expected to boost capital inflows and potentially draw major institutional players back into the space.
According to Coinbase, as of May 30, the “FTX Recovery Trust” has begun its second phase of repayments, distributing over $5 billion in stablecoins to creditors. These payouts are being processed over three days via the BitGo and Kraken platforms. Unlike the first round in February, this phase involves only stablecoin disbursements rather than a mix of crypto and cash—enabling recipients to reinvest their funds more quickly and efficiently.
Additionally, U.S.-based companies currently hold 94.8% of all Bitcoin owned by publicly traded firms. The U.S. also commands 36% of the global Bitcoin hash rate, underscoring its dominance in mining activities. So far, 36 U.S. states have enacted pro-Bitcoin legislation, signaling a growing legal endorsement of the cryptocurrency across the country. This level of concentration—in ownership, regulatory leadership, and mining capacity—could position the U.S. to play a more decisive role in shaping future global Bitcoin regulations.

BITCOIN Can the 4H MA200 hold and kickstart the next rally? Bitcoin (BTCUSD) almost hit on Saturday its 4H MA200 (orange trend-line), which has been holding since April 16, and immediately rebounded. So far the bullish reaction is moderate as the price action is still being restricted below the 4H MA50 (blue trend-line), which is now acting as the short-term Resistance.
The blue Arc pattern that BTC has formed in the past 3 weeks, resembles the last two peak formations and pull-backs since the early April bottom. On top of all this, the 4H RSI got oversold (30.00) actually for the first time since the April 07 bottom.
With the weakest rally of this long-term Bullish Leg being +16.06%, if the 4H MA200 holds and a 4H MA50 break-out confirms it, we can expect a minimum short-term rise of almost $120k (+16.06%).
Do you think that's what's coming next? Feel free to let us know in the comments section below!
-------------------------------------------------------------------------------
** Please LIKE 👍, FOLLOW ✅, SHARE 🙌 and COMMENT ✍ if you enjoy this idea! Also share your ideas and charts in the comments section below! This is best way to keep it relevant, support us, keep the content here free and allow the idea to reach as many people as possible. **
-------------------------------------------------------------------------------
💸💸💸💸💸💸
👇 👇 👇 👇 👇 👇

btc $121kbitcoin has completed three weekly and monthly closes above the current demand zone. pullbacks are treated as a healthy retest but will serve as fuel for another bullish wave

Bitcoin Daily Technical Overview (BTC/USD)Currently, Bitcoin (BTC/USD) is trading around $104,800. Up slightly but still digesting a sharp reversal that rattled short-term bulls.
Recent Price Action: Rejection From $112K
Back on 22nd May, Bitcoin surged to a new high near $112,000, fueled by bullish momentum, institutional flows, and strong on-chain accumulation. However, that breakout was swiftly rejected, and BTC fell as low as $103,400.
This kind of "bull trap" reversal highlights a few key dynamics:
1) Overextended sentiment: The rally above $110K was not supported by volume or follow-through, suggesting exhaustion.
2) Profit-taking by large holders or institutions likely triggered a cascade of stop-losses, accelerating the decline.
3) Liquidation clusters in leveraged long positions likely exacerbated the drop.
Bitcoin is now attempting to reclaim stability around the $104K–$105K range.
🔍 Technical Snapshot
- Support Zones at $103,000 and $93,200
- Resistance Levels at $112,000 (ATH)
Price is still above the 50 & 200-day SMAs, which could be a bullish longer-term signal.
In addition, the price remains above the upper band of the cloud, but momentum is stalling. A decisive bounce off the cloud could reignite bullish sentiment. Or falling into the cloud could trigger more uncertainty and downside.
Macro tailwinds: Concerns over U.S. fiscal stability and potential Fed rate cuts could keep Bitcoin attractive as a non-sovereign asset.
📈 Projection Scenarios
Bullish Case:
If BTC consolidates above $107K, we could see another attempt and retest of $112K.
Bearish Case:
Failure to hold above $103K could see Bitcoin revisit $100K, and if that breaks, downside opens toward the $93K level.
🧭 Insight & Takeaway
The current reversal serves as a healthy reminder that no trend goes up in a straight line. Especially not in crypto.
It likely shook out overleveraged longs, reset sentiment, and may give the market room to breathe before the next leg up.
The long-term trend remains intact, but expect more volatility before any clean break to new highs.
Always DYOR and DYODD and manage your risk.

$ETH Analysis — Correction Incoming?Summary:
After a strong ~100% rally in ETH, price hit a major resistance zone near $2734.78, triggering a significant sell-off, likely driven by algorithmic profit-taking. Now, the market is poised for a healthy correction before another potential leg up.
📉 What's Next for Ethereum?
🔍 Expecting a Correction of 7% to 25%
Based on technical structure and indicator behavior, ETH is likely to retrace to one of the two key zones:
✅ Primary Buy Zone ("Most Likely"): $2297.20
This zone aligns with previous structure support.
It’s where the price may form a higher low and resume its upward trend.
Ideal for opening a swing long with a tight risk-reward ratio.
🔥 Deeper Correction Opportunity: $1779.58
While less likely, a drop to this level would be a major long opportunity.
Aligns with historical demand and long-term support levels.
Also intersects with the yellow trendlines suggesting trend-based support zones.
📊 Why This Correction Makes Sense:
Weekly Money Flow Index (MFI) is Dropping:
MFI divergence suggests money is flowing out, weakening bullish momentum.
A trigger wave is forming, often preceding price corrections.
Algo Profit-Taking is Done:
Smart money likely exited around $2734.78 (highlighted in chart).
They’ll need to accumulate again at lower levels before the next rally.
📈 Potential Upside Targets:
If ETH respects the structure and finds support around $2297 or deeper, we could see a rally toward $3296.85 — a key Fibonacci extension and psychological level.
🧘♂️ Reminder:
No emotional entries. Let the price come to you. Trust the setup and stick to your plan.
📌 Disclaimer: This is not financial advice. Just a breakdown of my trading thesis. Always manage your risk.

98-101KMorning folks,
Last time BTC was not able to provide the direction as it was standing in triangle and we prepared "neutral" update, waiting for triangle breakout.
Now we see that this has happened to the downside and market just stands slightly above XOP target. So we consider 98-101K area as the nearest target.
Second, once (and if) this action will be over - take look at H&S, and it could trigger stronger downside retracement. This it turn might be quite welcome for weekly reverse H&S pattern .
That's being said, the first step that we're watching - is down to the potential neckline around 98-101K. Then we decided for to do next.

BTC - Road to 107k through small scalps!!As I mentioned earlier the time i posted the chart, BTC did exactly the move I anticipated, however 104,545 is the point of your buy with short scalps till 105,992, if moves up trail, can throttle to 107,914

XAUUSD BULLISH OR BEARISH ------ DETAILED ANALYSISXAUUSD is currently forming a classic bullish flag pattern on the 12-hour timeframe after a strong impulsive rally from the 3145 demand zone. The consolidation is tight and orderly, holding above the key structure zone and forming lower highs and lower lows within the flag. This setup indicates a continuation pattern, and with price stabilizing around 3315, a breakout to the upside is increasingly likely. A clean breakout from the flag will likely ignite the next bullish wave toward the 3500 level.
From a fundamental perspective, gold remains supported amid renewed market concerns around inflation persistence and global macro uncertainty. The latest US economic data, including slower job growth and declining consumer sentiment, is increasing speculation that the Federal Reserve might be nearing the end of its tightening cycle. This is weakening the US dollar and boosting safe-haven demand for gold. Additionally, central banks, particularly from China and emerging markets, continue to increase gold reserves—adding to long-term bullish sentiment.
Technically, XAUUSD has already respected a strong demand zone around 3145 multiple times, which reinforces that institutional buyers are defending this area. The market structure remains bullish, and higher lows continue to form, aligning with a potential trend continuation. If price breaks above the flag resistance around 3325–3330 with volume confirmation, the bullish target of 3500 could be reached swiftly.
As long as gold holds above the 3270–3280 support zone, the risk-reward setup remains favorable for long positions. With a confluence of strong fundamentals and a high-probability technical pattern, XAUUSD is setting up for a potential breakout rally. Traders should watch closely for breakout confirmation to ride the momentum toward new highs in this evolving bullish trend.

Correlation between USDT.D and BTC.D
Hello, traders.
If you "Follow", you can always get new information quickly.
Have a nice day today.
-------------------------------------
(USDT.D 1M chart)
If USDT dominance is maintained below 4.97 or continues to decline, the coin market is likely to be on the rise.
The maximum decline is expected to be around 2.84-3.42.
-
(BTC.D 1M chart)
However, in order for the altcoin bull market to begin, BTC dominance is expected to fall below 55.01 and remain there or show a downward trend.
Therefore, we need to see if it falls below the 55.01-62.47 range.
The maximum rise range is expected to be around 73.63-77.07.
-
In summary of the above, since funds are currently concentrated in BTC, it is likely that BTC will show an upward trend, and altcoins are likely to show a sideways or downward trend as they fail to follow the rise of BTC.
The major bear market in the coin market is expected to begin in 2026.
For the basis, please refer to the explanation of the big picture below.
-
Thank you for reading to the end.
I hope you have a successful transaction.
--------------------------------------------------
- This is an explanation of the big picture.
(3-year bull market, 1-year bear market pattern)
I will explain more details when the bear market starts.
------------------------------------------------------
