Bitcoin Daily Technical Overview (BTC/USD)Currently, Bitcoin (BTC/USD) is trading around $104,800. Up slightly but still digesting a sharp reversal that rattled short-term bulls.
Recent Price Action: Rejection From $112K
Back on 22nd May, Bitcoin surged to a new high near $112,000, fueled by bullish momentum, institutional flows, and strong on-chain accumulation. However, that breakout was swiftly rejected, and BTC fell as low as $103,400.
This kind of "bull trap" reversal highlights a few key dynamics:
1) Overextended sentiment: The rally above $110K was not supported by volume or follow-through, suggesting exhaustion.
2) Profit-taking by large holders or institutions likely triggered a cascade of stop-losses, accelerating the decline.
3) Liquidation clusters in leveraged long positions likely exacerbated the drop.
Bitcoin is now attempting to reclaim stability around the $104K–$105K range.
🔍 Technical Snapshot
- Support Zones at $103,000 and $93,200
- Resistance Levels at $112,000 (ATH)
Price is still above the 50 & 200-day SMAs, which could be a bullish longer-term signal.
In addition, the price remains above the upper band of the cloud, but momentum is stalling. A decisive bounce off the cloud could reignite bullish sentiment. Or falling into the cloud could trigger more uncertainty and downside.
Macro tailwinds: Concerns over U.S. fiscal stability and potential Fed rate cuts could keep Bitcoin attractive as a non-sovereign asset.
📈 Projection Scenarios
Bullish Case:
If BTC consolidates above $107K, we could see another attempt and retest of $112K.
Bearish Case:
Failure to hold above $103K could see Bitcoin revisit $100K, and if that breaks, downside opens toward the $93K level.
🧭 Insight & Takeaway
The current reversal serves as a healthy reminder that no trend goes up in a straight line. Especially not in crypto.
It likely shook out overleveraged longs, reset sentiment, and may give the market room to breathe before the next leg up.
The long-term trend remains intact, but expect more volatility before any clean break to new highs.
Always DYOR and DYODD and manage your risk.
Btc!

$ETH Analysis — Correction Incoming?Summary:
After a strong ~100% rally in ETH, price hit a major resistance zone near $2734.78, triggering a significant sell-off, likely driven by algorithmic profit-taking. Now, the market is poised for a healthy correction before another potential leg up.
📉 What's Next for Ethereum?
🔍 Expecting a Correction of 7% to 25%
Based on technical structure and indicator behavior, ETH is likely to retrace to one of the two key zones:
✅ Primary Buy Zone ("Most Likely"): $2297.20
This zone aligns with previous structure support.
It’s where the price may form a higher low and resume its upward trend.
Ideal for opening a swing long with a tight risk-reward ratio.
🔥 Deeper Correction Opportunity: $1779.58
While less likely, a drop to this level would be a major long opportunity.
Aligns with historical demand and long-term support levels.
Also intersects with the yellow trendlines suggesting trend-based support zones.
📊 Why This Correction Makes Sense:
Weekly Money Flow Index (MFI) is Dropping:
MFI divergence suggests money is flowing out, weakening bullish momentum.
A trigger wave is forming, often preceding price corrections.
Algo Profit-Taking is Done:
Smart money likely exited around $2734.78 (highlighted in chart).
They’ll need to accumulate again at lower levels before the next rally.
📈 Potential Upside Targets:
If ETH respects the structure and finds support around $2297 or deeper, we could see a rally toward $3296.85 — a key Fibonacci extension and psychological level.
🧘♂️ Reminder:
No emotional entries. Let the price come to you. Trust the setup and stick to your plan.
📌 Disclaimer: This is not financial advice. Just a breakdown of my trading thesis. Always manage your risk.

98-101KMorning folks,
Last time BTC was not able to provide the direction as it was standing in triangle and we prepared "neutral" update, waiting for triangle breakout.
Now we see that this has happened to the downside and market just stands slightly above XOP target. So we consider 98-101K area as the nearest target.
Second, once (and if) this action will be over - take look at H&S, and it could trigger stronger downside retracement. This it turn might be quite welcome for weekly reverse H&S pattern .
That's being said, the first step that we're watching - is down to the potential neckline around 98-101K. Then we decided for to do next.

BTC - Road to 107k through small scalps!!As I mentioned earlier the time i posted the chart, BTC did exactly the move I anticipated, however 104,545 is the point of your buy with short scalps till 105,992, if moves up trail, can throttle to 107,914

XAUUSD BULLISH OR BEARISH ------ DETAILED ANALYSISXAUUSD is currently forming a classic bullish flag pattern on the 12-hour timeframe after a strong impulsive rally from the 3145 demand zone. The consolidation is tight and orderly, holding above the key structure zone and forming lower highs and lower lows within the flag. This setup indicates a continuation pattern, and with price stabilizing around 3315, a breakout to the upside is increasingly likely. A clean breakout from the flag will likely ignite the next bullish wave toward the 3500 level.
From a fundamental perspective, gold remains supported amid renewed market concerns around inflation persistence and global macro uncertainty. The latest US economic data, including slower job growth and declining consumer sentiment, is increasing speculation that the Federal Reserve might be nearing the end of its tightening cycle. This is weakening the US dollar and boosting safe-haven demand for gold. Additionally, central banks, particularly from China and emerging markets, continue to increase gold reserves—adding to long-term bullish sentiment.
Technically, XAUUSD has already respected a strong demand zone around 3145 multiple times, which reinforces that institutional buyers are defending this area. The market structure remains bullish, and higher lows continue to form, aligning with a potential trend continuation. If price breaks above the flag resistance around 3325–3330 with volume confirmation, the bullish target of 3500 could be reached swiftly.
As long as gold holds above the 3270–3280 support zone, the risk-reward setup remains favorable for long positions. With a confluence of strong fundamentals and a high-probability technical pattern, XAUUSD is setting up for a potential breakout rally. Traders should watch closely for breakout confirmation to ride the momentum toward new highs in this evolving bullish trend.

Correlation between USDT.D and BTC.D
Hello, traders.
If you "Follow", you can always get new information quickly.
Have a nice day today.
-------------------------------------
(USDT.D 1M chart)
If USDT dominance is maintained below 4.97 or continues to decline, the coin market is likely to be on the rise.
The maximum decline is expected to be around 2.84-3.42.
-
(BTC.D 1M chart)
However, in order for the altcoin bull market to begin, BTC dominance is expected to fall below 55.01 and remain there or show a downward trend.
Therefore, we need to see if it falls below the 55.01-62.47 range.
The maximum rise range is expected to be around 73.63-77.07.
-
In summary of the above, since funds are currently concentrated in BTC, it is likely that BTC will show an upward trend, and altcoins are likely to show a sideways or downward trend as they fail to follow the rise of BTC.
The major bear market in the coin market is expected to begin in 2026.
For the basis, please refer to the explanation of the big picture below.
-
Thank you for reading to the end.
I hope you have a successful transaction.
--------------------------------------------------
- This is an explanation of the big picture.
(3-year bull market, 1-year bear market pattern)
I will explain more details when the bear market starts.
------------------------------------------------------

LRC, LOOPRING, HOW MANY LOOPRINGS DO YOU THINK SONIC COULD EAT?Something is going on with this coin on the technical side.
There is literally no downside target that I can see right now, so I just labeled in MASSIVE SUPPORT TREND.
It looks like it is really close to making a move to the upside.
Somewhere around .8
Then it will likely hit some resistance there, but has a lot of potential to keep building support and climbing.
This coin looks incredibly bullish right now.
Things can change fast and if they do it will likely be a break of this trend (green).
The run up can take it to .45 and maybe a little higher, but the buy the dip price looks to be around .245. which would then take price higher to over 1 and beyond.
I'm gonna go with 3684 looprings for sonic.
What even is a loopring?
I'll attach more crypto TA to this idea.
oh and don't follow the guideline, pay more attention to the trends and price zones.

BTC - Block Out The NoiseThere is a lot of talk going on surrounding all the markets and eveb BTC, of course.
I saw a tweet come across my feed that had a user claiming an incoming crash of BTC and I couldn't help myself in laughing a bit for seeing through and identifying that he really had no idea wtf is going on.
We are currently set to close the week above the consolidation box that BTC has produced and punched over. We are holding above the top of the box at about $104,450 for the third consecutive week. If we really were to crash or retest levels below, we'd first have to have a weekly candle close under $104,450 and then we could see cost basis, or the median, of the consolidation box retested at about $$99,000.
Long story short, because we are holding above the top of the box, I think we'll be more likely to continue consolidating on a lower time frame and trying to continue breaking new highs.
Most people have no idea what's going on and are just guessing. I am no different in that respect. I do use the potterbox strategy to help me sift through the noise and ultimately make sense of what price is doing relative to the structures it has created before. Per the PBS, we're okay and on a lower 24HR timeframe, we've actually done a great job in bouncing. For now, I don't see a meltdown coming. We simply retested a level and created empty space above us on a 24HR timeframe to, hopefully go back up. I'm hoping we see $120K this year and, maybe, with enough momentum we could really see a rally big enough to break this channel we are in.

ZEC CAN GO TO $100 TARGET Zec is able to get a confirmation in the coming time frames and to break to $100
Will this be the next break level as omisego did?
We will follow the trend.

Bearish reversal?The Bitcoin (BTC/USD) is rising towards the pivot and could reverse to the 1st support.
Pivot: 107,412.53
1st Support: 102,164.07
1st Resistance: 111,566.95
Risk Warning:
Trading Forex and CFDs carries a high level of risk to your capital and you should only trade with money you can afford to lose. Trading Forex and CFDs may not be suitable for all investors, so please ensure that you fully understand the risks involved and seek independent advice if necessary.
Disclaimer:
The above opinions given constitute general market commentary, and do not constitute the opinion or advice of IC Markets or any form of personal or investment advice.
Any opinions, news, research, analyses, prices, other information, or links to third-party sites contained on this website are provided on an "as-is" basis, are intended only to be informative, is not an advice nor a recommendation, nor research, or a record of our trading prices, or an offer of, or solicitation for a transaction in any financial instrument and thus should not be treated as such. The information provided does not involve any specific investment objectives, financial situation and needs of any specific person who may receive it. Please be aware, that past performance is not a reliable indicator of future performance and/or results. Past Performance or Forward-looking scenarios based upon the reasonable beliefs of the third-party provider are not a guarantee of future performance. Actual results may differ materially from those anticipated in forward-looking or past performance statements. IC Markets makes no representation or warranty and assumes no liability as to the accuracy or completeness of the information provided, nor any loss arising from any investment based on a recommendation, forecast or any information supplied by any third-party.

BRIEFING Week #22 : Still waiting for OilHere's your weekly update ! Brought to you each weekend with years of track-record history..
Don't forget to hit the like/follow button if you feel like this post deserves it ;)
That's the best way to support me and help pushing this content to other users.
Kindly,
Phil

$BTC 12-Week Lead Correlation w/ Global Liquidity, M2, GOLD, DXYHere’s a look at Bitcoin's price action against Global Liquidity, Global M2, GOLD and DXY - all with a 12-Week Lead.
Notice GOLD has a bit more of a deviation from the BTC price than the others.
This is because GOLD is used as a store of value asset, whereas the others are predicated on Central Banks expanding and contracting their money supply and balance sheets.
The key here is to smooth out the signal and ignore the noise.
Notice the convergence between these metrics the past couple months.

Bitcoin: Bear Flag Formation Implies Weakness.Bitcoin has retraced as anticipated in my previous article (see Wave 5). So much for all the nonsense hype at the Bitcoin conference. Bitcoin has tested the 103K area and found some support but is developing a mini bear flag (see arrow). IF the 103,500K level is broken, that confirms the corrective structure is still in play and a test of 102 to 100K can still be the dominant scenario for the coming week (NFP this week). This means for swing traders on this time frame, it is likely too early for longs.
The 102 to 100K area is still the major support that I anticipate. A long signal here can look like a pin bar on this time frame, or a double bottom formation on a 4h or 1h chart. It often pays to wait for these scenarios but there is always a risk of missing the move if price confirms a reversal pattern sooner.
IF the current candle closes much higher (above 106K) then it will invalidate the bear flag. This means the bullish continuation would be in play. In my opinion this is a lower probability, but you have to be open to it. In the bullish scenario a test of 110 to 112 servers as a profit objective. While a breakout beyond 112 can happen, the more you expect, the more RISK you must be exposed to. A test of high is more probable than a new high. Along with that, I suspect current price action is more likely to consolidate rather than continue high over the short term because 5 waves are clearly in place. That usually means a corrective structure is likely to follow, and that is what we are currently in.
The bullish candles are too early to buy into. If the bear flag plays out, there will be more attractive prices to wait for reversal formations. Otherwise, work smaller time frames, look for small bites going either way and keep the size small. This is not an easy environment.

CADJPY BULLISH OR BEARISH DETAILED ANALYSISCADJPY has successfully broken out of a well-defined falling wedge pattern, confirming a bullish reversal setup on the daily timeframe. Price action has not only cleared the descending trendline but has also completed a clean retest of the breakout zone near 104.000–104.500. This retest held firmly, showing strong buyer interest, and the pair is now poised for a continuation toward the next key resistance level around 110.000. The technical structure is now favoring bulls, with momentum shifting upward after a prolonged corrective phase.
Fundamentally, the Canadian dollar is gaining strength supported by rising crude oil prices and stronger-than-expected economic data from Canada. The Bank of Canada’s recent tone remains relatively hawkish compared to other central banks, which adds further support to CAD. Meanwhile, the Japanese yen continues to remain under pressure due to the Bank of Japan's ultra-loose monetary policy stance. With Japan’s inflation struggling to sustain above target, the BOJ is showing no urgency to tighten, which keeps JPY weak against higher-yielding currencies like CAD.
The breakout from the falling wedge is also being supported by volume and bullish daily candles, suggesting a solid shift in market sentiment. The pair has formed a higher low and higher high, officially transitioning into a bullish structure. With the retest of the breakout structure now complete, there’s a high probability for continuation toward 108.000 initially and a full extension to 110.000 in the coming weeks.
Traders should closely monitor any dips as potential buying opportunities as long as CADJPY holds above 103.500–104.000 support. The reward-to-risk ratio remains favorable for swing traders aiming for medium-term targets. With strong technical confirmation, supportive fundamentals, and risk appetite returning to markets, CADJPY is setting up for a potentially profitable bullish wave.

BTC eliot wave prediction
106,600$ → 100,300$ → 116,000$
The third extended wave of Bitcoin has completed, and it is now going through a correction phase.
Wave 4 corrections often retrace to the 0.382 Fibonacci level.
Therefore, a price drop to that level is expected — around $106,600.
This correction is unfolding as a W–X–Y pattern.
In wave W, the internal ABC subwaves completed with wave C reaching 1.618 times the length of wave A.
Currently, Bitcoin is in the rising phase of wave X.
No one knows how high wave X will go,
but what’s important is that after wave X finishes,
one more lower low is expected — again around $106,600.
At that price level, I plan to open a $2 billion long position with 10x leverage.

Bitcoin Wasn't Built for Bull Runs — It Was Built for This MomenDear traders,
You may be witnessing a “first” — a pivotal moment right before things begin to spiral.
We’re not fortune tellers. We don’t claim to predict the future.
But what you’re about to read is based entirely on **publicly available data**, interpreted not through speculation, but through a deep, rational analysis of interconnected facts — the kind of connections that most overlook, and few dare to question.
We may not know how the future is being orchestrated behind the scenes...
But one thing seems certain: **crisis always comes first...** and *then* we are given a **narrative** to justify it — be it war, a pandemic, or a "global emergency."
This is the correct sequence... and it’s the one they never teach you.
Yet for those of us who navigate the financial markets, one question matters more than all others:
**How do we profit from this?**
---
We recently shared an important setup on the **Nasdaq index**, the benchmark that reflects — to a large extent — the true state of the U.S. economy.
As a proxy for the 100 largest American corporations, the Nasdaq plays a critical role in signaling macro trends.
And while some are just now waking up to the storm ahead, **our outlook has been clear since October 2022**:
A major economic crisis was not only probable… it was **inevitable**.
Some analysts chalk this up to uncontrolled money printing post-2019 as governments tried to patch the damage from the COVID-19 crisis. That’s one explanation.
But at **Glich**, our vision is different.
More complex.
And for now… **not something we can fully release**.
---
For years, strong correlations between **risk markets** — especially U.S. equities and crypto — held firmly in place.
But something changed on **May 30th, 2025**. Completely and unmistakably.
The link was severed.
Now ask yourself:
**Why was Bitcoin created in the first place?**
It wasn’t just digital money.
It was a bold, revolutionary idea. A system designed for a future economy no longer shackled by inflation, central banking failures, or hidden agendas.
A fluid, transparent, and secure network for a world in desperate need of change.
The current financial model is obsolete. It’s no longer evolving — just surviving.
And it can no longer answer the challenges of what's to come.
**2008 was not the collapse; it was the setup.** A convenient pretext to slowly roll out something **new**.
And "Satoshi Nakamoto"? Well, let’s just say...
**That name means more than you think.**
_"HIDDEN INFORMATION"_ 👁️
---
What does NEO mean when he says:
> "This has all happened before… yet it’s happening for the first time"?
And what does that have to do with us?
This analysis is *not* just about charts or setups.
It’s a **hidden message** — a spotlight on a once-in-a-generation opportunity lying in plain sight.
But not everyone is trained to read between the lines.
---
Let us ask:
- Why was **Donald Trump** specifically pushed into position?
- Why is crypto — after being suppressed, banned and attacked worldwide — now being quietly **promoted** and fast-tracked in legislation during 2024 and 2025?
Something’s moving beneath the surface.
---
### 🔍 In summary:
- Expect a tidal wave of **global crypto legislation** to pass in the coming **days/weeks/months**.
- Crypto — particularly **BTC and ETH** — will become silent **stores of value** during the economic storm.
- Expect record-breaking levels: **$400K for Bitcoin**, **$40K for Ethereum**.
Yes, this may sound like science fiction…
But keep your eyes and ears wide open. 👁️
- And brace yourself for a **historic collapse** in U.S. equities. Possibly… something we’ve never seen before.
---
The show is starting.
And we won’t spoil the ending — because watching it unfold is part of the experience.
But here’s what we *can* say, thanks to our proprietary **algorithmic system**:
- The **U.S. economy will bleed**.
- And crypto will blow past expectations — fulfilling the very purpose it was built for.
---
🛒 Load your bags in the coming days...
Because when this train leaves the station —
It won't be stopping for anyone.

Bitcoin Wyckoff Distribution Complete – Markdown Phase Ahead?This chart is a technical analysis of **Bitcoin (BTC/USD)** on the **4-hour timeframe** from Binance, illustrating **Wyckoff Market Cycle Phases** applied to recent price action.
### 🧠 Chart Description:
The chart identifies and labels key **Wyckoff phases**:
* **Accumulation (April)**: Price consolidates in a range after a downtrend. This phase marks strong hands accumulating Bitcoin from weak hands.
* **Reaccumulation (late April to early May)**: A bullish continuation pattern where the price pauses temporarily before resuming the uptrend.
* **Distribution (mid-May)**: The price enters another consolidation phase, but this time smart money begins offloading holdings at elevated prices to retail traders.
### 📉 Projected Move:
* A breakdown below the current support is anticipated, leading to a **markdown phase**.
* The red path suggests a significant decline, potentially toward the **\$85,000–\$90,000 range**, indicating bearish momentum.
* After the markdown, **accumulation is expected to resume**, setting the stage for the next potential markup.
### 📊 Supporting Visual:
On the right side, there's a reference schematic titled **“Market Phases” by Readtheticker.com**, which summarizes:
* Accumulation → Markup → Distribution → Markdown → Accumulation cycle.
* It also highlights buying/selling pressure dynamics and behavioral patterns at each phase.
---

is WLD READY FOR NEW CYCLE to $4Worldcoin looks to have new data, which could mean a new cycle is on processing.
Low time frame focus target $1,70

Kava : Day trade volumeKava can show new volume on day trade volume. We will follow this coin in the coming time frames for the uptrend.

BTC (Daily) Elliot Wave 2 UnderwayBTC appears to have completed a motif wave (1) poking above all time high after printing a triangle for wave 4. Triangles are an ending pattern with a final thrust up afterwards typically breaking all time highs before reversing in wave 2, selling into retail FOMO.
Wave 2 has a $92k target at 0.5 Fibonacci retracement and high volume support node.
Wave 3 should be a powerful move up taking price way into all time high.
Safe trading

ETH/BTC vs btc dominanceethereum received a reaction as we expected from the current demand zone in the bitcoin pair, and it seems inevitable that the upward momentum from the current area will continue. on the bitcoin dominance side, the same situation exists, but I think we will witness a bearish absolute process.

BTCUSD - Bear Double Top ScenarioBitcoin is still above the ascending trend line in green however price is looking to form a next high reaching new ATH's
This could lead to resistance at the next top creating a double top, pushing price back down to the ascending trend line. From there if this strong trend line in green breaks it could turn very bearish below that line.
4Hr chart

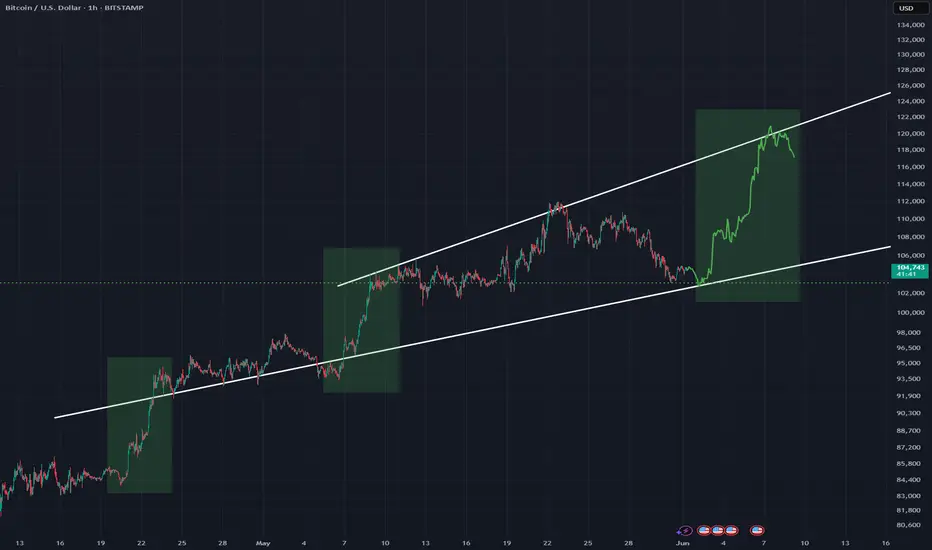
Bullish View #BTC Looking for a third strong wave up within this expanding pattern as price hits support in white
Moves up in green rectangles are similar
Hourly timeframe with the horizontal dotted line as a strong support line