SUSDT - 1WThe previous bullish analysis failed and I currently expect a correction to the range of 0.3 to 0.33 cents...
Btc!

BTC fire saleBTC rolling over, however market structure on higher timeframes doesn't suggest continuation yet. Momentum and trend oscillators are in a slump until they get oversold.
Full TA: Link in the BIO

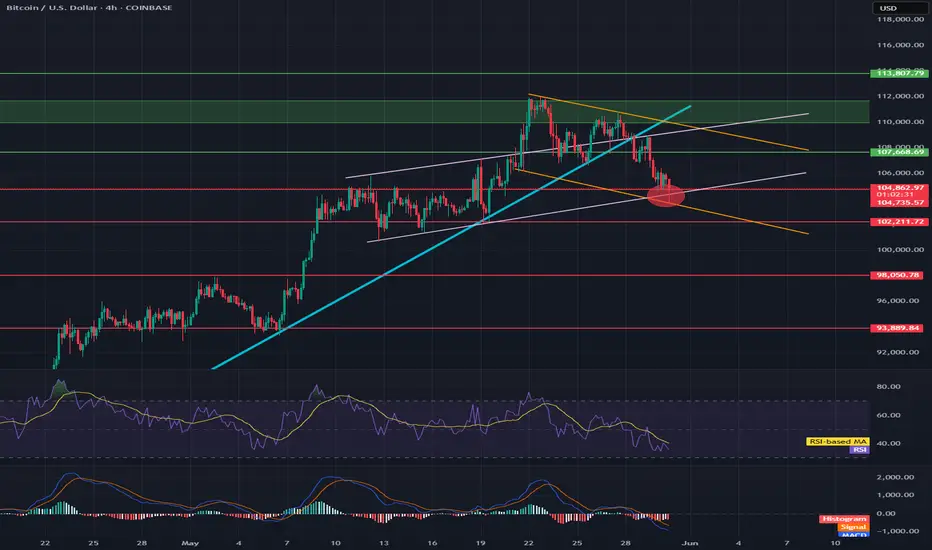
Will BTC hold its price?Hello everyone, I invite you to review the current situation on BTC. When we enter the four-hour interval, we can see how the BTC price has left the ongoing upward trend line at the bottom, and what's more, we can see how the current movement is creating a local downward trend channel in which the price is currently on the border of the previously created upward trend channel, which gives a strong support point.
Here we can see how the current downward movement has entered the support circle that starts around $ 104,800 and ends around $ 102,200, this is the place where two conflicting channels have converged. If these supports do not hold the price, we can see a quick recovery to around $ 98,000, and then to the level of $ 93,900.
Looking the other way, we can see that when the trend reverses, we first have resistance at $107,670, then a resistance zone from $110,000 to $111,700 is visible, at the border of two channels, and then resistance is visible around $113,800.
On the MACD indicator, we can see a return to the downtrend, while on the RSI we return to the lower part at the lower border, which could potentially provide energy for a future upward movement.
BTCUSD: Neutral on 1D means buy opportunity during rallies.Bitcoin has turned neutral on its 1D technical outlook (RSI = 51.351, MACD = 2908.600, ADX = 27.535) which is far from alarming as during Bull Cycle rallies such pullbacks are buy opportunities. Especially now that the price is even supported by the 1D MA50, which having cross above the 1D MA200 last week, they formed a Golden Cross. The pattern is identical to the last 1D Golden Cross, steady rally phases supported by HL trendlines that rose by roughly the same percentage. Their 1D RSI sequences also display similar formations. For that reason, we remain bullish on Bitcoin despite the current correction, targeting short term 119,000.
## If you like our free content follow our profile to get more daily ideas. ##
## Comments and likes are greatly appreciated. ##

Render – Re-Entry Opportunity After Hitting First TargetRENDER hit the first take profit target (TP1) with a ~52% gain — great execution. Now, after the expected pullback, price is approaching a key support zone, offering a second swing trade opportunity.
🔹 Entry Zone:
Around $4.00 support
🔁 Previous resistance turned support
🧭 Psychological level and structural base
🎯 Take Profit Targets:
🥇 $4.80 (recent local high / resistance)
🥈 $5.40 (next significant supply zone)
🛑 Stop Loss:
$3.69 (below key support & invalidation level)

Bitcoin Short-Term, Aims Below $100,000 (Alert!)Good morning my fellow Cryptocurrency trader, overall, the market looks great.
The market looks great but never forget that nothing is set in stone, market conditions can always change.
Let's consider Bitcoin for once on the short-term timeframe.
The long-term timeframes are good to spot the bigger cycle; the smaller timeframes are good to know what will happen next.
— Bitcoin 4H TF (Short-term)
Bitcoin hit a new all-time high and was followed by a strong bearish volume session. The action went on to move below a strong resistance zone, the ath range.
Now Bitcoin is trading below "local resistance" and this opens up a bearish bias short-term. When it moves back above $110,000, we can say the bulls are back in. When it trades below $106,000, we can say bearish confirmed.
Here we can see Bitcoin bearish while aiming lower.
If it continues dropping, 100K won't be the end. Either it recovers now, or else we will see a test of the low 90Ks.
Leave a comment if you agree.
Follow if you disagree.
Thank you for reading.
Namaste.

TRBUSDT Forming classical Bullish BreakoutTRBUSDT has recently broken out of a long accumulation zone, forming a classic bullish breakout structure on the daily chart. The asset saw a significant surge from the key support zone between $28 to $32, which has now been confirmed as a strong demand area. The breakout was backed by a sharp spike in volume, indicating strong buyer conviction and institutional interest entering the market. This breakout marks a pivotal shift in momentum and suggests that the bulls are in full control.
The technical setup points to a potential rally of 100% to 130%, targeting levels around the $75 mark and beyond. The previous resistance zones have been decisively cleared, and the strong green candles hint at the possibility of a sustained uptrend. If the asset holds above the breakout level and continues to consolidate at higher levels, it could build a strong base for the next impulsive move. This kind of vertical price action is often seen in assets with growing investor demand and limited supply pressure.
Investor interest in TRB is noticeably rising, as reflected in the increased social media chatter, positive sentiment across crypto forums, and higher engagement on trading platforms. The coin is benefiting from renewed market confidence and strong fundamentals. With macro tailwinds in the crypto market and a technically sound chart, TRB appears poised to outperform in the coming weeks.
Traders should closely monitor the price action around $50–$52 for potential retest opportunities. A successful retest followed by bullish continuation could offer a high-risk/reward long setup. The projected upside remains highly favorable, supported by robust volume and clean technical structure.
✅ Show your support by hitting the like button and
✅ Leaving a comment below! (What is You opinion about this Coin)
Your feedback and engagement keep me inspired to share more insightful market analysis with you!

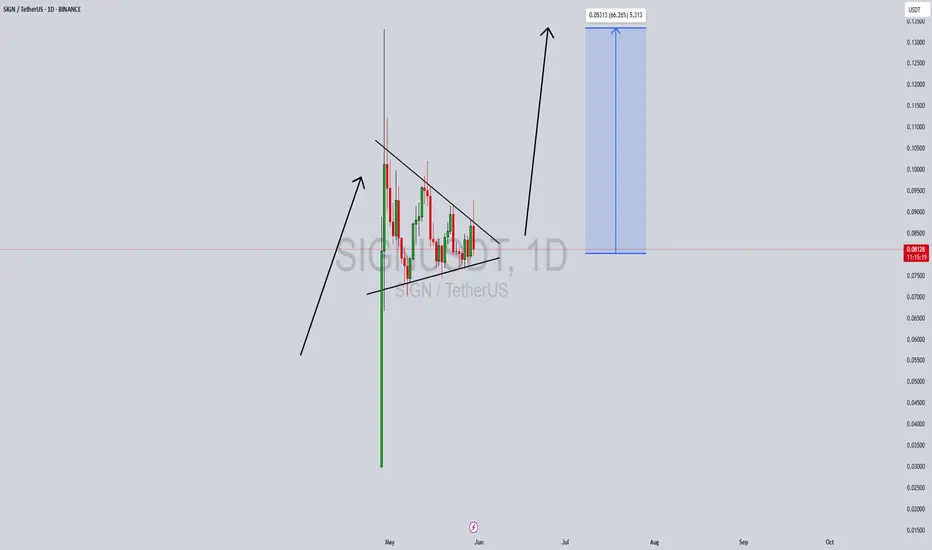
SIGNUSDT Forming Bullish Pennant SIGNUSDT is currently exhibiting a strong bullish pennant pattern on the daily timeframe—a continuation setup that often precedes substantial upward movement. Following an aggressive price surge, the pair has entered a brief consolidation phase within converging trendlines, suggesting that bulls are simply regrouping for the next leg higher. This is typically a bullish signal, especially when paired with increasing volume and positive sentiment surrounding the project.
The volume has remained healthy during the pennant formation, indicating sustained interest and participation from investors. With a clean technical structure and no major overhead resistance in the immediate zone, SIGN has positioned itself for a breakout move. Based on the height of the flagpole and the pattern formation, a price surge of 40% to 50% is anticipated, with targets aligning near the $0.13 zone. Such a move would mirror the breakout potential we’ve seen in similar setups across the altcoin market.
From a sentiment perspective, market participants have shown growing confidence in the SIGN project. Social mentions, trading volume, and overall engagement metrics are on the rise. This kind of grassroots enthusiasm often precedes strong rallies, and with Bitcoin and Ethereum holding steady, the stage may be set for altcoins like SIGN to shine. Technically and fundamentally, the alignment for an upward push appears to be falling into place.
Traders should watch for a clean breakout with volume confirmation above the resistance trendline. A decisive candle close above the pennant could act as a strong bullish catalyst. Risk management is key, but the risk-reward profile currently leans heavily in favor of the bulls.
✅ Show your support by hitting the like button and
✅ Leaving a comment below! (What is You opinion about this Coin)
Your feedback and engagement keep me inspired to share more insightful market analysis with you!
ORCAUSDT Forming Symmetrical Triangle ORCAUSDT is currently forming a symmetrical triangle pattern on the daily chart, a technical setup that often signals strong breakout potential. This type of consolidation pattern typically indicates a period of indecision that could lead to a significant price move once a breakout occurs. With ORCA trading at the apex of the triangle and volume gradually increasing, a bullish breakout looks increasingly probable in the near term.
The volume profile supports the idea of a coming rally, as we see accumulation within the pattern and recent volume spikes suggesting renewed investor interest. ORCA’s fundamentals and recent market developments are also attracting attention from both retail and institutional players. If the upper trendline of the triangle is broken convincingly, we could expect a 40% to 50% upward surge, potentially reaching near the $4.50 zone.
Technical traders are watching closely, especially with broader market sentiment improving across altcoins. ORCA’s formation of higher lows within the triangle adds confidence to the bullish thesis. The symmetry of the pattern and breakout projection aligns with historical moves in similar market conditions, reinforcing the anticipated gain targets.
Given its current technical posture, ORCAUSDT presents a high-reward setup. A confirmed breakout could trigger momentum buying, driving price rapidly toward the target. Stay vigilant and watch for confirmation signals like increasing volume and a strong close above resistance.
✅ Show your support by hitting the like button and
✅ Leaving a comment below! (What is You opinion about this Coin)
Your feedback and engagement keep me inspired to share more insightful market analysis with you!

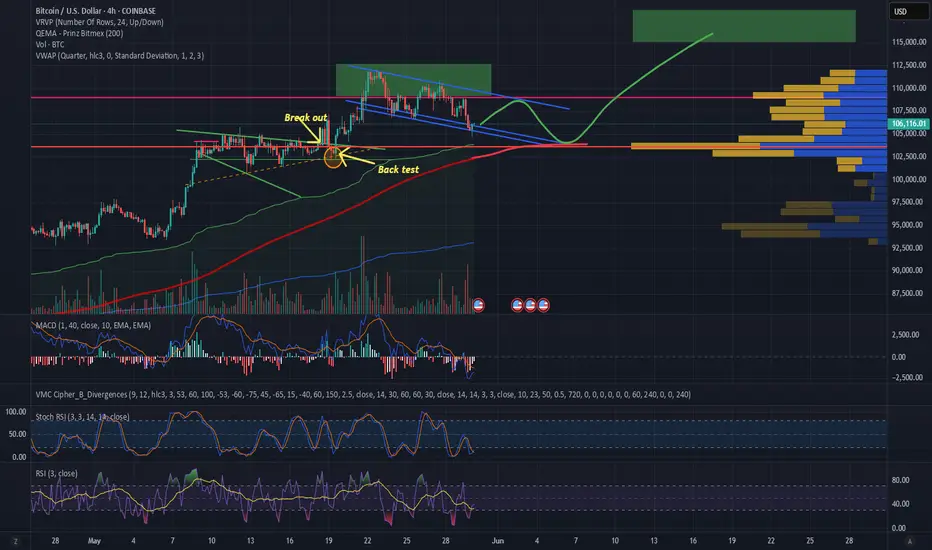
Bitcoin Strong-Bullish Above 102000, Remember The Bigger PictureWe've defined $102,000 as the strongest support level ever based on the long-term. This number was extracted using the 2021-2022 bear market. It is mapped which a red dotted line on the chart.
On this chart you can see how this level worked as resistance in December 2024 and January 2025, later to become the strongest support ever now, in May 2025. Bitcoin is 100% bullish as it trades above $102,000.
» I should say super-bullish, hyper-bullish, ultra-bullish, etc.
Right now Bitcoin is safe and sound when considering the bigger picture.
The Altcoins market is also safe and we can continue to accumulate; Buy and hold.
If you have any questions do not hesitate to leave a comment.
Please keep in mind that market conditions can always change. In a day without notice.
Thanks a lot for your continued support, it is truly appreciated.
Namaste.

SHORT Bitcoin 10X Lev. Full PREMIUM Trade-Numbers (PP: 175.6%)For experts only. This is not for beginners.
Leveraged trading is ultra-high risk and it is even harder when it comes to shorting.
This is not medical advice. This is not spiritual advice.
This is definitely not financial advice. This is just a chart and some numbers.
How you decide to use these numbers is completely up to you.
I am wishing you tons of luck and success; profits 100%.
This is a strong chart setup. It looks great.
_____
SHORT BTCUSDT
Leverage: 10X
Entry levels:
1) $111,111
2) $109,255
3) $108,000
4) $107,000
Targets:
1) $103,149
2) $101,012
3) $98,790
4) $94.239
5) $89,999
11) $88,888
Stop-loss:
Close weekly above $115,000
Potential profits: 175%
Capital allocation: 4%
_____
Thank you for reading.
If you enjoy the content make sure to follow.
(Leave a comment with your toughts.)
Namaste.

XRP will start to outperform BTC in coming weeks.XRP will start to outperform BTC in coming weeks.
We have a golden cross on weekly timeframe and is reaching big support around 2000 sats also we had a nice reset on rsi levels between January and now.
On the montly timeframe we had nearly 6 months of consolidation. The next move will be a super explosive possibly a new all time high between xrp/btc.

GBPUSD BULLISH OR BEARISH DETAILED ANALYSIS ??GBPUSD has successfully completed its retest of the 1.34300–1.34500 support zone and is now showing strong signs of resuming its bullish momentum. The recent structure confirms a classic bullish continuation pattern, as price bounced cleanly off a critical support level that previously acted as resistance. This level has now flipped into a solid demand zone, giving buyers confidence to push toward the 1.40000 psychological target. Price action continues to respect the uptrend with higher lows forming since mid-April, suggesting strength and institutional accumulation.
From a macroeconomic perspective, the British pound remains fundamentally supported. Recent UK inflation data surprised to the upside, causing the market to delay rate cut expectations from the Bank of England. In contrast, the US dollar is weakening due to rising expectations that the Federal Reserve could initiate rate cuts later this year as inflation cools and labor market data softens. This divergence in policy outlooks between the BoE and the Fed is fueling bullish pressure on GBPUSD, making the 1.40000 level a realistic and high-probability target.
Technical confluence also supports this bullish wave. Fibonacci retracement levels drawn from the recent swing low to the high align closely with the support zone at 1.34300, which acted as a perfect retest before the next leg higher. Additionally, the bullish engulfing candles and consistent daily closes above the support level add further confirmation to the upside bias. As long as the pair holds above 1.34300, the structure favors bulls with strong momentum to test and potentially break the 1.38000 intermediate level on the way to 1.40000.
GBPUSD remains a high-confidence bullish opportunity, aligning both technically and fundamentally. The recent breakout and retest phase is complete, and the pair now appears poised for a sustained rally. With bullish market sentiment, favorable UK data, and USD softness across the board, this setup offers an excellent risk-to-reward ratio for medium-term swing traders targeting the 1.40000 zone.

Bitcoin is bearish | stay cautious (1H)This analysis is an update of the analysis you see in the "Related publications" section
We have been warning about a potential Bitcoin correction for some time. It appears that wave G has ended, and key levels have been lost. If the price reaches the red box, it is expected to be rejected downward.
The green zone is a relatively strong support area for Bitcoin, and we should closely watch this level.
A daily candle closing above the invalidation level would invalidate this analysis.
For risk management, please don't forget stop loss and capital management
Comment if you have any questions
Thank You

HelenP. I Bitcoin can start to grow from support zone in rangeHi folks today I'm prepared for you Bitcoin analytics. Observing this chart, we can see how the price rebounded from the support zone, which coincided with support level 2, and fell to the trend line. After this moment, BTC started to grow near this line and soon broke support 2. Then it made a correction below the trend line, but soon turned back and continued to grow. Later, Bitcoin reached support 1, which coincided with the support zone too and then some time traded in this area. Price traded between the support area and the trend line, and later finally broke support 1 and entered into a consolidation. In this pattern, BTC rose to the top part of the range and then made a correction to the trend line at once. Soon, Bitcoin broke this line and continued to fall, and at the moment it traded near support 1, which is the bottom part of the consolidation as well. So, I expect that BTCUSDT will correct to the support area and then start to grow. For this case, I set my goal at 109000 points. If you like my analytics you may support me with your like/comment ❤️

$BTC $104K TO $121K
Bitcoin's retreat to the $104k major support will be welcomed as a healthy bit correction, and I think the target will be $121k unless closures below this level are seen.

BTCUSDT on daily support, likely to head to 109kWe have the price revisiting the daily support DS1.
This presents a long opportunity for us.
The price is likely to find support in this zone and bounce from here.
The target of this long trade shall be the daily resistance DR1 marked on the chart. This resistance zone DR1 sits around 109k area.
In case the price reaches there, it is likely to experience some pullback there.
We will reevaluate the price action on DR1 once it reaches there and decide about the next steps.
What do you think about BTC price and this trade setup presented? Share it with me in the comments.

BITCOIN targets 165k based on VIX's 10-year SupportBitcoin (BTCUSD) has started a new (and possibly last for this Cycle) Bullish Leg following April's bottom and has already made a new All Time High (ATH).
The BTC/VIX ratio on that very same day (April 07 2025) hit and rebounded on its 10-year Higher Lows trend-line, a Support level that has been holding since the August 24 2015 market bottom.
Every rebound on this Higher Lows trend-line, has produced a strong medium-term rally, the 'weakest' of which has been the most recent (August - December 2024), which rose by +121.44%. If BTC repeats this 'minimum', we are looking at a $165000 High, which aligns perfectly with the majority of projections for this Cycle's Top.
Do you think we will see that price by October? Feel free to let us know in the comments section below!
-------------------------------------------------------------------------------
** Please LIKE 👍, FOLLOW ✅, SHARE 🙌 and COMMENT ✍ if you enjoy this idea! Also share your ideas and charts in the comments section below! This is best way to keep it relevant, support us, keep the content here free and allow the idea to reach as many people as possible. **
-------------------------------------------------------------------------------
💸💸💸💸💸💸
👇 👇 👇 👇 👇 👇

Bitcoin Sideways Then UpI think we will go sideways and then bounce off the 4hr 200ma as we run up to higher prices, thus continuing the pursuit of price discovery towards $115k-120K +/-. Not financial advice. DYOR.
Bitcoin (BTC/USDT) – Daily Chart Analysis. Bitcoin (BTC/USDT) – Daily Chart Analysis
Bitcoin has tested the overhead resistance and is currently retracing towards the $104k–$105k support area.
Moving Average (MA 25):
The price is slightly above the moving average, indicating that the medium-term trend is still bullish but faces resistance.
Pattern Formation:
There is a clear breakout from the inverted “V” pattern, and now the price appears to be retesting the breakout zone.
Scenario:
If BTC maintains support at ~$105k and bounces off again, a potential push towards $112k—$115k can be seen.
If the support fails, a deeper pullback towards $100k or below could occur.
Thanks for your support!
DYOR. NFA

$BTC Trend Broken - $102k NextThe trend has broken.
₿itcoin respects thy squigglets 🤓
$102k CRYPTOCAP:BTC here we come 🥸
If that doesn't hold, the 200DMA prophecy ~$95k will be fulfilled 🥲

Bitcoin Weekly, Why $20,000 Is Not Necessary!After closing 7 consecutive weeks green, Bitcoin turned red for the first time. Is this situation bullish or bearish? Will Bitcoin test $20,000 as support before hitting $200,000? Boost & follow to continue reading below.
The fact that Bitcoin found resistance is a non-event. After a very strong rise with 50% growth, it is normal to see a retrace or correction, it is as normal as it gets. Think back to August 2024. Bitcoin crashed and started to recover. The recovery didn't produce one long single up-wave, after some bullish action there was a retrace, this retrace ended in a higher low followed by additional growth. Exactly what I told you would happen if a drop develops. Yes, prices move lower but always end in a higher low. The higher low means that the bullish structure remains intact. An intact bullish structure means that market conditions do not change. This is only negative for those that bought at the top, short-term traders and over-leveraged traders, and those without a plan.
The rest of the market is sound and safe and will continue to profit long-term. Now, how far down will Bitcoin go? Will support be found around $100,000, $90,000, $80,000 or $76,000?
Remember, even if Bitcoin hits $76,000 on a flash crash this is still a higher low compared to $74,500 and thus bullish. We are bullish long-term. So, regardless of the short-term, noise, Bitcoin will continue to grow.
Prepare for the crash.
Buy and hold.
Namaste.

Bearish Bitcoin Confirmed —$20,000 Is Not Possible, Much Higher!After a lower high, Bitcoin is now on three days red. There is nothing bullish about this chart setup.
Think of it this way: Would you trust me to buy Bitcoin when it was trading below 80K? Now, Bitcoin moves from a low point of $74,500 to a high of $112,000 in less than two months. Isn't it normal for the market to look for some relief, a retrace or correction?
Please, do not be offended by me sharing a simple chart, reading a chart. It is very normal and I always mention that the market never moves straight down, nor straight up. Bitcoin doesn't need to crash, but after a rise of 50%, I wouldn't be surprising to see the development of a higher low.
If you are going crazy right now, maybe you didn't do your homework but it is definitely not my fault. The market moves up and down, up and down... It was going up, now, down we go.
Adapt to market conditions rather than fight.
If you are fighting, then you are not prepared.
If you have to write insults in the comments section, then it means you are not doing your homework.
It is your money. Be smart.
Don't be stupid.
You can do this.
P.S. If you can easily see the market fluctuating and this type of post doesn't create a mental breakdown, then all is good. You are great and you will continue to enjoy huge profits in this 2025 bull market.
Prepare for the crash.
Namaste.
