BTC Trap & Reverse: The Power of SFPs in ActionBTC continues to chop in a tight range near its previous all-time high. While price action may appear messy at first glance, traders using a combination of structure, Fibonacci levels, and order flow tools are spotting clean opportunities — especially through Swing Failure Patterns (SFPs).
🔍 What Just Happened?
Bitcoin recently rejected from the 0.786 Fibonacci retracement level — a classic reaction zone. What made this move powerful was the SFP that formed at that level. Price swept above a prior high, triggering breakout buys, only to reverse. This type of move traps late longs and offers an ideal short entry.
🧠 Educational Insight: Why SFPs Are One of the Best Setups
SFPs (Swing Failure Patterns) are some of the highest-probability trades you can take for a few key reasons:
1️⃣ Liquidity-driven: They form where stop losses cluster — above highs or below lows — creating a magnet for price.
2️⃣ Clean invalidation: The wick high/low gives a natural stop-loss level, keeping risk tight.
3️⃣ Fast reaction: Once trapped traders are forced to exit, price often reverses sharply — giving you strong follow-through.
4️⃣ Confirmable with order flow: Using tools like Exocharts, you can see aggressive longs/shorts piling in just before the reversal. This adds conviction to the setup.
📏 Current Confluence:
Rejection from the 0.786 Fib retracement
SFP confirmed on high volume
1:1 trend-based Fib extension sits at ~$105,410
That level also lines up with the 0.666 Fib retracement
Anchored VWAP around $105K
Liquidity pool right at that zone too — a likely magnet
🎯 Trade Idea:
Short triggered at the SFP wick, stop just above it. First target: the 1:1 extension near $105.4K. Risk-reward is excellent with high probability if price continues to unwind late longs.
✅ Key Takeaway:
In ranges like this, you don’t need to guess direction — you need to react to structure. SFPs give you that edge. When paired with real-time tools like Exocharts and anchored VWAPs, these trades become sniper entries rather than coin flips.
Let the market show its hand — and trade the reaction, not the prediction.
📌 Summary:
This is how you avoid overtrading in chop: wait for key levels, watch how price reacts, and let trapped traders create the move. If BTC revisits the $105K region, it’s a major area to watch for reaction — or to take partials if you’re in a short.
The best trades come from patience + precision.
_________________________________
If you found this helpful, leave a like and comment below! Got requests for the next technical analysis? Let me know.
Btc!

Bitcoin is Nearing a Key Support Level!!!Hey Traders, in today's trading session we are monitoring BTCUSDT for a buying opportunity around 107,000 zone, Bitcoin is trading in an uptrend and currently is in a correction phase in which it is approaching the trend at 107,000 support and resistance area.
Trade safe, Joe.

Fireworks after the summerBitcoin to climax in Aug/Sep 2025.
The charts are a little skewed because of depreciating dollar. There is no new ATH on the BTCEUR and BTCGBP charts. Don't get fooled by this range-bound move.
Let's try this.

Bitcoin Is Crashing! Sell Everything? Panic! What To Do?It is true that a strong correction can push Bitcoin below $90,000 or even a test of $80,000 or $82,000, the question is this, is this the big correction or is this just a small retrace? Should I panic take-profits sell everything now or...
Good afternoon my fellow Cryptocurrency trader, you have great questions and these questions are very relevant if you are trading based on the short-term term. Continue reading, boost and follow for great information. Stay up-to-date.
Resistance has been confirmed and Bitcoin is moving lower now. There is a lower high and the continuation of the bearish move. How far down can it go?
Anything is possible as always. Just as Bitcoin can grow strongly non-stop, it can also correct (move lower) without a pause and produce a full market flush. A flush mean liquidation for all traders that have too much leverage or bought late.
If you bought around $78,800 or $85,000, you are safe. If you bought higher, you need to worry and act fast because market conditions are about to change.
What one does the rest follows?
Bitcoin is just one project and the bigger cycle is king but a strategy is needed for situations like this. A cryptocurrency trading plan needs to be developed before buying. Preparing for all scenarios should be done before. Sell at resistance (now!), buy at support (later).
The market can crash and it will move lower going down fast and strong but the Altcoins remain the same. Conditions on Altcoins all good nothing changes let Bitcoin do a normal retrace, nothing to worry about but those who don't read will get REKT.
So, buy and hold. Continue to accumulate. We are in this long-term.
Yes, Bitcoin will drop but this is nothing more than a retrace.
Panic or no panic, some people will sell everything and that's a mistake.
Always do the math beforehand and avoid future mistakes.
If you have any questions, leave a comment.
It is going down but for how long?
How far down will it go?
The numbers are clearly shown on the chart.
We will continue to buy Altcoins.
Bitcoin—and everything else—is going up!
Namaste.

BTC Short analysis + GRID Bot Scalper Strategy for BTC FuturesHELLO DEAR TRADERS,
If you're reading this right now, consider yourself one of the lucky few. You're gaining access to insights that, until now, have remained exclusive — reserved for a very small circle of insiders and influencers.
For a long time, we've hesitated to step into the spotlight and reveal the deeper truth behind the movements of financial markets. But everything comes in due time… and that time is getting closer.
Have you ever wondered how figures like Trump or Elon Musk always seem to bet on the right horse?
Many believe they're the ones moving the markets — but that’s far from the truth.
The real secret?
Their teams have access to advanced tools and knowledge — the right kind of science — to analyze the markets in ways most people can’t even imagine.
We won't go into too much detail here — some information is too powerful (and risky) to be shared publicly. But remember this:
"Trading is a game. And if you know the rules, you always play to win."
Starting today, we’ll be introducing a completely new vision of how to trade the financial markets — or any asset whose price is reflected on a chart.
Get ready to see the markets like never before. 🔥
Scalping Made Simple: The Power of GRID Bots
If you're serious about scalping the markets, one of the most effective tools at your disposal is the GRID trading bot. When properly configured, it can deliver consistent, automated profits by executing micro-trades around the clock.
Let’s be real:
Sitting in front of charts all day, hunting for the perfect sniper entry, is not just exhausting — it’s inefficient.
Why not let automation do the heavy lifting while you focus on strategy?
________________________________________
⚙️ AUTO SCALPER MODE: ON (SHORT TERM BOT
Here are the optimal parameters to configure your GRID BOT on Binance for effective scalping:
🔧 Recommended Settings:
o Trading Pair: BTC/USDTP (futures GRID)
o Mode: Grid Trading (long)
o Price Range: 105000 – 112000 USDT
o Current leverage : x18
o Number of Grids: 22-25 levels
o Order Size: Depends on your capital)
o Profit Mode: Arithmetic
o Margin mode : isolated
o Trailing up : Disabled
o Take-Profit: 112000
o Stop-Loss: 104000
o Open a position on creation : Disabled
o Close all position on stop: Enabled
o Close all positions on TP/SL stops: Enabled
📌 Notes :
⚠️The settings listed aboce have been meticulously calculated using precise algorithmic models. Every parameter serves a purpose — and even the slightest deviation can significantly impact performance, potentially leading to capital loss.
⚠️Do not judge the bot’s performance based on its real-time PNL. The true profit is only realized once the bot reaches its target and closes all active orders.
⚠️These bots are designed with high-level precision, offering a powerful edge when configured and used correctly.
✋ Manual Entries (For Experienced Traders)
If you're a more advanced trader, you can combine the GRID bot with manual entries based on:
o Buy orders listed on the chart
o You can enter a buy position at any price within the defined range on the chart — as long as the price does not break above the upper boundary of that range
o Using leverage is possible, but only under one condition:
-Your stop-loss and liquidation price must always remain below the highest protected low or in the SL area
o Your stop loss should always be bellow the highest protected Low
🔍 Disclaimer: This is our personal analysis and not financial advice. Always do your own research before making any investment decisions.
💬 What’s your take on this? Drop your thoughts in the comments and feel free to share this with your friends! ❤️

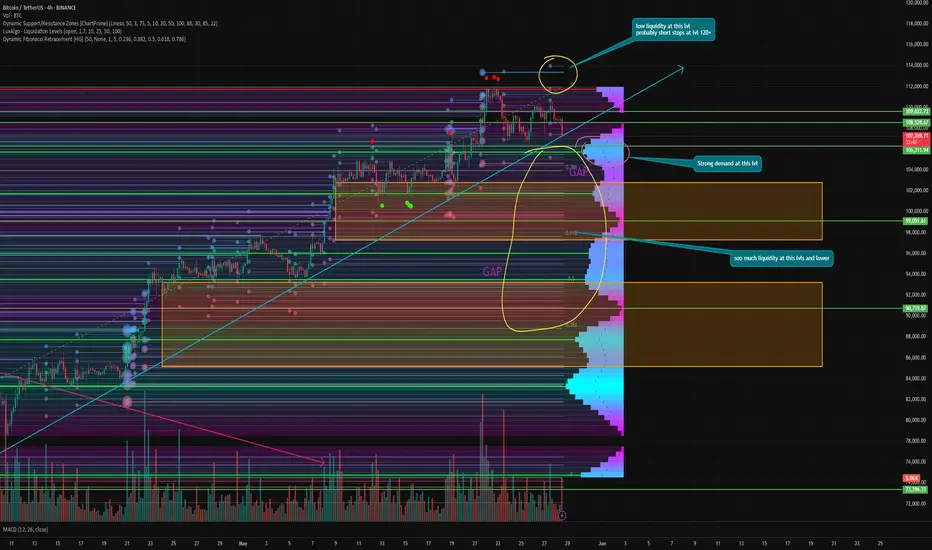
Is the momentum in Bitcoin EXHAUSTED? Or not yet?In recent days, Bitcoin has been actively updating its ATH almost daily. Everyone is already predicting $150,000 by the end of the month.
🔥 But is everything really so rosy? Let's take a closer look!
During the powerful growth over the past month, two gaps have formed below us. The first is at $97,368–102,867. The second is at $85,158–93,232. And as we know, in 99% of cases, gaps close sooner or later.
📊 Technical:
Liquidity zones - as we know, the price moves from liquidity to liquidity, which pushes it in one direction or another. Right now, there is practically no liquidity above us; it is all concentrated below. Only a move to $99,000 can now liquidate more than a billion dollars in longs.
I think short sellers' stops are much higher, at $120,000 and above. There is no point in placing them here when there is still no confirmation of a trend reversal.
⚙️ Metrics and indicators:
Volume - as I say in every review - is not a new growth impulse. It is a technical rebound. It has been moving at reduced volumes all along, which have only continued to decline.
MACD - has already given a bearish crossover , but this is certainly not the best indicator on such a TF. However, in combination with other indicators, it can predict a trend reversal at the right time.
DSRZ - shows the volume of interest at certain levels, and now we see that the first block of interest is concentrated in the $106,000–104,000 zone. These are the first support levels, from which I will expect the first rebound if the correction continues.
Liquidation Levels - as I said, all liquidity is now concentrated at the bottom. Bitcoin is very overheated and it's time to cool it down. Many think that it will be overheated when, as in the previous cycle, funding will be 0.2 and above.
But this is a different cycle, a different time, different traders, and different rules. This has already been proven more than once in this cycle.
📌 Conclusion:
I have said many times that we should not expect much from this momentum and that it is purely a technical rebound. And if something does not push us sharply upward now to bring in retail, we can definitely not expect it before the fall.
Summer is coming, investors and traders will close their positions and go on vacation. The market will be quiet.
So, personally, I am leaning back in my chair, expecting a price of at least $85,000, and watching what happens next. 🥃
BTC (Y25.P2.E5).My levels of interest to LongHi Traders,
Much confluence to long in the 105k range.
The chart is self explanatory.
This is not stating to SHORT. Its stating that if price meets our conditions, then this is an ideal level to long.
FYI. We have much bearish divergence as the longs entered and it gave the whales reason to push it down.
Question is how low is enough. Hence why I have some levels and it could be the case the whales could front run 105k
All the best,
S.SAri

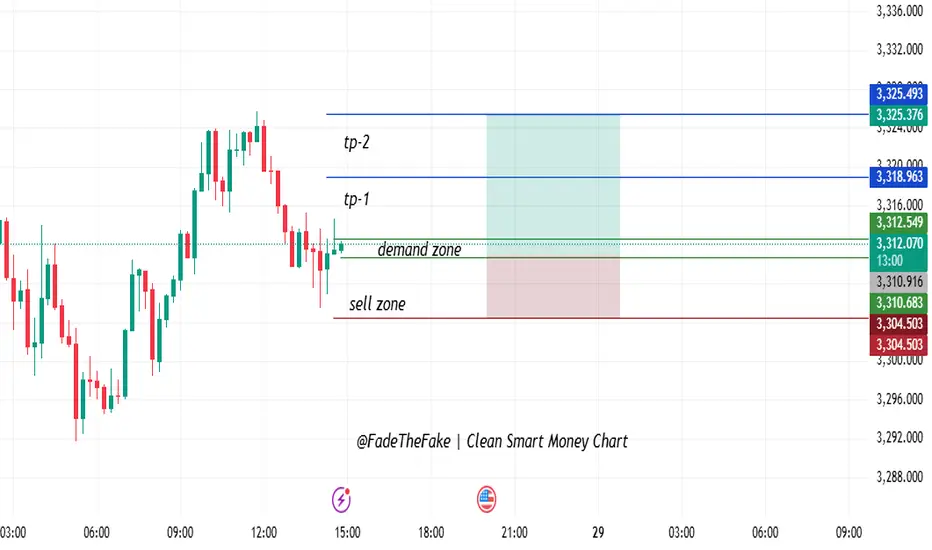
Smart Money Entry Triggered – TP1 & TP2 in SightPrice broke a clean demand zone, which was previously respected as a reaction level, and indicated signs of accumulation. Following a corrective pullback, the buyers returned — consistent with higher time frame bullish structure.
???? Important Zones:
Demand Zone: 3,312 – 3,310 → Smart money re-entry area of interest
Sell Zone: 3,310 – 3,304 → Invalid if price breaks and closes below
TP-1: 3,318 → First liquidity zone
TP-2: 3,325 → Breakout continuation target
???? Bias:
Bullish as long as price remains above the demand zone.
Invalidation if price closes firmly below 3,304.
???? Strategy Summary:
Entry: 3,312 (within demand zone)
SL: 3,304.50 (below structure & sell zone)
TP1: 3,318
TP2: 3,325
This is a clean smart money chart with obvious risk-to-reward logic. If you benefited from it, leave your view in the comments!
NZDCHF BULLISH OR BEARISH DETAILED ANALYSIS ??NZDCHF is currently consolidating in a textbook bullish flag pattern after a sharp recovery from the recent lows near 0.4680. Price action is compressing just below a key supply zone around 0.4950–0.4980, signaling a potential breakout setup as momentum builds. This flag is forming after a clear impulse move, and with the structure respecting higher lows, I’m preparing for a bullish continuation toward the 0.5100–0.5150 target zone.
Fundamentally, the New Zealand dollar is gaining strength supported by the RBNZ's firm hold on tight monetary policy, as inflation remains sticky in services and housing. Governor Orr’s latest comments reaffirmed that the central bank is not ready to pivot until they see a clear disinflationary trend. On the other hand, the Swiss franc is showing signs of weakness, as the SNB remains one of the most dovish central banks in the G10 space, with real interest rates still negative and inflation pressures easing significantly.
Technically, we’re in a bullish structure with key demand holding strong at the 0.4840–0.4860 range. Price is now coiling just under resistance, and a clean breakout above the 0.4950 level could ignite the next impulsive leg toward 0.5100. If the breakout confirms with increased volume and market sentiment aligns, this setup presents a high probability long opportunity with a favorable R\:R.
NZDCHF remains on my radar as a breakout trade backed by both technical structure and macro fundamentals. With capital flows favoring the Kiwi and risk appetite rotating back into higher-yielding currencies, this pair offers a solid bullish continuation setup for the coming weeks. Stay patient, let the breakout confirm, and ride the momentum higher.

NZDCAD BULLISH OR BEARISH DETAILED ANALYSIS ??NZDCAD is currently coiling within a textbook bullish flag formation after an aggressive impulsive leg to the upside. Price action remains tight inside this consolidation structure, respecting both trendline resistance and support. As we approach the apex of this flag, I’m closely watching for a breakout confirmation to trigger the next bullish continuation leg toward the 0.8600 target.
From a macro perspective, the New Zealand dollar is gaining strength following the RBNZ’s firm stance on keeping rates elevated due to persistent inflation risks, particularly in housing and services. On the flip side, the Canadian dollar is showing relative weakness as oil prices stall and the Bank of Canada shifts toward a more dovish tone amid weaker economic data and slowing consumer spending. This divergence in central bank policy and economic outlook is building a strong fundamental case for NZDCAD upside.
Technically, the structure remains clean. The market formed a strong bullish engulfing rally earlier in April, and since then has entered a symmetrical correction with higher lows forming under compression. This is a classic continuation setup with strong momentum buildup underneath. A breakout above the 0.8280–0.8300 zone with volume would likely trigger institutional interest and drive price rapidly toward the 0.8600 level, which aligns with the measured move of the flag.
This is a high-probability trade idea supported by both technical and fundamental convergence. With risk well-defined below 0.8135 and momentum favoring the bulls, NZDCAD is one of my top setups going into June. Breakout traders and swing traders alike should keep this pair on the radar as the next bullish expansion looks imminent.

Btc october 2025 local top?#Bitcoin bull run is not over yet, there is a high probability that we will see a local top by October and also the possibility of the next local bottom in October 2026 is also in the plan.
CRYPTOCAP:BTC

BITCOIN No different than all the Bullish Legs since 2023!Bitcoin (BTCUSD) has just completed a Golden Cross on the 1D time-frame, the 4th such pattern since February 05 2023. All those Golden Crosses have been formed marginally after the Channel Up bottoms and start of their respective Bullish Legs.
The current pattern is no different than any other of those Bullish Legs. On top of that, the 1W MACD has also formed its usual Bullish Cross that has technically always preceded the 1D Golden Cross.
Given that, when this happens, BTC tends to be at least near the 0.5 Fibonacci level from the eventual top, we can estimate that the next peak might be around $165000. This is another indicator that makes our $150k Target for this Cycle more than realistic.
But what do you think? Are you also expecting the market to explode past $150k? Feel free to let us know in the comments section below!
-------------------------------------------------------------------------------
** Please LIKE 👍, FOLLOW ✅, SHARE 🙌 and COMMENT ✍ if you enjoy this idea! Also share your ideas and charts in the comments section below! This is best way to keep it relevant, support us, keep the content here free and allow the idea to reach as many people as possible. **
-------------------------------------------------------------------------------
💸💸💸💸💸💸
👇 👇 👇 👇 👇 👇

CME Futures PREMIUM —Bitcoin Will Continue To GrowThe PREMIUM between Bitcoin's CME Futures and spot price is still on. This means that Bitcoin continues bullish.
In a previous article, I used this signal to predict a bullish breakout and bullish continuation. When there is a bullish bias Bitcoin becomes more expensive on CME vs spot, it means buy demand is very strong. With a strong demand for Bitcoin from the public, prices continue to grow.
There is a huge difference between the double top in 2021 and the chart structure in 2025.
The double top in 2021 came out of a 5-up waves pattern. The current top comes out of a 7 months long consolidation phase. Based on Elliotts law of alternation, the bull market will end in a blow off top in 2025 rather than a double top. This means that we will see one final and very strong move up followed by a crash, and that's how the bull market will end. Think of 2017/2018 and you can get a perfect picture of how the bull market will end. The only question that remains is about how far up prices will go, will the bullish wave end at $157,425 or will it go to $211,855?
Six months is enough to reach the second target.
This is a friendly reminder.
Bitcoin will continue to grow.
Namaste.

BTC/USDT Technical Analysis and Trade Idea📉 BTC Pullback or Full Reversal? Let's Break It Down 🔍
Looking at the Bitcoin chart right now, we’re seeing more than just a minor pullback. On the 30-minute timeframe, there’s a clear bearish market structure shift setting in. In my opinion, this isn't a quick dip before continuation — we may be in for a deeper retracement. 🧐
When we overlay NASDAQ (which Bitcoin is often closely correlated with), it becomes even clearer — tech stocks look overextended and are showing signs of a potential pullback. 📉
So here’s the plan:
If BTC pulls back into my point of interest, I’ll be watching for a bullish break of structure to consider a long position. Simple, structured, and in line with what the charts are telling us. 🔁💹
⚠️ As always, this is not financial advice — just sharing how I'm reading the market right now.
💬 What are your thoughts? Are you watching the same levels? Drop a comment below 👇 and let’s talk trade setups! 🚀

Is Bitcoin Ready for Its Next Leg Up? Here’s What We Know So FarBitcoin BITSTAMP:BTCUSD is so back — not just back like “we recovered the dip,” but back like “new all-time highs, let’s go shopping for Lambos on moons” back.
If you’ve been following our Top Stories coverage, you’ll know that the OG token vaulted past $109,500 last week, then kissed $111,900 in “Tom Cruise falling off a building” style. Only that there wasn’t a fall to the ground. Instead, Bitcoin prices got stuck near $110,000 and are now waiting for the next catalyst.
Where are we in the cycle? The memes are pumping. Maxis are chest-thumping (this one’s for you, Saylor ). And the market? Well, it’s trying to figure out if this rocket still has fuel, or if we’re hovering at apogee before gravity reminds us it’s still a thing.
Let’s break down what’s really going on — with numbers, context, and just enough forecast to keep it spicy.
🚀 Bitcoin Goes Bionic
Call it what you want — a breakout, a blowoff, or a moonshot — Bitcoin just rewrote the record books. The OG coin is up 48% since its April lows, a run that’s as explosive as it is poetic.
Remember the bearish chants echoing when BTC dipped near $74,000 in early spring? And all those Bitcoin permabears saying it’s all going to zero? Yeah, those are suddenly hard to hear over the rocket engines.
This is the moment Bitcoin believers have been waiting for. Institutional interest continues to show inflows are strong. Adoption is real and making solid progress. And price action is loud — loud enough to drown out the skeptics still quoting tulip bubbles from 1637.
💥 Why the Breakout? A Perfect Storm
Looking at the fundamentals and the technicals — this wasn’t a fluke. It was a perfect cocktail of macro tailwinds, regulatory green lights, and unrelenting digital gold fever.
ETF flows? Exchange-traded funds are collecting record levels of fresh capital — all eleven of them .
Institutional demand? Climbing faster than Saylor can tweet.
Macro backdrop? Soft dollar, muted inflation, and a shiny 90-day trade truce between the US and China paired with one between the US and the EU .
Regulatory mood? A lot less hostile than the Biden administration, with a stablecoin bill clearing the Senate’s procedural vote and Texas passing a law to hold Bitcoin in its reserve fund.
Bitcoin didn’t ride the wave — it was the wave. And with volatility finally working for traders, not against them, the rally gained real traction.
📉 Not All Risk is Behind Us
Now before we start naming stars after Satoshi, let’s pump the brakes (just a little). The flagship crypto might be chilling around $110,000, but this asset class has the emotional range (and discipline) of a toddler. We’ve seen rallies like this before. We’ve also seen how quickly they unravel.
Upcoming economic data could throw a wrench in the gears. Here’s what to watch for this week:
Wednesday: Fed minutes
Thursday: GDP figures
Friday: Core PCE inflation
Any surprises here — especially hotter-than-expected inflation or hawkish Fed sentiment — could rattle the risk-on party. Bitcoin loves liquidity. If the Fed hints at tightening, the rocket might need to refuel mid-air.
🧭 Key Levels to Watch
Technically, the $111,900 print is your short-term ceiling. It’s the new line in the sand — the price everyone’s watching, waiting for a clean break or a hard rejection.
On the downside, $105,000–$106,000 is developing as support. Break that, and $100,000 becomes the psychological safety net. Below that? Well, let’s not talk about it unless we have to.
Until then, price is consolidating. Think of it like a pit stop — a chance for bulls to breathe, for bears to panic quietly, and for traders to argue about Fibonacci levels.
🛰️ Is $120K Next? Or Is This the Top?
But let’s dig into it a little bit. The real question is whether this rally still has legs. Some traders are calling $120,000 a “magnet level.” Others are treating current prices like the top and selling into strength.
The answer? Probably both.
Momentum is still there — just cooled off a bit. Volume’s down slightly. Social buzz is still high up there. The market’s in a classic “wait-and-see” phase, prepping for a bigger move in either direction.
What could break the stalemate?
A blockbuster inflation report (bullish if soft).
Another policy win from Washington.
Or the most powerful force of all: a dovish stance from the man who moves markets with a simple “Good afternoon” (bonus points if you guess who that is!)
📢 Final Word: Celebrate, But Stay Sharp
If you’ve been long since the dip, this is your moment. Pop some virtual (or real?) champagne. Screenshot that green PnL. Post a gif of Elon and Trump dancing.
But if you’re entering now, zoom out. Yes, momentum is bullish. Yes, fundamentals are stronger than ever. But Bitcoin doesn’t do straight lines for long. And your stop-loss isn’t going to set itself.
Whether $120K is next or we pull back to reset, the next few sessions will be crucial.
Your move : Are you buying this breakout? Waiting for confirmation? Or just enjoying the view from orbit? Let us know how you’re playing this Bitcoin beast — because one thing’s certain: it’s never boring up here.

Bitcoin & Stock Market Rally Together .. My Trade Plan!🚨 Bitcoin Update! 🚨
Taking a look at the BTC chart 🧠📈 — we saw a sharp retracement followed by a strong rally 💥🔥, likely driven by recent tariff policy shifts 🌍📊.
Right now, I’m leaning bullish 🐂 — especially with the stock markets also pushing higher 📈💹. But let’s be clear: my bullish bias depends on the stock market holding strong 🛡️📊.
I’m keeping an eye out for a pullback to the 61.8% Fibonacci level 🌀 for a potential buy opportunity 💸🚀.
⚠️ This is not financial advice — just sharing my outlook!
👇 Let me know what you think in the comments!

Bitcoin (BTCUSDT) - Consolidation Above Support Trendline -DailyBitcoin (BTCUSDT) price is currently consolidating above a trendline support level (between $107,000 and $109,000).
Bitcoin price has been in an uptrend throughout May 2025.
If Bitcoin price closes below $106,000 a pullback could occur down to $104,000 and $100,000.
Support Levels: $107K, $105K, $103K, $100K, $95K, $90K.
Resistance Levels: $110K, $112K, $120K, $130, $136K, $150.
Stock market correlations and corporate earnings could affect short-term price action for Bitcoin (e.g. S&P500, Nasdaq, Dow Jones, Nvidia, Dell, Marvell, etc).
Breaking News, corporate earnings and announcements, presidential and government law changes, and consumer sentiment can all affect the price of Bitcoin.

BTC at Crossroads: Rejection from ATH or Breakout.Key Zones Highlighted:
🟥 Recent ATH and Resistance Level (~$111,000 - $112,000)
The price recently tested this area, forming a new All-Time High (ATH).
This zone has acted as a major resistance, causing a pullback.
A break and close above this range would indicate bullish continuation.
🟩 Support Zone (~$105,000 - $106,000)
Price previously bounced from this zone.
Currently acting as a mid-level demand/support.
Likely to be tested again if bearish pressure continues.
🟩 Strong Supply Zone (~$102,000 - $103,500)
A more significant support area, where previous buying pressure emerged strongly.
If the upper support fails, this becomes the next possible bounce zone.
Price Action and Projection:
Price is currently at $108,209 and moving within a correction phase.
Two potential scenarios are highlighted on the chart:
Bullish Continuation:
Price rebounds from current level (black circle) and breaks above the resistance zone.
Targets new highs beyond $112,000.
Bearish Pullback:
Price fails to sustain above current level and dips into the support zone (~$105K).
If strong buying interest appears, a bounce back to the ATH zone is expected.
Technical Outlook:
Ichimoku Cloud: Price is testing the Kumo (cloud), indicating neutral to slight bearish momentum.
Volume: Slight uptick in volume during the recent drop suggests sell pressure is increasing.
Structure: Price is forming a higher high and potentially a higher low, maintaining a bullish structure as long as support holds.
Conclusion:
BTC is in a critical zone with mixed signals. A decisive move from the current level will likely set the tone for the next 24–48 hours. Watch:
A bounce at ~$108K for bullish continuation,
A dip toward $105K for potential re-entry opportunities.
Let me know if you’d like trade setup suggestions based on this.

BitcoinATH 2017 (~$20K): The top of Bitcoin's 2017 bull market.
ATH 2021 (~$69K): The peak of the 2021 bull cycle.
These two ATHs are connected by a long-term diagonal resistance line, forming a key trendline.
Current Price (May 2025): ~$109,772 — Bitcoin is approaching this major trendline for a third time.

BTC/USD 4h Chart ReviewHello everyone, I invite you to review the current situation on BTC. When we enter the four-hour interval, we can see how the BTC price is moving in the upward trend channel, in which several upward waves can be marked, which may indicate the beginning of another wave of growth.
Here you can see how the current rebound has brought the movement closer to a strong resistance zone from $ 110,400 to $ 113,200, only breaking out of this zone on top can give the price an increase in the area of strong resistance at $ 121,000.
Looking the other way, you can see that when the trend reverses, we first have a support zone from $ 106,600 to $ 105,400, however, if this zone is broken, we can see a quick return of the price to the area of strong support at $ 102,000.
The RSI indicator shows how a support line was formed from which the indicator bounced many times, giving the price an increase, while the MACD indicator maintained the upward trend and created room for another upward movement when the price recovered.

BITCOIN → False breakout of 110K. Negative background???BINANCE:BTCUSDT.P hit a new all-time high of almost 112K on the back of improved economic and fundamental data, but the party didn't last long before Trump's next speech...
Yesterday, Trump spoke and announced new tariffs on the EU. The markets reacted quite aggressively to this news. Despite the fact that the market has practically bought back all the losses, the question itself remains open. The introduction of 50% tariffs on Europe will increase the risk background, which could trigger a fall in both the stock market and cryptocurrencies. In this case, money will flow into gold (a safe asset)...
Technically, Bitcoin is forming a false breakout of the global resistance level of 110K (previous ATH). The price is reacting and forming a bearish momentum (coinciding with the change in the fundamental background).
The area between 109.8 and 110.3 is a resistance and liquidity zone relative to the previous ATH. If the bears hold the resistance, Bitcoin may get stuck inside the 110K - 106.8K (105K) range.
Resistance levels: 109.8K, 110.3K, 112K
Support levels: 106.8K, 105K
Accordingly, if the 110K resistance holds amid the correction, consolidation below the resistance will confirm the formation of a false breakout, and in this case, Bitcoin may move to the 110K (112K) - 105K (102K) range. However, situations change daily, and if Bitcoin does break through 110K and manages to consolidate above its previous ATH, this will be a signal for growth...
Best regards, R. Linda!

Bitcoin Hits New All-Time Highs — Rally Targets $130K+Bullish Momentum Accelerates:
Bitcoin has reached new all-time highs, confirming a strongly bullish technical outlook. Accelerating upside momentum and growing investor confidence are driving the current rally.
Breakout Confirmation:
A decisive breakout from a broadening wedge pattern has unlocked potential targets in the $130,000–$135,000 range, signaling a likely continuation of the uptrend.
Key Support Levels:
With Bitcoin now trading well above $106,000, the previous resistance at $108,000 is expected to act as strong support during any pullbacks — providing a clear risk threshold for traders.
Favorable Risk-Reward Setup:
This alignment of:
Strong momentum
Completed consolidation
Successful breakout
...creates a compelling risk-reward scenario and reinforces the case for continued upside in the current bull cycle.
Bitcoin may just be getting started on its next leg higher. 🚀🔥
#Bitcoin #BTC #AllTimeHigh #Crypto #TechnicalAnalysis #Bullish #Breakout #MarketMomentum #CryptoTrading #CryptoMarket

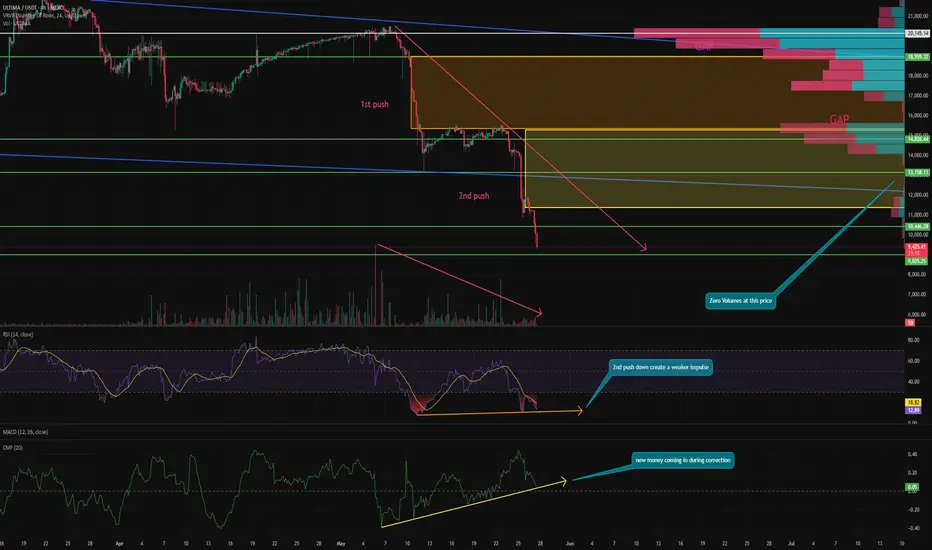
One of the MOST UNDERVALUED assets with huge POTENTIAL? ULTIMA continues its correction and by the looks of it, the end of the correction is getting closer.
⚡️ Let's see why I think there is a huge potential here in the short term.
The current correction is caused by the start of the token unlocking period after the freeze and many of them went straight to the market. However, they are not in a hurry to pay off yet.
Now, above are two huge GAPs. The first one is $11,400 - $15,320 and the second one is $15,400 - $19,000. As you know, GAPs are 99% of the time closed sooner or later. Especially such huge ones that leave behind such untraded areas.
📰 On every impulse, historically, there are 3-4 down pushes. Right now, ULTIMA has completed the second one. Not sure what the 4th will be, given what impulses were on the first two. So the next one (if there is one) could be the last and entail a BOS and a return to growth.
⚙️ Metrics and indicators:
Volume - the entire correction that started as early as $20,000 continues on lower selling volume, signaling seller exhaustion. Potentially signaling a rebound in the short term.
RSI - the second impulse was weaker than the first and a divergence was formed on the indicator chart. Which indicates a potential change of trend back to growth.
CMF - here is the most interesting thing. During the whole correction, fresh liquidity continues to enter the token. Also forming a divergence.
This indicates that holders continue to accumulate the coin. 🔥
VRVP - shows that at the price of $14,000, trading volumes have almost completely disappeared. The asset was probably overheated speculatively as it gave over 500% in a short period of time last year alone. And the current correction is landing gamblers with shoulders that obviously don't want to re-enter and go try their luck further.
Small volumes have started to appear in the $11,000 zone. Which, combined with the fact that we know we could be in for another downward momentum, is very correlative. After all, we are seeing more and more volume at a low price and the next impulse may just spark interest from those who have been waiting for a lower price for a long time.
📌Conclusion:
My first key point was $10,000. The next one will be $8,000. I don't expect a move below $6,000. But am buying at each key point so I don't miss the upside and average the position. Not trying to guess where the long awaited bottom is.