26/05/25 Weekly OutlookLast weeks high: $111,965.73
Last weeks low: $101,994.78
Midpoint: $106,980.26
New BTC ATHs! Well done to those who capitalized on the move and continue to believe in this Bitcoin.
For the last two weekly outlooks I have talked about the pattern of consolidation for 1 week --> expansion the next. Last week We got our expansion week right on queue and this time around BTC made a new ATH hitting just shy of $112,000.
Should the pattern continue this week will be a week of consolidation/chop, however this week is different now that we're at ATH levels. My gut says a pullback is coming after such an aggressive move up with almost no pullbacks at all.
Should BTCs price drop below the Midpoint I think there will be a big struggle to continue this rally in the short term. Initially target would be weekly low and main HTF target would be $97,000 IMO. That would be a healthy pullback to continue the rally.
For the bulls you don't want momentum to stop in the short term, flipping $110,450 and weekly high would put BTC back into price discovery, once any asset is in price discovery it's very difficult to tell where the sell pressure will come from and so shorting becomes very risky.
Btc!

Daily BTC OverviewThe daily chart in its simplest form can be broken down into this range. Since President Trumps inauguration, BTC has declined from a range high of $108,000 back to the lows of $74,500 closing the FVG caused by the US election rally. After a double bottom Bitcoin mean reverted back to the range midpoint which to me is the most important area on the entire chart because it decides if the bull run can continue or if it dies.
I like to keep a close eye on the 200 EMA on multiple timeframes but the 1D is important to gauge the momentum of the move. As the US election results came in a massive push away from this moving average causes the level to steepen in its climb showing strength. Since BTC spent quite some time in the top half of the range the 1D 200 EMA flattens out signaling a loss of momentum, once this level does become flat it no longer provides support. For a bullish cycle to be just that ideally the corrective moves do not spend too much time below this level before expanding above and beyond it once again starting the next leg of the move. A persistent move down below causes a rollover and the cycle looks to be over with a bear market beginning.
Bullish scenario - The correction is over and BTC consistently posts HH's & HLs bringing the 1D 200 EMA up with price and continues the previous bullish trend. I would want to see the retest of the midpoint be successful and then move to reclaim the next local high before targeting range high. The bull market correction looks to be over and bullish continuation resumes.
Bearish scenario - This move is nothing more than a LH, BTC wicks the supply above midpoint, swing fails back under and continues to make LH's & LL's back down to range low where the 1D 200EMA will have now rolled over providing more of a resistance level. The bear market looks to have begun.
I am not here to make a call on where BTC is going next as I do not have that answer, but I do have to plan for each eventuality and that is what I have done here from a TA pint of view. Now it is entirely possible that Geo-political news or an exchange hack etc throws TA out of the window and I have to rethink the plan but in a strictly chart structure perspective this is how I see it.
The indicator "TRADING ENVIRONMENT+V1.0" used in the Idea post is now publicly available for use, give it a try and leave your thoughts and suggestions on the post, thank you.

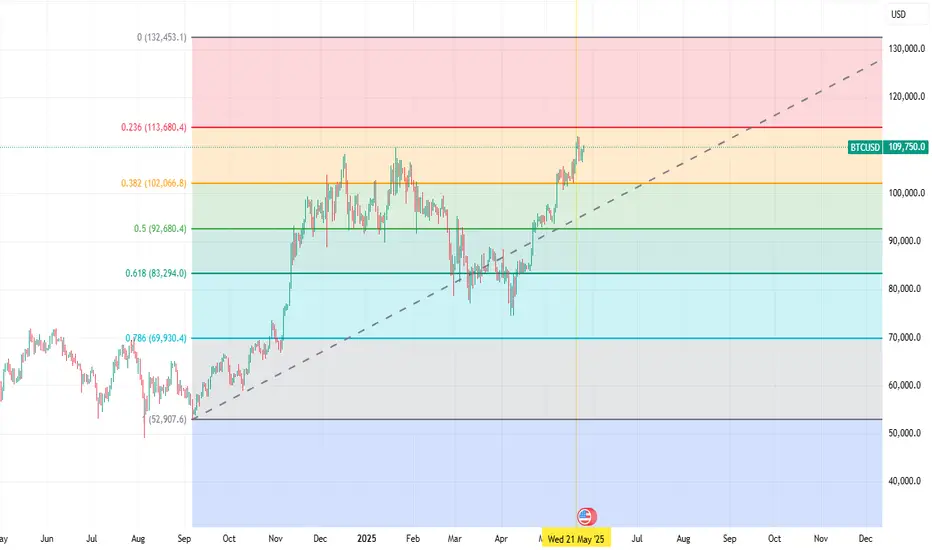
BTC could cross 132k in June to July 2025BTC is above moving average of 50 and 200 on day time frame. recently it made golden cross. It is expected that it will cross key level of 113,680 and 132,453 level within 2 months.
BITCOIN $119k coming shortlyBitcoin (BTCUSD) has been trading within a 6-week Channel Up and Friday's tariff threats led pull-back was its latest Bearish Leg. That pull-back hit the 4H MA50 (blue trend-line) yesterday and rebounded. As long as the 4H MA100 (green trend-line) which is directly below the Channel Up holds, the current rebound is technically the pattern's new Bullish Leg.
All 4 previous Bullish Legs have ended on fairly similar % rises but the weakest has been +11.41%. With the 4H MACD just now completing a Bullish Cross (which has always been a strong buy signal), a repeat of the +11.41% minimum, gives us an immediate $119000 Target.
Do you think that's coming shortly before the beginning of June? Feel free to let us know in the comments section below!
-------------------------------------------------------------------------------
** Please LIKE 👍, FOLLOW ✅, SHARE 🙌 and COMMENT ✍ if you enjoy this idea! Also share your ideas and charts in the comments section below! This is best way to keep it relevant, support us, keep the content here free and allow the idea to reach as many people as possible. **
-------------------------------------------------------------------------------
💸💸💸💸💸💸
👇 👇 👇 👇 👇 👇

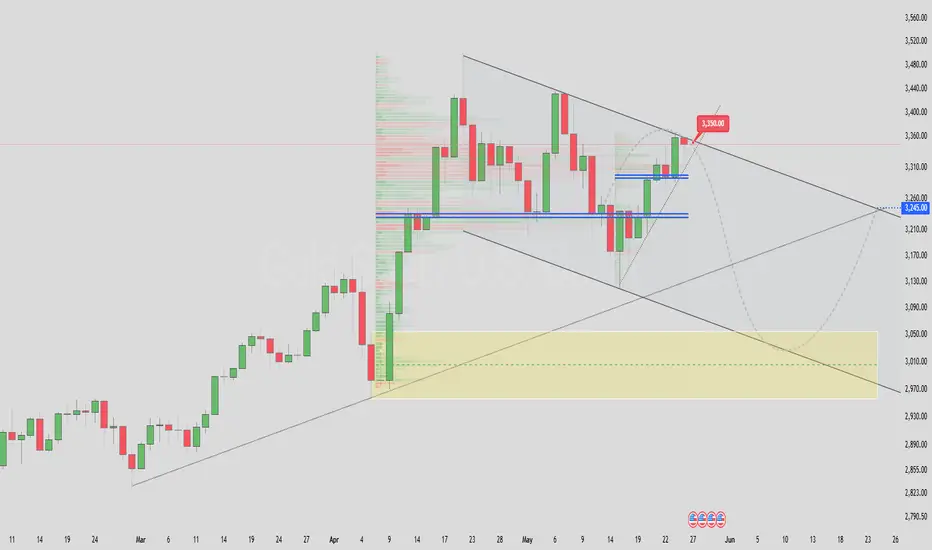
BTC (Y25. P2.E3).AB=CD scenarioHi traders,
In the past, ATH's have made consistent pullbacks soon after with 14%.
This time round I do expect the same, to shake out before we do new highs.
Macro wise, I still have the Cup and Handle targets.
Short term, this aligns well with my support levels.
For now, the VAL or neckline is likely to be resistance.
We had a obvious descending wedge breakout, its hit its target. and now we should range, consolidate here before price makes a decision.
For more updates, come to our forum.
All the best,
S.SAri

XMRUSDT broke resistance, waiting for consolidation XMRUSDT is consolidating against the background of an upward (bullish) trend. The coin reacted weakly to yesterday's bitcoin pullback and is testing consolidation resistance with the aim of continuing growth
Scenario: at the moment the price makes a breakout of 401.65. Consolidation of the price above the level will confirm the intentions of buyers to go to the intermediate target of 440.0. Price consolidation above the consolidation will strengthen buying, which may trigger growth

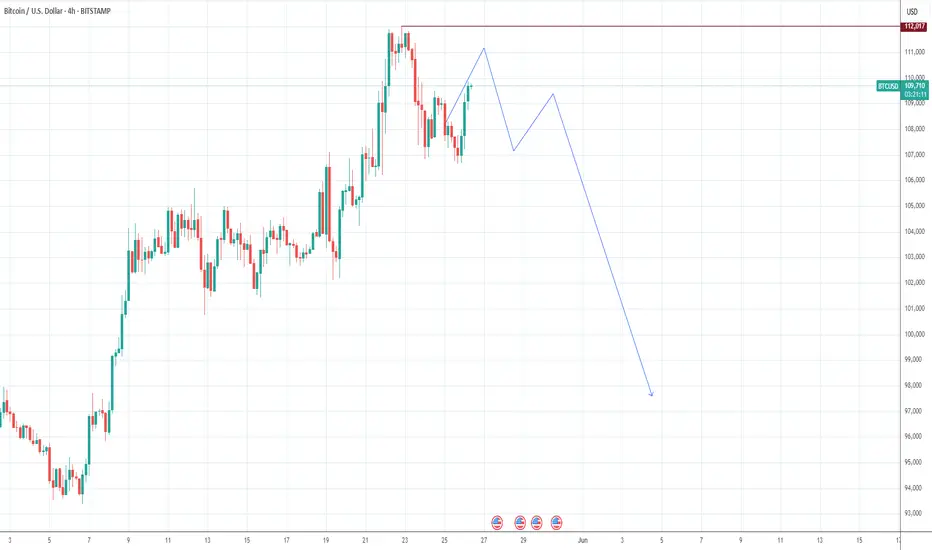
BITCOIN New Update (4H)This analysis is an update of the analysis you see in the "Related publications" section
In the previous analysis, we mentioned that you should avoid looking for sell/short positions, as Bitcoin's price pattern was designed to trap short positions. The price followed the direction of the previous yellow arrow as anticipated.
Currently, the major resistance zone for Bitcoin on the chart is the red area. In this zone, a complete bullish pattern could potentially form | or at the very least, one leg of a bullish pattern may be completed.
Let’s see how it plays out.
For risk management, please don't forget stop loss and capital management
Comment if you have any questions
Thank You

Gold Price Forecast: May - June 2025Gold is currently trading at $3,345.02. The recommendation is to sell now, targeting a bearish move down to $3,050. This outlook is supported by the formation of a rising wedge pattern in confluence with a 3rd retest on the daily chart, a technical setup that often signals a downward price movement. After reaching the target of $3,046, expect a retracement back to $3,242, where the price is likely to retest the long-term bullish trend.
bitcoin needs a long term downward correction Bitcoin right now is in a overbought condition. technically it already gives sign for a downward correction . wait for the marking position. here you need to find the sell confirmation.
Next Step $155,600, Bitcoin Closes 7th Week Green +AltcoinsThe next target and major All-Time High has been confirmed as $155,601.73 for Bitcoin and this isn't likely to be the end of the bull market. This target is now confirmed after Bitcoin wicked lower on the weekly timeframe to test support but ended up closing green, the 7th consecutive week Bitcoin closes green.
This is a major, major bullish signal. It means one thing only, the demand for Bitcoin is just too strong. So strong, that nobody is willing to sell, at least not for longer than a few hours or a few days.
Sold at 100K? Good! Buy back in but higher.
Sold at 105K? Bad! Bitcoin continues rising.
Bought below $80,000? Congratulations, you are a genius and you are holding a great position, you have months and months of bullish action yet ahead of you.
Bought below $90,000? You are still good, you are wise, you are great. You have to congratulate yourself and know that all the gains you receive you deserve. You bought when the time was right, you bought regardless of what the others said.
Bought at $95,000 or lower? There was higher risk because resistance was strong right in front, 100K-110K, and yet, you took action, now you will be rewarded for being brave. The market will bless you with tons of profits and continued success.
Missed the Bitcoin bus? There is absolutely no need to worry, at all, because the Altcoins market is still trading near its bottom and is soon to grow; What one does, the rest follows.
The Altcoins market will follow Bitcoin. The Altcoins will move to strong highs, new heights and new All-Time Highs.
It is not too late... Crypto (Bitcoin & The Altcoins) is going up!
Namaste.

SUSDTAfter forming a Diametric pattern and then correcting after that, the price is now ready to move to the specified range...

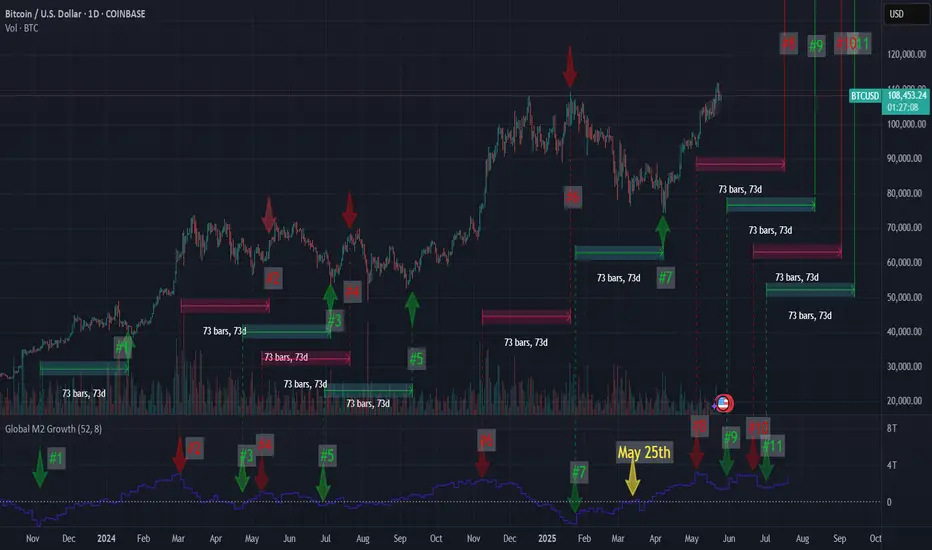
73 days looks to be spot on73 Day Lag to the Global M2 Money Supply looks to be spot on for the last year. If it is, this is good news with the M2 still climbing.
If I am right, we will have a dip within 24 hours of May 28th, only to get another pump to the upside withing 24 hours of June 2nd.
(I tried inputting all this data to Grok in order for him to give me some price targets. They were close to where I think the price will be but using the M2 for price targets still needs some work.)
Volatility Period: Up to May 29
Hello, traders.
If you "Follow", you can always get the latest information quickly.
Have a nice day today.
-------------------------------------
(BTCUSDT 1D chart)
It is showing a downward trend below the previous ATH range.
Accordingly, we need to see if it can rise to around 109588.0 and receive support.
However, since it is currently going through a period of volatility, we need to be careful about trading until May 28th.
-
If it falls further, we need to check if it can receive support near the Fibonacci ratio range of 1.902 (101784.54) ~ 2 (106178.85).
In particular, whether it can receive support near the M-Signal indicator on the 1D chart is key.
If it falls below the M-Signal indicator on the 1D chart, there is a possibility that it will touch the M-Signal indicator on the 1W chart, so we need to think about a response plan for this.
Therefore, if it shows support near the M-Signal indicator on the 1D chart, there is a possibility that it will show a pull back pattern.
The HA-High indicator of the 1D chart is formed at 102302.08, so it is important to see if there is support around this point.
-
The OBV indicator shows that OBV is falling below the High Line, and the StochRSI indicator is also showing that it has switched to a state of K < D.
Therefore, it is necessary to check whether OBV can touch the previous High Line or OBV EMA and rise.
If it falls below that, it is highly likely to lead to further decline.
I compared the previous OBV movements, that is, A, B, C, and the current movement, and the difference can be distinguished by whether it fell below the previous candle or not.
You can see that there is a difference from the previous movement because it is highly likely to close below the previous candle.
Therefore, the point to watch is whether it falls below 102302.08 after the volatility period or rises above 109588.0-110787.38.
If it falls below 102302.08 and receives resistance, it will turn into a short-term downtrend, and if it rises above 109588.0-110797.38, it is likely that the uptrend will resume, so it is a meaningful section.
-
Thank you for reading to the end.
I hope you have a successful trade.
--------------------------------------------------
- This is an explanation of the big picture.
(3-year bull market, 1-year bear market pattern)
I will explain more details when the bear market starts.
------------------------------------------------------

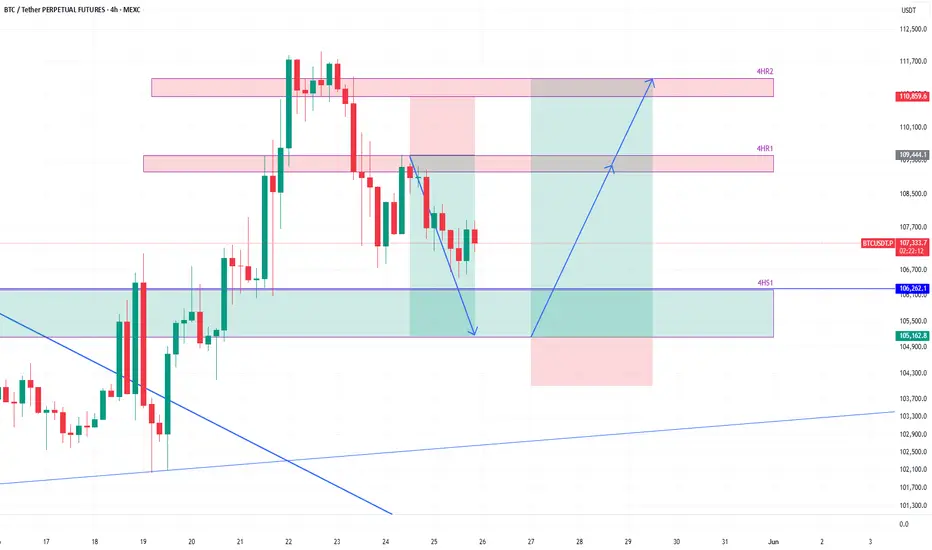
BTCUSDT to bounce from 4h supportHere is an idea for trade on BTCUSDT. The price is coming close to the 4h support zone 4HS1.
It is likely that it will find support there and bounce from there towards 4h resistance 4HR1 and possibly towards 4HR2.
We will take some profit at 4HR1 level if the price reaches there and look to refill the position on any pullback.
We will also reevaluate if the price is really heading towards 4HR2 or likely to go around 96k-97k before fueling up for upward move.
Bullish bounce?The Bitcoin (BTC/USD) is falling towards the pivot and could bounce to the 1st resistance.
Pivot: 105,255.25
1st Support: 101,983.62
1st Resistance: 111,758.60
Risk Warning:
Trading Forex and CFDs carries a high level of risk to your capital and you should only trade with money you can afford to lose. Trading Forex and CFDs may not be suitable for all investors, so please ensure that you fully understand the risks involved and seek independent advice if necessary.
Disclaimer:
The above opinions given constitute general market commentary, and do not constitute the opinion or advice of IC Markets or any form of personal or investment advice.
Any opinions, news, research, analyses, prices, other information, or links to third-party sites contained on this website are provided on an "as-is" basis, are intended only to be informative, is not an advice nor a recommendation, nor research, or a record of our trading prices, or an offer of, or solicitation for a transaction in any financial instrument and thus should not be treated as such. The information provided does not involve any specific investment objectives, financial situation and needs of any specific person who may receive it. Please be aware, that past performance is not a reliable indicator of future performance and/or results. Past Performance or Forward-looking scenarios based upon the reasonable beliefs of the third-party provider are not a guarantee of future performance. Actual results may differ materially from those anticipated in forward-looking or past performance statements. IC Markets makes no representation or warranty and assumes no liability as to the accuracy or completeness of the information provided, nor any loss arising from any investment based on a recommendation, forecast or any information supplied by any third-party.

BRIEFING Week #21 : Watch out for ComoditiesHere's your weekly update ! Brought to you each weekend with years of track-record history..
Don't forget to hit the like/follow button if you feel like this post deserves it ;)
That's the best way to support me and help pushing this content to other users.
Kindly,
Phil

"BTC - Time to buy again!" (Update)As mentioned in the previous analysis, the price reached the top of the wedge and broke out with a price increase. Now that Bitcoin's price is above the wedge, it can be said that with a slight price correction, it could follow the pattern and make a measured move where AB = CD.
PREVIOUS ANALYSIS
Give me some energy !!
✨We spend hours finding potential opportunities and writing useful ideas, we would be happy if you support us.
Best regards CobraVanguard.💚
_ _ _ _ __ _ _ _ _ _ _ _ _ _ _ _ _ _ _ _ _ _ _ _ _ _ _ _ _ _ _ _
✅Thank you, and for more ideas, hit ❤️Like❤️ and 🌟Follow🌟!
⚠️Things can change...
The markets are always changing and even with all these signals, the market changes tend to be strong and fast!!

Bitcoin: Too Early To Buy The Retrace.Bitcoin may be entering a brief corrective formation within the broader bullish trend. The large red candle that rejected the 113K resistance (see my previous article), could be the beginning of a retrace that can take price as low as the 102,500 to 100K area IF bearish momentum persists. The mistake to avoid is buying this pullback too early, especially since there is no bullish confirmation on this time frame.
The red candle off the 113K area is what I like to refer to as the "mother bar". As you will notice, the following candle is a bearish pin bar which failed to break back above the 50% point of the mother bar (see blue arrow). This is a "mini" lower high and is typically a bearish sign for those operating on smaller time frames. A break below 106,500 would confirm a sell signal on this time frame as well as smaller time frames like 4H and 1H. This can be attractive for aggressive shorts, BUT it is very important to keep the broader trend in perspective.
This bearish development does NOT constitute a change in the broader trend. This means support levels are still more likely to hold, and resistances more likely to break. The higher probability scenarios in my opinion are bullish reversal patterns between the 102,500 - 100K area. Double bottoms, failed lows etc. on 1H, 4H or this time frame would be ideal for swing trade longs (see illustration). IF the bullish trend is going to stay intact, then a higher high is within reason which can see price test 113K or higher (120K is my next resistance).
Another VERY important consideration is the overall location of price. Currently in a Wave 5 (v) configuration which signifies limited potential in the near future. In other words, RISK is elevated and only continues to increase as price climbs higher. As "optimistic" as everyone may seem to be, this is a time to be more defensive, NOT aggressive. This can be accomplished by reducing expectations, operating on smaller time frames, and taking smaller positions. My Trade Scanner Pro helps to quantify risk which is especially helpful in rising risk environments such as this one.
In contrast, the location to be aggressively bullish was the 76K area low. Sure I can say this after the fact, BUT if you read my analysis and watch my streams from that time, I was pointing out the potential and the bullish signs as they were developing in real time.
Market situations like the one Bitcoin is in right now can be very confusing at times. Navigating this environment successfully depends on how you interpret price structures, trends and levels across multiple time frames and letting the MARKET validate ideas or not the other way around. Always consider arguments on both sides of the market and weigh those arguments against the style or strategy that you intend to deploy. And if confusion ensues, then the easiest thing to do is walk away. When potential is limited, there is nothing to fear in terms of missing out.
Thank you for considering my analysis and perspective.

ETHUSDT at 2511: Breakout or Breakdown at 2550?Ethereum (ETHUSDT) is currently trading at 2511 on the 4-hour timeframe, sitting in a consolidation phase after a recent uptrend. Over the past few days, the price has shown resilience, bouncing off a key support level around 2400 and now testing a critical resistance at 2550. This 2550 level is a make-or-break point: a clean break above it could spark a bullish move toward 2700, while rejection here might send the price back to retest 2400. The broader market vibe is cautiously positive, with Ethereum’s upcoming upgrades generating some buzz, though regulatory uncertainties could weigh things down if negative headlines hit. Volume has been tapering off during this consolidation, which is normal, but keep an eye out, a breakout with strong volume will carry more weight.
From a technical standpoint, the 50-period moving average (MA) sits at 2450, and the 200-period MA is at 2300, with the price comfortably above both. That’s a solid bullish sign for now, but the 50-period MA is starting to flatten out, hinting that the upward steam might be cooling off. The Relative Strength Index (RSI) is at 60, right in the neutral zone, not overbought or oversold, so there’s room for the price to swing either way. Over on the MACD, the line is above the signal line, showing bullish momentum, but the histogram bars are shrinking, which could mean that momentum is losing some juice. Traders should watch for a breakout or a MACD crossover to get a clearer sense of what’s next.
There’s also a potential pattern taking shape: an ascending triangle, with the flat resistance at 2550 and a rising support line from 2400. This setup is typically bullish, but it’s not a done deal until we see a confirmed break above 2550. If that happens, especially with a volume spike, it’s a green light for bulls. On the flip side, if the price slips below 2400, it could signal a short-term bearish shift. For now, 2550 is the level to watch, it’s where the action will heat up. Whether you’re trading the breakout or the rejection, this is a spot to plan your moves carefully!

Bitcoin is still in an uptrend that is your friend.... but...BTC has taken a pullback after the orange swan event. Now that volatility has pushed down, I want to see the bullish response. If the bulls can't maintain the uptrend, the market structure defines a lower high. A CHOCH usually begins with a lower high followed by a lower low.
Full analysis: Link in the BIO

ETH cheaper than $1,500 already this SUMMER? Hi! While many are already predicting an alt-season and hundreds of X's, let's see if it's really so? 🤔
While bitcoin is updating ATH day by day. ETH is still trading almost 40% cheaper than its peak in this cycle . And on the low time frame it is already forming a double top pattern, signaling a downside risk in the near future.
With the current growth we have closed a small GAP at the level of 2,250 - 2,650. But there is still a GAP above us in the zone of 2,800 - 3,250. In addition, below us there is now a GAP formed in the range of 1,850 - 2,450. And as we know, 99% of GAPs tend to close sooner or later.
❓ But here's the question - which one will close sooner? Let's get to the bottom of it!
⚙️ Indicators and metrics:
MACD - has already given a bearish section, signaling a potential trend change.
Volume - since February 3, all further declines, the volume of ETH purchases has only declined, signaling a decline in interest in the asset. Even at 1400 and below, buying volumes were still disastrously low . Showing the lack of interest in the asset even at such prices.
VRVP - shows buying and selling volumes at price levels in relation to each other. It is noticeable that at the levels of 2,400 - 2,750 the trading volumes increase significantly , and in both directions. Showing that this level is still a strong resistance , and the mood in ETH is extremely speculative and few people are interested in it at 1,400, but at 2,500 it is good choice! 😁
📌 Conclusion:
In my opinion, this was a purely technical rebound for ETH after a long decline . As well as for the altcoin market as a whole. Those altcoins that were simply declining more rapidly than others are the ones that are growing fastest now.
Besides, I remind you that summer is coming soon and there will be less liquidity on the market. So unless the current market conditions push ETH to 3,000 and above . We can definitely not expect it in summer and the most probable scenario in my opinion is blue. I don't think we will see ETH at 1,500 and below (unless Trump does something weird), but it is possible to close GAP and go to 1,800.

Is BTC Poised for a Pullback or Continuation? Key Levels on 3D We’ve got a strong resistance level formed by the double top from Dec 14, 2024, and Jan 19, 2025.
✅ Price is above the 200MA, 50MA, and Bollinger Bands.
✅ MLR > SMA confirms the bullish momentum.
I don’t see any immediate reasons to panic. A pullback to the Bollinger Bands or even the 50MA could be in play, but the price action will depend heavily on macro conditions. 🌎
⚠️ If you're highly leveraged, consider risk management. Keep an eye on price action and stay cautious.
📈 Keep close, follow me for more insights, and thank you for reading! Stay safe. 🙏

BTCUSDT – Hitting resistance, is selling pressure returning?Bitcoin is showing signs of losing momentum after touching the resistance zone around 111,669. On the H4 timeframe, the previous bullish structure has stalled with a series of red candles and a clear pullback, bringing price back to test the EMA 34 zone.
In terms of news, although the market remains excited due to expectations surrounding a Bitcoin spot ETF, many large investors are starting to take profits after the recent sharp rally. This is causing selling pressure to slightly outweigh buying in the short term.
The most likely scenario now is that BTC could make a mild upward move to retest the 111,600 area – but if it fails to break above, a reversal back toward the support zone at 105,800 is highly probable. This area aligns with the EMA 89 and a previous accumulation zone.
Current strategy: don’t get caught in a false breakout. Instead, watch the 111,600 area and wait for a clear signal. If a reversal candlestick pattern appears, short-term sell entries may be considered with a target near the lower support.
