Bitcoin: LEVELS LOOKOUT!If you find this information inspiring/helpful, please consider a boost and follow! Any questions or comments, please leave a comment!
BTC on Watch: Short-Term Levels That May Show the Market’s Hand
#Bitcoin is hovering around all-time highs, but traders should be on high alert. There’s a visible level just beneath price that’s acting as the current line in the sand.
What to Look At
Rather than overanalyze, just focus on the chart. A clean level around $100k is marked — if that gives way, it may not just be a smaller degree pullback on news. It could be the start of something more revealing and deeper.
What Comes Next?
If price breaks that 107k zone, watch what the market prints in response. Does it flush impulsively? Does it grind? Those reactions will show intent — and possibly confirm or deny a larger corrective wave unfolding.
Outlook
We’re not guessing the future — we’re waiting to observe the market’s decision point. Eyes on that level. If it breaks, the chart will speak louder than words.
Trade Safe!
Trade Clarity!
Btc!

The Greatest Chainlink Bar Pattern in History: The Crystal Ball For over 700 days now, following this Chainlink bar pattern has been the most profitable bar pattern I have ever found since I began this journey — it’s literally been a map of the future.
But for the first time, there has been a massive deviation. Let me explain.
We must go back to August 2020.
According to the bar pattern, we’ve just completed the same move from August 2020 — but the big difference here is that this time, it’s taken over 100 days to complete, while in 2020 it took just 30 days.
So far this cycle, it's the biggest deviation yet. Which has me thinking: what if this cycle breaks the four-year cycle and we extend beyond the 1,064-day cycle that's supposed to complete in October 2025?
Without this recent deviation, Chainlink would have completed the cycle bar pattern in August 2025.
My Chainlink Time Fib has a hit on this time period — August 2025. Something could happen around this time. This Time Fib has had major calls before, although it has also failed in the past.
The new deviated timeline for the cycle top:
This is what it would look like if the deviated bar pattern was shifted. Could this be a major clue showing us the future again? Are we catching a glimpse of what’s to come?
According to this new timeline, Chainlink rallies slowly until October 2025 — which lines up with Bitcoin’s cycle completion date. Bitcoin has never passed 1,064 days in a bull market. The last two cycles took exactly that long. So it’s interesting that price appears to grind upward to that date and then roll over.
It continues to roll over and apparently has a major retest of the lows:
This shows a retest of $10 in December 2025 — forming what could be the biggest bear trap in history — before a massive rally in 2026 leading to a March 2027 top.
I’ll be watching Chainlink like a hawk this year. So far, it has led the way for me and made this cycle pretty easy to read. Is it possible that the major run happens in 2026?
Stay safe, marines. 🫡

Bitcoin - Confirmed Breakout#BTC/USDT #Analysis
Description
---------------------------------------------------------------
+ Bitcoin has successfully broken out from the resistance, this is the third time bitcoin has broken out from the resistance line, in the previous two breakouts bitcoin had significant growth and we can expect similar growth this time.
+ the next target for bitcoin is around 150k and this is an easy target for bitcoin.
+ Bitcoin can see some consolidation around previous resistance (around 109k) but this can be broken easily.
+ Lets see how this plays out.
---------------------------------------------------------------
Enhance, Trade, Grow
---------------------------------------------------------------
Feel free to share your thoughts and insights. Don't forget to like and follow us for more trading ideas and discussions.
Best Regards,
VectorAlgo

Bitcoin Lines- What you can see if you remove Bars and replace them by Lines ?
- Congratulation, you just removed the noise in the chart.
- Everything is in graph.
- Covid19 Black Swan included.
- Not a price prediction.🤷♂️.
Happy Tr4Ding !

Bitcoin Be Setting Bull Trap?_Breakout Without High VolumeBitcoin ( BINANCE:BTCUSDT ) started to fall yesterday after forming a new All-Time High(ATH) with high volume , but started to rise again. One of the reasons for Bitcoin’s sudden drop yesterday was the sharp drop in the S&P 500 ( SP:SPX ) index .
First of all, I must say that Bitcoin’s situation is a bit complicated and difficult to analyze , so pay more attention to money management. Be prepared for any scenario.
Bitcoin is trading above the Resistance zone($109,588-$105,820) and near the Resistance lines and Cumulative Short Liquidation Leverage($113,020-$111,833) . What is worrying is that the break of the Resistance zone($109,588-$105,820) was NOT accompanied by high volume , suggesting a bull trap is possible .
I see a correction to at least Cumulative Long Liquidation Leverage($109,972-$108,609) given the low breakout volume for Bitcoin and the large sell orders in the upper prices for Bitcoin .
--------------------------------------------
Today, the Flash PMI data from the U.S . came in stronger than expected:
Flash Manufacturing PMI: 52.3 (vs. forecast 49.9, previous 50.2)
Flash Services PMI: 52.3 (vs. forecast 51.0, previous 50.8)
Analysis :
Both numbers exceeded expectations, signaling stronger economic activity in the U.S. This is bullish for the USD( TVC:DXY ) and could put short-term downward pressure on Bitcoin, as it lowers the chances of near-term Fed rate cuts.
--------------------------------------------
Do you think Bitcoin is completing a Bull Trap or should we expect Bitcoin to increase further?
Note: If Bitcoin breaks above $114,500 with high momentum, we can expect Bitcoin to rise to near $119,000.
Please respect each other's ideas and express them politely if you agree or disagree.
Bitcoin Analyze (BTCUSDT), 1-hour time frame.
Be sure to follow the updated ideas.
Do not forget to put a Stop loss for your positions (For every position you want to open).
Please follow your strategy and updates; this is just my Idea, and I will gladly see your ideas in this post.
Please do not forget the ✅' like '✅ button 🙏😊 & Share it with your friends; thanks, and Trade safe.

BTC BULLISH SETUPBTCUSDT is looking for a reversal and to take the bullish trend extended towards the FVG formed on top. Under the lower timeframes we have a valid reversal indication identified.

BITCOIN - Price will continue to grow inside rising channelHi guys, this is my overview for BTCUSDT, feel free to check it and write your feedback in comments👊
Price started to grow inside rising channel, where it declined to support line and then bounced up to $93100 level.
BTC broke this level at once and then some time traded near, after which bounced and continued to grow.
Soon BTC made a correction, but quickly turned around and later rose to $104900 level, after which started to decline.
After price fell a little, it made an upward impulse to resistance line of channel, breaking $104900 level.
But not long time ago, BTC bounced from this line and started to decline, so I think that price can continue to fall.
Also, I expect that price will fall to support area and then turn around and continue to grow in channel to $113700
If this post is useful to you, you can support me with like/boost and advice in comments❤️

BTC - LOOSING STEAM BTC HAS BROKEN 2 TREND CHANNELS, RED , YELLOW. AND BADLY DAMAGED THE PRIMARY, BLUE.
Its taking out support after support on 1st touch.
If BTC penetrates again thru blue, BTC will begin a larger correction.
BTC must stop falling at $105,600 - $105,000.
The downside target is not yet defined.

Bitcoin Closes Red! Is The Bull Market Over?The end of the bull market and the start of a strong bearish cycle is now confirmed? That's the question that I received from one of my new followers based on much news all across the Cryptocurrency market.
How far down is Bitcoin going in this long-term, very strong, hard and surely-highly confirmed marketwide ultra-bearish correction? None.
I have news good for you, there is no correction, Bitcoin closed one day red. Yesterday's candle produced a 4.4% drop right after Bitcoin hit $112,000, a new All-Time High.
The truth is that Bitcoin just hit a new All-Time High and this reinforces the bullish bias for this Cryptocurrency market, it bolster the Altcoins market; Everything is set to continue growing.
What does $500,000,000 in liquidations, a new ATH and a 4% drop have in common?
Over-leveraged traders.
These are the only losers right now. In order to be liquidated after such a very small move it means that you were trading with more than 15X. That's it. The rest of the market is solid, everything else is strong and there is no need to fear; remember, retraces and corrections and an opportunity to buy-in, rebuy and reload.
Just wanted to tell you that all is well, the rise is not over, this is just a minor pause. Look back to late April, early May, mid-May and so on, the market can and does produces red days, it never moves straight down but neither straight up.
A new bear market now? FALSE.
Bitcoin will continue growing long-term. The Altcoins are on the same train.
A retrace can last a few days just as it can last a few weeks.
A correction can last a few weeks just as it can last a few months.
A bull market can go on for years, and we are in bull market territory now, so be ready and prepared for additional growth. Bitcoin is going up!
Rest easy and hold strong.
Continue to buy and accumulate the Altcoins.
This is not the end, it is only the start.
Namaste.

BTC/USD IS A STRATEGIC CORRECTION OR A NEW RALLY AHEAD?BTC/USD 24 MAY – IS A STRATEGIC CORRECTION OR A NEW RALLY AHEAD?
🌐 MACRO & FUNDAMENTAL CONTEXT
Federal Reserve Outlook: Recent statements from Fed officials remain hawkish, signaling that interest rate cuts may not arrive soon. Inflation data remains sticky, adding pressure on risk-on assets like crypto in the short term.
Market Sentiment: Investors are cautious, with capital flowing back into safer assets amid global uncertainty. However, long-term sentiment on BTC remains strong, supported by fundamentals.
On-Chain Metrics: Wallet activity and hash rate growth continue to reflect strong underlying demand. This suggests accumulation despite short-term price pressure.
📉 TECHNICAL STRUCTURE (H1 CHART)
BTC/USD is currently correcting after reaching the 111,947 resistance area. Price bounced from the 106,831 support zone and is now approaching the mid-range levels again.
Chart Formation: A possible "bull trap" pattern is forming. Price may retest the 110,000 – 111,947 supply zone before deciding the next move.
EMA Signals: Short-term EMAs have crossed downward on the H1 timeframe, indicating a weakening bullish momentum.
🎯 TRADE SETUPS FOR TODAY
🔻 SCALP SELL ZONE:
Entry: 111,800 – 111,950
Stop Loss: 112,200
Targets: 110,000 → 108,500 → 106,800 → 102,567
🔺 BUY ZONE (PULLBACK SUPPORT):
Entry: 106,800 – 106,600
Stop Loss: 106,200
Targets: 107,800 → 109,000 → 110,000
🔍 TECHNICAL KEY LEVELS
Resistance Zone: 111,947 – 112,000
Support Zone: 106,831 → 106,600 → 102,567
FIBO Key Levels: 0.5 – 109,393 | 0.382 – 108,763
⚠️ STRATEGY OUTLOOK
If BTC breaks above 112,000 with strong volume, expect a bullish continuation toward 114,000+ levels.
However, if price fails to hold above 110,000 and drops below 106,800, a deeper correction to 102,500 may follow.
📌 CONCLUSION
"BTC is at a decision point, trading between macro hawkish pressure and technical liquidity zones. Stay flexible and wait for confirmation before committing heavily."
Watch the US Jobless Claims data tonight for volatility triggers.
Avoid emotional trades. Use strict risk management.
Follow this profile for more real-time plans and updates.

$BTC to Retest .786 Fib Next ~$102k - BTFD!timberrrrr
the crypto gods shall giveth one last chance.
buy the fckn dip!!!

BTC is nearly to the End of journeyAs the Chart tells everything for addition, based on the Elliot Wave Sequence, 5 waves of impulsive ended on December 23, also Divergence on RSI is obvious.
This proof of the 5 Impulsive ended. Right now we are at ABC Correction, and now the B Wave is close to the end, and Wave C is coming on a big.

BITCOIN can aim as high as $300k on this CycleBitcoin / BTCUSD is trading inside a Channel Up since the December 2017 High.
This pattern is running through 2 Cycles already and technically is targeting for the top of the Channel Up.
A new +2119% rise until the top, can exceed $300k.
Follow us, like the idea and leave a comment below!!

Bitcoin: Bullish Flag Breakout Targeting $114K Zonehello guys!
Bitcoin has been riding nicely inside an ascending channel, and it just broke out of a clean bullish flag on the 4H chart (classic continuation setup).
The move looks strong, and the target for this flag breakout sits around the $114,000–$115,000 zone (gray area). There’s a chance BTC pushes straight into that target if momentum holds, but we should also be ready for a possible pullback to the channel’s lower trendline before the next leg up.
That lower boundary would be a spot to watch for bullish reactions if the market cools off short term.
What I see:
Pattern: Bullish Flag within Ascending Channel
Breakout Confirmed: Strong momentum after flag breakout
Target Zone: $114,000–$115,000
Scenarios:
Direct move to target
Retest of channel support (~$106,000–$107,000) before continuation
Invalidation: A Break below the channel support would invalidate the bullish setup

BITCOIN Will Keep Growing! Buy!
Hello,Traders!
BITCOIN is trading in an
Uptrend and the coin made a
Great breakout of the previous
ATH which makes us super
Bullish biased so as BTC is
Making a local bearish correction
We will be expecting a bullish
Rebound from the rising support
And a further bullish move up
Buy!
Comment and subscribe to help us grow!
Check out other forecasts below too!
Disclosure: I am part of Trade Nation's Influencer program and receive a monthly fee for using their TradingView charts in my analysis.

BTC ...Take care of your trades...just sayinbearish setup confirmed by th ebreak of 101200
targets and invalidations on the chart

BTCUSD: 1D Golden Cross signals more upside to 155k.Bitcoin dropped below the overbought barrier on its 1D technical outlook (RSI = 69.592, MACD = 4447.700, ADX = 32.855) following today's Trump led pullback. On the long term though, this is nothing but a technical reaction to fundamentals and not enough to invalidate the bullish trend as not only did we make new ATH this week but also just completed a 1D Golden Cross. This is the first such pattern since October 27th 2024, which validated the previous bullish wave that peaked on the 2.0 Fibonacci extension. According to that, Bitcoin should extend the current uptrend with TP = 155,000.
## If you like our free content follow our profile to get more daily ideas. ##
## Comments and likes are greatly appreciated. ##

UNI – Long Spot Trade Setup Following Breakout and RetestUniswap (UNI) has recently broken out of resistance and successfully retested it as support, forming a strong bullish structure. If Ethereum (ETH) continues upward, UNI is likely to benefit from correlated momentum, potentially kicking off a larger rally.
🔹 Entry Zone:
$5.46 – $5.95 (post-breakout retest zone)
🎯 Take Profit Targets:
🥇 $7.50 – $8.00
🥈 $10.00 – $10.50
🛑 Stop Loss:
$4.10

HelenP. I Bitcoin may continue to grow inside upward channelHi folks today I'm prepared for you Bitcoin analytics. In this chart, we can see how the price has been steadily moving within a well-defined upward channel, respecting its trend structure with clean rebounds from the lower boundary. The price has shown signs of a minor pullback after reaching the upper part of the consolidation range. However, it remains well-supported above the 102700 - 104700 zone, which aligns closely with both the trend line and a previous accumulation area. This confluence strengthens the case for a bullish continuation. Given the consistently higher lows, strong reaction from buyers near the channel support, and the overall bullish momentum, I believe this correction will be short-lived. The market appears to be gathering liquidity before attempting another leg upward. If the current structure holds, BTCUSDT is likely to continue climbing along the lower edge of the channel, gradually pushing toward the next significant target. My current goal remains at 117000 points, a level that aligns with the channel’s upper resistance and reflects the natural extension of the ongoing bullish movement. If you like my analytics you may support me with your like/comment ❤️

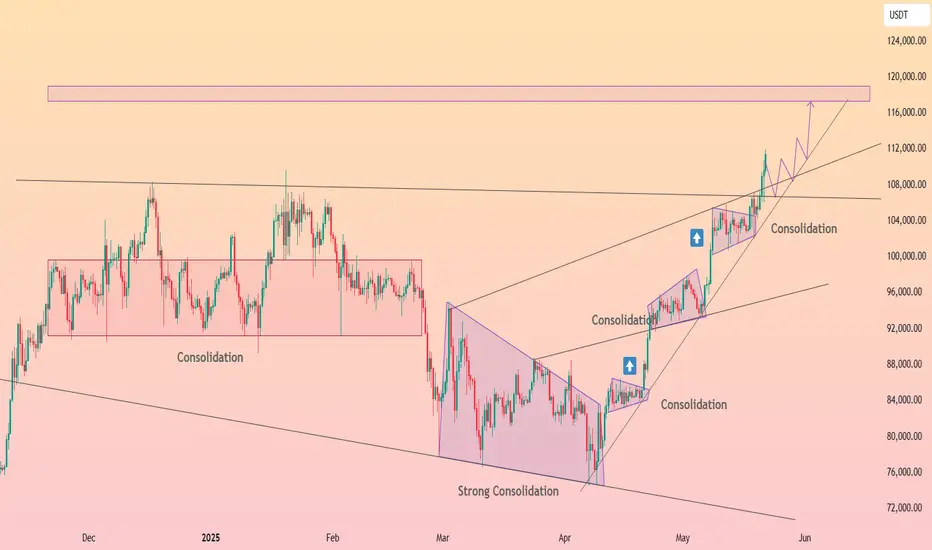
HolderStat┆BTCUSD has reached a new peakCRYPTOCAP:BTC has stair-stepped from 75 k to 110 k inside a steeply guided channel, carving neat consolidation bricks at every leg. A fresh box rests over 102 k support; defend that and the rising wedge projects toward the long-watched 118-120 k new-ATH zone. Break the inner rail and a glide to 96-97 k tests the mid-channel without derailing the dominant ascent.
KASPA CUP AND HANDLE (TA+TRADE PLAN)Cup and Handle pattern clearly formed with rounded bottom and emerging handle.
This is a strong bullish continuation pattern suggesting a potential breakout once the handle completes.
The neckline resistance is approximately at $0.12, and a breakout above this could trigger a strong upward move.
Support & Resistance Zones (S/R)
Current Price: $0.10895
Major Resistance Levels:
$0.12 (neckline)
$0.14
$0.16
$0.19 (pattern target)
Major Support Levels:
$0.10
$0.085
$0.065
Volume Analysis
Volume increased during the formation of the right side of the cup – a bullish signal.
Volume has decreased slightly during handle formation, which is expected.
Indicators
RSI (14): 52.89 – Neutral zone. Not overbought or oversold. Room for upward movement.
Stochastic (14, 3, 1): 27.76 – Close to oversold; potential bullish crossover incoming.
Money Flow Index (MFI): 62 – Healthy inflow of money, not overbought yet.
Wave Momentum/Cipher B: Shows bullish divergences and momentum building from recent lows.
Price Target (Pattern Projection)
Cup depth: ~$0.12 - $0.06 = $0.06
Breakout target: $0.12 + $0.06 = $0.18–0.19 zone
📈 Trading Plan – KASPA/USDT
Strategy: Cup and Handle Breakout
Entry
Aggressive Entry: Buy near current price ($0.108–$0.11) if expecting early breakout.
Conservative Entry: Buy on confirmed breakout above $0.12 with strong volume (daily close).
Stop-Loss
Place SL below handle low, approx. $0.096–$0.098 (depending on risk tolerance).
Alternative: wider SL below $0.085 support if aiming for longer-term hold.
Take Profit Levels
TP1: $0.14
TP2: $0.16
TP3: $0.19 (pattern target)
Use laddered take-profits for partial exits at each level.
Risk Management
Risk per trade: 1–2% of capital
Use position sizing calculator to adjust size based on SL distance
🔄 Re-entry Plan
If breakout fails, monitor $0.085–0.095 zone for support and potential re-entry on double-bottom or bull flag.
⚠️ Bearish Scenario
Breakdown below $0.085 invalidates cup and handle.
Next support at $0.065.
Reassess structure and macro sentiment.

ADA/USDT: Bullish Move Ahead ? (READ THE CAPTION)By examining the #Cardano chart on the 3-day timeframe, we can see that the price is currently trading around $0.80. If it holds above $0.71, we can expect more upside. The expected return for Cardano is around 30% in the short term, 47% in the medium term, and 85% in the long term.
Please support me with your likes and comments to motivate me to share more analysis with you and share your opinion about the possible trend of this chart with me !
Best Regards , Arman Shaban

BTCUSDT – Mild Pullback, Support Holds FirmBTCUSDT remains in a clear uptrend with a structure of higher highs and higher lows, after breaking out of a prolonged consolidation pattern since early May.
The price has surged from the 106,000 resistance zone and approached the technical target around 112,000 – an area that is currently triggering a slight pullback.
At the moment, the support zone around 106,700–107,800 aligns with a demand area and the EMA34, likely serving as a springboard for the next upward move.
If BTC continues to consolidate around this zone without breaking below 106,700, the 112,000 level could be breached, paving the way for a move toward higher targets.
