BTCUSDTBTCUSDT is expected to have a chance to test the 112,678 level. If the price fails to break through this level, a correction is expected and the price is likely to fall.
🔥Trading futures, forex, CFDs and stocks carries a risk of loss.
Please consider carefully whether such trading is suitable for you.
>>GooD Luck 😊
❤️ Like and subscribe to never miss a new idea!
Btc!

DOGEBTC Strong chance that Dogecoin outperforms Bitcoin soon.DOGEBTC is testing its 1W MA50 (blue trend-line), which keeps it into a buy zone, exhibiting the same kind of price action it had during its previous Cycle in late December 2020.
That was right before the parabolic rally started where Dogecoin outperformed Bitcoin massively on the last strong known Altseason.
Right now the market is forming the same 1W MACD Bullish Cross it did on December 21 2020, straight after which it broke above the 1W MA50. The rebounded that was causes even broke above the Cycle's Falling Wedge in a rally that lasted 4 months.
We are inside a similar Falling Wedge since 2021 so a break-out may have a similar outcome. This chart shows that it may be time to move some capital to Doge.
-------------------------------------------------------------------------------
** Please LIKE 👍, FOLLOW ✅, SHARE 🙌 and COMMENT ✍ if you enjoy this idea! Also share your ideas and charts in the comments section below! This is best way to keep it relevant, support us, keep the content here free and allow the idea to reach as many people as possible. **
-------------------------------------------------------------------------------
💸💸💸💸💸💸
👇 👇 👇 👇 👇 👇

Bitcoin Overextended? Watch These Key Levels for the Next Move!BTC/USDT 1H – Retrace Before the Next Leg? 🚦
Bitcoin has shown impressive strength recently. On the 1-hour chart the current price action looks overextended 📈. After a strong impulsive move up, we’re seeing signs of exhaustion, with price stalling near the $111,800 region. Liquidity appears thin on the buy side, and there’s a cluster of potential sell stops resting below the current high in the form of sell stop.
I’m anticipating a retrace into the Fibonacci zone, with key levels at the 50% - 61.8% retracement. This area aligns with previous consolidation and could act as a magnet for price, especially as liquidity is swept from late long positions. If we see price rotate and break structure bullishly at my point of interest, I’ll be looking for a long entry opportunity. 🔄
Fundamentals & Macro Backdrop 🌍
On the fundamental side, Bitcoin remains sensitive to macroeconomic and geopolitical developments. Ongoing uncertainty in global politics and central bank policy continues to drive volatility across risk assets. Bitcoin’s correlation with tech stocks and the NASDAQ remains significant—recent data shows that when the NASDAQ pulls back, Bitcoin often follows suit. If we see a correction in tech stocks, be prepared for a retrace in BTC as well. 📉
Institutional interest is still strong, but short-term sentiment is cautious as traders await clarity on inflation, interest rates, and regulatory news. Keep an eye on U.S. economic data releases and any major headlines out of Washington or global hotspots, as these can quickly shift risk appetite.
Fundamentals and macro news remain key drivers—stay nimble!
Let’s see if BTC can reload for another leg up, or if broader market weakness drags it lower. Trade safe! 🚀

Bitcoin’s Pump to NEW ATH($109,845) Ends in High-Volume ReversalBitcoin ( BINANCE:BTCUSDT ) moved towards the targets as I expected in my previous idea , although it faced pump and dump moves in reaching the targets .
Bitcoin managed to create a new New All-Time High(ATH=$109,845) but immediately began to decline on high volume .
Bitcoin is trading in the Resistance zone($109,588-$105,860) and near the Resistance lines , Monthly Resistance(2) .
In terms of Elliott Wave theory , Bitcoin was able to complete main wave 5 .
I expect Bitcoin to fall to at least $102,200 AFTER breaking the Support zone($105,100-$104,140) , and the possibility of further declines is very high .
Also, on the 1-hour timeframe of the USDT.D% ( CRYPTOCAP:USDT.D ) chart, a bullish and regressive Falling Wedge pattern is visible , with its upper line broken.
Do you think Bitcoin can finally create a NEW All-Time High(ATH) Again!?
Note: If Bitcoin touches $110,100, we should expect a pump.
Please respect each other's ideas and express them politely if you agree or disagree.
Bitcoin Analyze (BTCUSDT), 1-hour time frame.
Be sure to follow the updated ideas.
Do not forget to put a Stop loss for your positions (For every position you want to open).
Please follow your strategy and updates; this is just my Idea, and I will gladly see your ideas in this post.
Please do not forget the ✅' like '✅ button 🙏😊 & Share it with your friends; thanks, and Trade safe.

BITCOIN made new ATH but still much time left before a Cycle topBitcoin (BTCUSD) is about to enter the final week of May, with the month mostly likely to close on a strong green candle, the 2nd straight. Though it made yesterday a new All Time High (ATH) above 109k and many are already talking about a bearish reversal, this chart shows that there is still plenty of time left before the current Bull Cycle tops.
If fact a simple measurement of the Bottom to Bottom and Bottom to Top ranges of the last 3 Cycles is enough to present all the evidence that are needed for this case.
As you can see, the previous 2 Bull Cycles lasted for 35 months (1065 days) from Bottom to Top. Similarly, the Bottom to Bottom (Bear Cycle to Bear Cycle) measurement has been 47 months (1430 days).
This amazing symmetry suggest that BTC is more likely than not to repeat this feat on the current Cycle as well. A 35 month range from Top to Top indicates that the Bull Cycle is expected to peak on October 2025, while a 47 month Bottom to Bottom range indicates that the next Bear Cycle should bottom in October 2026! As far as a potential price top is concerned, various of the previous analyses we've conducted show that $200k is a fair maximum, but the current study focuses on the timing of profit taking and not specific price levels.
So are you willing to book your profits by this October? Feel free to let us know in the comments section below!
-------------------------------------------------------------------------------
** Please LIKE 👍, FOLLOW ✅, SHARE 🙌 and COMMENT ✍ if you enjoy this idea! Also share your ideas and charts in the comments section below! This is best way to keep it relevant, support us, keep the content here free and allow the idea to reach as many people as possible. **
-------------------------------------------------------------------------------
💸💸💸💸💸💸
👇 👇 👇 👇 👇 👇

BTC Potential Short-Term PullbackBINANCE:BTCUSDT could be setting itself up for a short-term pullback.
It might be forming a Daily RSI Bear Divergence, with the latest retest of the the main supply zone, and RSI Divs/Breakouts have been reliable leading signals for recent CRYPTOCAP:BTC PA.
Key Levels to Watch
• $119k - Measured wedge target, confirmed with last month's breakout.
• $106.2k-$109.5k - Main supply and ATH, a sustained break above it would invalidate any bearish PA.
• $89.6k-$91.9k - Lots of confluence here:
- Unmitigated daily FVG
- The 200-day EMA is sitting there
- A move here would be between 0.5 and 0.618 Fib retracement of the last leg up, consistent with the typical pullback length of Wave 2 (Elliott Waves theory)
- It has also been an important S/R since November 2024, and a retracement here could form an Inverse Head and Shoulders pattern.
I would be patient with it, as I still see a lot of uncertainty short-term, but I think a pullback to ~$90k could offer a great long entry. Worth keeping a close eye on it.

118.75KMorning folks,
So, last time BTC was not able to show retracement that we've suggested. In fact by the end of the session, no reversal day was formed. It was some fake alarm. Our long-term 110K target has been completed, so monthly grabber has reached the minimum target.
But for now we see nothing to do. We consider no shorts. Market stands confidently around the top, without sharp drop back, it is not at overbought or at some strong resistance, so it could keep going higher. Next our upside target is 118.75K. So we could keep existed longs, just don't forget to manage stops.
If downside pullback still starts it might become good chance for long entry again. Market now is driven by rebalancing portfolios of big funds that have to sell US assets as they lost AAA rating. This explains why dollar is falling while yields are raising. This is not fast process and probably will last for some time more.

Crypto update for 2025.05.22Bitcoin hits a new all-time high, but others are lagging. What's the deal?
Let's dig in...
CRYPTO:BTCUSD
CRYPTO:BCHUSD
CRYPTO:ETHUSD
CRYPTO:XRPUSD
CRYPTO:LTCUSD
CRYPTO:DOGEUSD
CRYPTO:DOTUSD
CRYPTO:TRXUSD
Let us know what you think in the comments below.
Thank you.
77.3% of retail investor accounts lose money when trading CFDs with this provider. You should consider whether you understand how CFDs work and whether you can afford to take the high risk of losing your money. Past performance is not necessarily indicative of future results. The value of investments may fall as well as rise and the investor may not get back the amount initially invested. This content is not intended for nor applicable to residents of the UK. Cryptocurrency CFDs and spread bets are restricted in the UK for all retail clients.

BTC - Can BTC push past $109k in this rising channel?Bitcoin has been trading within a clearly defined upward channel since the beginning of April. This rising channel is characterized by three touchpoints on both the upper and lower trendlines, indicating a consistent pattern of price movement within these boundaries.
Approaching key resistance
Currently, BTC is approaching a critical resistance level near the $109,000 mark, which coincides with its previous all-time high. This level represents a significant psychological and technical barrier, as it was the peak of the last major bull cycle. The price is now testing this resistance while still remaining within the rising channel. The confluence of the upper channel resistance and the historical all-time high makes this a decisive moment for Bitcoin's price action.
Bullish breakout
A rejection from this resistance zone could lead to a temporary pullback, potentially towards the lower boundary of the rising channel. This would not necessarily signal the end of the bullish trend, but rather a healthy consolidation within the established structure. However, a confirmed breakout above the $109,000 level, especially if supported by strong volume and bullish momentum, would likely signal a significant shift in market dynamics. Such a breakout would validate the strength of the current uptrend and could open the door for new all-time highs. In that scenario, the $109,000 level would likely flip from resistance to support, becoming a crucial area for bulls to defend on any future retests.
Bearish breakout
On the downside, traders should also be aware of the implications of a breakdown below the rising channel. The lower boundary of the channel, currently located around $104,000, is an important technical level to watch. A decisive break below this level could indicate a loss of short-term bullish momentum and may trigger a deeper retracement. In such a case, BTC would likely target the imbalance zone between $97,500 and $100,500, a region where price moved rapidly in the past without establishing strong support or resistance. This zone could serve as a critical area for buyers to step in and attempt to reestablish bullish control, potentially setting the stage for another rally toward the $109,000 resistance and a renewed attempt at a breakout.
Conclusion
In summary, Bitcoin is currently at a pivotal juncture. The upward channel that has guided price action since April remains intact, but BTC is now confronting a major resistance zone at its previous all-time high. Whether price breaks through to new highs or experiences a pullback will depend on the strength of market momentum and the behavior of buyers and sellers at these key levels. Traders and investors should remain vigilant and prepared for both scenarios, as the next move could set the tone for Bitcoin’s trajectory in the coming weeks.
Thanks for your support.
- Make sure to follow me so you don't miss out on the next analysis!
- Drop a like and leave a comment!

EURUSD BULLISH OR BEARISH DETAILED ANALYSISEURUSD has followed our expectations beautifully, bouncing strongly off a key support zone near 1.1270. This zone was previously a tough resistance which the pair broke through, and it’s now acting as a strong demand area. The latest bullish engulfing candle from this region signals solid buying pressure, confirming that bulls are stepping in to protect this structure. I’m now targeting a move toward the 1.17 level, which aligns with the previous high and the next major resistance on the chart.
From a macro perspective, the euro is showing resilience amid recent ECB policy comments, where officials have adopted a cautious but steady tone. Inflation remains persistent enough to delay aggressive rate cuts, keeping EUR demand intact. Meanwhile, the dollar is seeing renewed selling interest as market expectations shift toward a Fed pause, especially after softer US economic indicators including retail sales and jobless claims. This divergence is likely to support further upside in EURUSD.
Technically, this is a classic textbook retest of broken resistance turned support, backed by momentum indicators such as RSI now bouncing from mid-range and MACD showing signs of a potential bullish crossover. Volume has spiked at the support zone, confirming institutional participation. As long as EURUSD holds above 1.1270, I remain bullish and see this move extending toward 1.17 over the coming sessions.
This setup presents a strong risk-to-reward opportunity with momentum aligning with structure. The breakout and retest scenario is fully intact, and fundamentals are now favoring a continuation to the upside. Traders and swing holders should keep this on their radar as EURUSD looks ready to climb further.

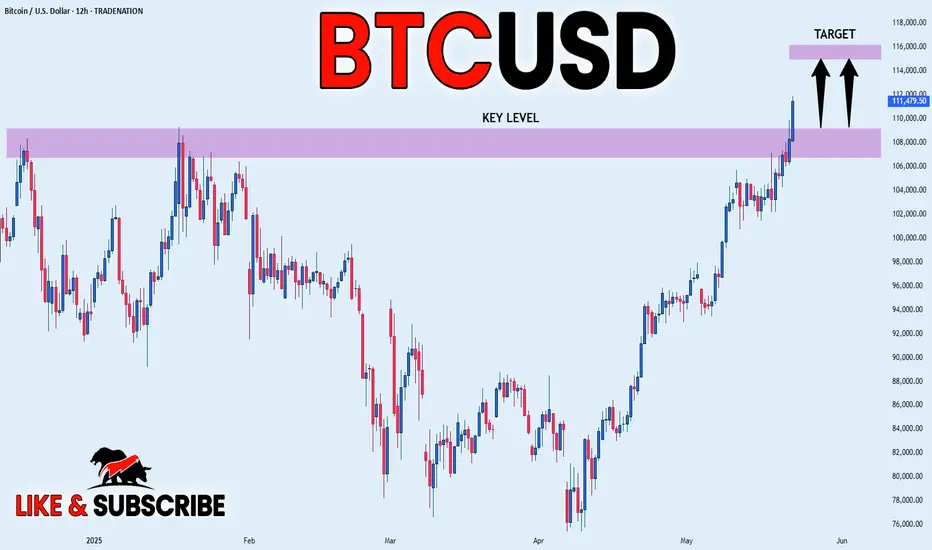
BITCOIN MASSIVE BREAKOUT|LONG|
✅BITCOIN is trading in an
Uptrend and the coin finally
Made a bullish breakout of
The previous ALL-TIME-HIGH
Of 109,200$ level which
Was a strong resistance
Level and the coin is now trading
Almost 3% above the previous ATH
Which reinforces our bullish bias
In a powerful way and after a
Potential pullback we are quite
Likely to see some further
Growth on Bitcoin
LONG🚀
✅Like and subscribe to never miss a new idea!✅
Disclosure: I am part of Trade Nation's Influencer program and receive a monthly fee for using their TradingView charts in my analysis.
BITCOIN - Time to buy again!Bitcoin will reach $130k with a slight price correction.
previous analysis
Best regards CobraVanguard.💚

BITCOIN - Time to buy again!If the price can break this downward channel, it could reach $100k again. In my opinion, the bearish cycle of the crypto market has ended, and from now on, prices will be bullish.
Give me some energy !!
✨We spend hours finding potential opportunities and writing useful ideas, we would be happy if you support us.
Best regards CobraVanguard.💚
_ _ _ _ __ _ _ _ _ _ _ _ _ _ _ _ _ _ _ _ _ _ _ _ _ _ _ _ _ _ _ _
✅Thank you, and for more ideas, hit ❤️Like❤️ and 🌟Follow🌟!
⚠️Things can change...
The markets are always changing and even with all these signals, the market changes tend to be strong and fast!!

Say hello to the $110k Bitcoin !The BTC will increase $15K and reach to the top of the wedge in the coming weeks .
Give me some energy !!
✨We spend hours finding potential opportunities and writing useful ideas, we would be happy if you support us.
Best regards CobraVanguard.💚
_ _ _ _ __ _ _ _ _ _ _ _ _ _ _ _ _ _ _ _ _ _ _ _ _ _ _ _ _ _ _ _
✅Thank you, and for more ideas, hit ❤️Like❤️ and 🌟Follow🌟!
⚠️Things can change...
The markets are always changing and even with all these signals, the market changes tend to be strong and fast!!

$ETH / $BTC Inverse Head and Shoulders Confirmed! NGL pretty much every chart i'm looking at rn looks crazy bullish 🐂
Inverse Head and Shoulder confirmed on ETH / BTC 🤯
The real test comes at the 200DMA as CRYPTOCAP:ETH has not traded above it in the past 307 days.

BTC No Fancy TA Just SpeculationBTC breakout and close over ATH. Short term bullish on BTC and lagging alts.

$BTC Historic Daily Close Above ATH - Pullback Warning*HISTORIC Daily Close for ₿itcoin marking a new ATH 🥇
Some hefty volume poured in as the Golden Cross nears.
If CRYPTOCAP:BTC breaks down from this impulsive trend we should see a pullback to the .786 Fib ~$102k to confirm this new ATH.
Bulls need the Weekly Close above $109k to prevent that.
Nonetheless, this confirms the start of the parabola I’ve mentioned over the past month in my analysis 💯
Next big target is the 1.618 Fib ~$130k 🤑
Congrats Hodlers 🥳

BTCUSDT.P | 110kHello everyone, this is The Dark Analysis, let's have a look at BTCUSDT.P together.
I suggested you open a long position on BTCUSDT.P after 1m breakout.
you can see the result on the picture above.
NEW ENTRY
If you have missed this opportunity, you can open a buy position on BTC at this area:
5m-15m Order Block at 107428.7-106936.8
- SL :106887.8
- TP : Previous high
CONDITIONS
-The price most reach this zone with weak momentum.
-There must be a dogi or engulf candle after touching that very zone.
Don't be shy and feel free to tell me your ideas in comments.

Going Short on BitcoinBINANCE:BTCUSDT
Bitcoin has moved up strongly in the last 5 weeks in a 5-wave up move, which is very bullish long term. However, after a 5-wave move, there is usually a 3-wave corrective move to the opposite direction. The most common target will be the Golden Pocket, which is between the 61.8% Fibonacci Retracement and the 78.6% Fibonacci Retracement. Which would be between $86,500 USDT and $81,200 USDT. This move will probably take several weeks, probably between 2 and 4 weeks, before it resumes to the upside.
Another point to consider is that the RSI indicator has reached overbought levels, above the 70 level. I would like to see it near oversold levels, 30 level, before considering going long.
I hope you find this interesting.
Good luck to you

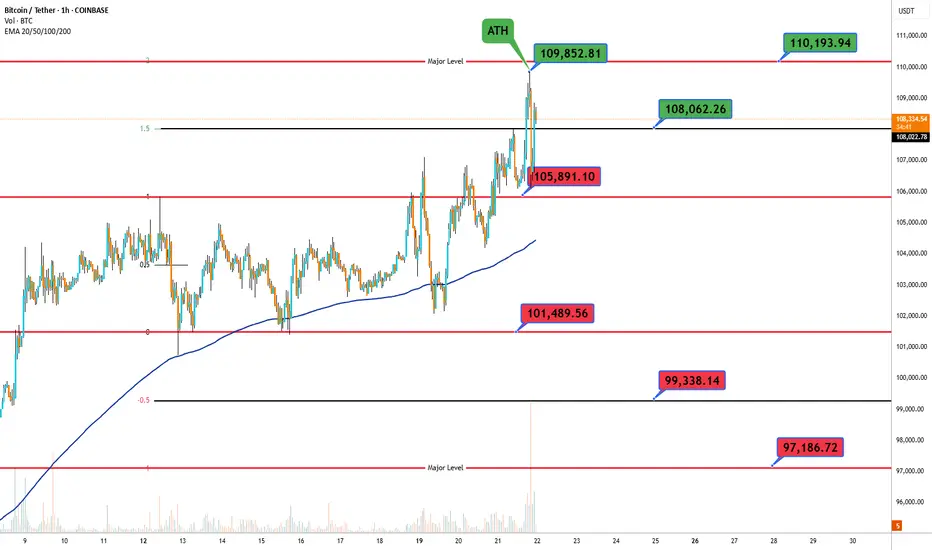
Bitcoin ATHBased on the chart for Bitcoin/Tether ( BINANCE:BTCUSDT ) on a 1-hour timeframe 📈, here are the complete support and resistance levels:
Support Levels: 🛡️
97,186.72
99,338.14
101,489.56
Resistance Levels: 🚧
108,062.26
109,852.81
110,193.94
Will BTC endure and continue to reach further highs?As we can see, the BTC price has broken the previous ATH and established a new one at $ 109,886, but here we have to see that we had a slight breakout and the price immediately returned below the previous peak. At this point, we should observe whether it will positively break out from the previous peak and whether it will stay above it so that it can gather energy for a strong move towards strong resistance at $ 130,000.
However, if we see a correction, it may first go down to $ 101,500, then we can see support at $ 96,000, and then we may have a drop to around $ 87,000.
When we look at the Stoch RSI indicator, we will see that despite the current increases, the indicator remains around the middle of the range, which could potentially give room for another upward move.

BTC going to the moon.... but when?BTC is showing signs of bearish divergence on many of the timeframes, but the bulls don't care. However, traders need to. Signs of divergence can eventually get follow-through, but not without a proper market structure. At the PA, divergences can be invalidated and disregarded. This would result in the trend being our friend.
Full TA: Link in the BIO

Bitcoin Potential UpsidesHey Traders, in today's trading session we are monitoring BTC/USDT for a buying opportunity around 102,000 zone, Bitcoin is trading in an uptrend and currently is in a correction phase in which it is approaching the trend at 102,000 support and resistance area.
Trade safe, Joe.
