BTCUSD: Made new ATH on Genius Bill vote. 1D Golden Cross formedBitcoin just made new ATH today pas 109,500 as the U.S. Senate officially advanced the GENIUS BILL for consideration. This has turned the 1D technical outlook overbought (RSI = 75.442, MACD = 4135.600, ADX = 30.728) but as mentioned before, Bitcoin tends to thrive on such a state. On top of the very bullish fundamental news, the market just formed a 1D Golden Cross the first since the U.S. elections one (October 27th 2024). That signaled the extension of the bullish trend to +122.18%. If we apply that on the current bullish wave along with the Fibonacci retracement level, we can see that the price is insde the 0.382 - 0.5 Fib range, exactly where it was on the 2024 Golden Cross. If this plays out exactly this way, expect $165k by late July.
## If you like our free content follow our profile to get more daily ideas. ##
## Comments and likes are greatly appreciated. ##
Btc!


At ATH, blast continuation or tap and turn?If you find this information inspiring/helpful, please consider a boost and follow! Any questions or comments, please leave a comment!
🚀 Tap & Turn… or Blast?
Bitcoin is reacting well to mapped levels, maintaining structure and respecting key zones. Price action continues to print HLs and HH keeping the bulls confident, atm.
💥 Levels Still Respecting
Recent price action has shown solid reactions at prior resistance and support zones. Nothing overly aggressive, but clean enough to keep structure traders engaged.
🐂 Bulls Still in Control (for Now)
Higher lows remain intact, keeping the bullish structure alive. I did take a lower-degree short, but without a clean break of those HLs, there's no reason to call a shift yet. A break of that pattern would be the first real sign of momentum fading.
🚧 Key Watch Zone: 106K–104K
This is where things get more critical. A clean break below that zone could tilt the balance.
Trade safe, trade smart, trade clarity.

KAS (Kaspa) – Long Swing Setup from Key SupportKAS is retracing into a key support zone around $0.108, which has previously acted as a springboard for bullish reversals. This level aligns with a potential higher low structure on the daily chart, and offers a favorable risk/reward setup for a swing long.
🔹 Entry Zone:
$0.108
🎯 Take Profit Targets:
🥇 $0.13 – $0.154
🥈 $0.175 – $0.19
🛑 Stop Loss:
Just below $0.097 (breakdown below support invalidates setup)

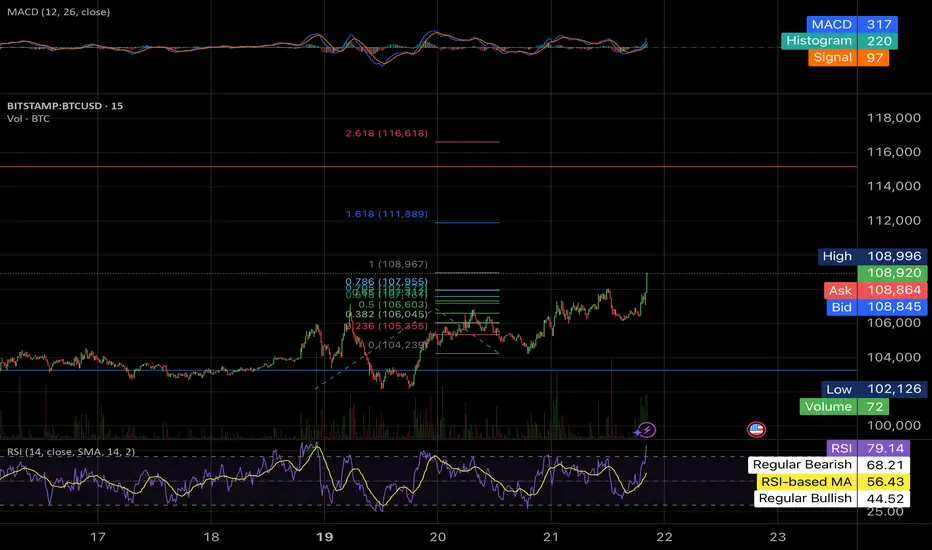
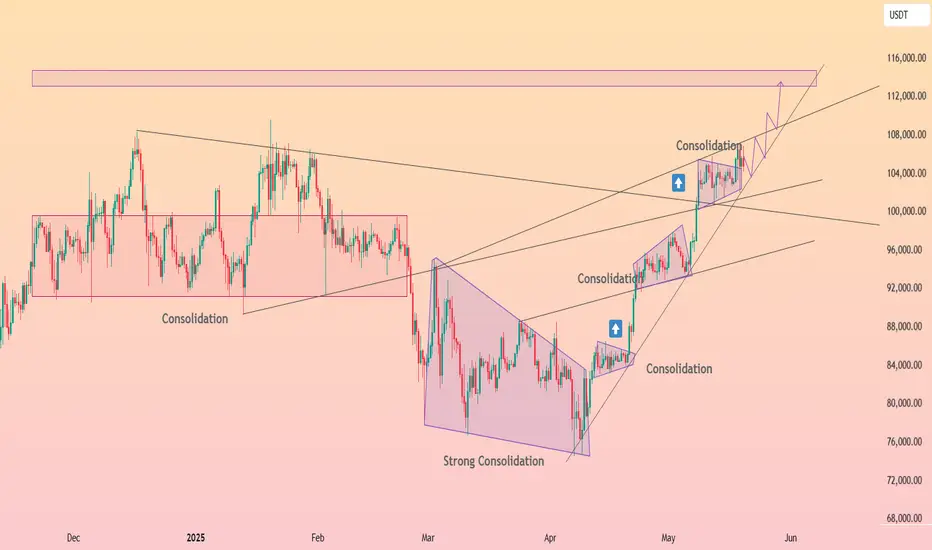
HolderStat┆BTCUSD came out from the triangleCRYPTOCAP:BTC price has advanced in neat stair-steps from March’s strong consolidation wedge, hugging an internal up-trend. The latest flag is coiling on the mid-channel near 103 k; defend it and the route toward the 113-115 k supply box stays active. A daily close below the inner rail would merely usher a glide to the outer channel near 97 k—momentum remains north-bound while that area is respected.
EURGBP BULLISH OR BEARISH DETAILED ANALYSISEURGBP is currently respecting a well-defined rising channel structure on the daily timeframe, and the pair has just delivered a strong bounce off the lower trendline support. This fresh reaction suggests renewed bullish momentum from the bulls stepping in at a key zone. The current price is hovering around 0.84–0.8450, and I’m targeting a move towards the 0.87 area, aligning perfectly with the upper boundary of the channel and a clean resistance level from previous market structure.
From a fundamental standpoint, euro sentiment is being supported by sticky inflation across the Eurozone. The ECB remains cautious with any premature easing, with policymakers signaling a data-dependent approach to rate cuts. Meanwhile, the UK economy is under pressure after the latest GDP figures confirmed weak growth, adding weight to the Bank of England’s dovish leanings. Traders are now increasingly pricing in rate cuts from the BOE in the coming quarter, creating a clear divergence in monetary policy outlooks — a bullish driver for EURGBP.
This technical setup is further reinforced by bullish candlestick formations on the daily chart, signaling a potential reversal from recent weakness. RSI is bouncing off mid-levels, and there's early crossover potential in MACD favoring upward momentum. Price has also reclaimed key support near 0.8400, now likely to act as a floor going forward. As long as price remains above this zone, the path of least resistance remains to the upside.
With this combination of a rising channel pattern, supportive euro fundamentals, and GBP macro weakness, EURGBP presents a high-probability long opportunity. I remain bullish on this pair with a clean 0.87 target in view. Momentum is building, and this setup fits perfectly into a swing trading model with trend continuation potential.

ULTIMA SHOWS SAME PATTERN AS BTC BEFORE EXPLOAD TO THE 100K🔥 Ultima has formed a bullish descending flag pattern on the daily chart. The same pattern led BTC to an explosive rise to $100,000 at the end of the previous year.
This pattern is historically a correction in a bullish trend and breaks to the upside, continuing the rise.
Ultima has been one of the strongest technologically backed tokens this cycle . The token has risen in value by over 1000% from its low in the summer and now, having set a new atx, is consolidating under it, gaining strength for the next momentum.
Last weekend was a strong shakeout for leveraged traders and the price corrected to key support at $15,000. And on top of that, a FVG (Fair Value Gap) formed above, which 99% of the time closes sooner or later.
⚙️ Metrics and indicators:
RSI - hit 16.9, which historically signifies an oversold zone and leads to at least a short-term bounce. The last time the RSI reached these levels, Ultima's price rose 469% in 2 months.
MACD - after a prolonged decline, is now approaching to converge and give a bullish cross section, historically signifying a return to an uptrend.
EMA - price has reached the 200 EMA level on the daily chart and is trying to consolidate above, as we all know, the first test of the 200 EMA in a bull market usually leads to explosive buy impulses.
Volume - the entire correction took place over the weekend on lower volumes, dropping gamblers with shoulders. Major buying followed as early as the weekdays with many times the volume.
🌐 Fundamental:
Ultima is a strong project with a good background in the form of a strong dev and marketing team. The token made it to the top 200 CMC in no time. Holds events all over the world and participates itself, presenting really good products like cryptocard.
And the freshly launched in April, trading bot has increased the trading volume of the token many times, which is perfectly visible on the chart. I think many traders were actively shorting at this time, because despite the huge volumes of buyers, there were no strong upward impulses, so now there is a lot of liquidity at the top. And as we know, the price of an asset moves from liquidity to liquidity, it is its fuel.
📌 Conclusion:
The token is now clearly undervalued by the market by all metrics and technical analysis. So it is expected at least a technical bounce, which it has already started by the way, to close the GAP in the range of $15,357 - $20,240.
I have gained a spot position in the support zone of $13,100 - $14,814, with an average entry price of $13,560 and expect at least a return to the listing peak level, at about $18,959, a consolidation above which would probably mean a new ATH.

BITCOIN Ultimate Cycle Zones breakdown! See when to sell!Bitcoin (BTCUSD) is extending its amazing rebound on its 1W MA50 (blue trend-line), having recovered all of the losses sustained following the U.S. - Chine Trade War. Based on this Cycle's pattern, this 1W MA50 rebound is technically the new Bullish Leg, essentially its 4th of this Cycle.
Among all this, we managed to identify another cyclical pattern, separating the Cycle in terms of Activity Zones:
Naturally its very bottom is what we call the 'Best Buy Zone' (green), where BTC's earliest and most optimal buy opportunities existed. That ranges within the 0.0 and 1.0 Fibonacci levels.
Above that it's the 'Final Buy Zone' (yellow) where in relative efficieny terms, the last long-term buy opportunities existed. That Zone consists of the 1.0 and 2.0 Fibonacci levels.
Third in line is the 'First TP Zone' (orange) where long-term investors who seek lower risk, can start taking profit on their positions. The range on that is the 2.0 - 3.0 Fibonacci levels.
Lastly it's the 'Fina TP Zone' (red) where obviously it is the last opportunity (and with the greatest return but also elevated risk) to take profits before the Cycle prices its Top. This consists of the 3.0 - 4.0 Fibonacci range.
As you may have noticed, each Zone has a .618 interval (highlighted in blue). Zone 1 has the 0.618 Fib, Zone 2 the 1.618 Fib, Zone 3 the 2.618 Fib and one 4 the 3.618 Fib. This is where (so far) the price has made a first consolidation - correction after the start of the new Bullish Leg and before it gets completed at the top Fib. The last such consolidation was from mid December 2024 to late January 2025 and as you see those tend to be significant marks.
This model shows that the current Bullish Leg should prepare us for the Final TP Zone and its first stop is the 3.0 Fib at $135k. This is the bottom of the Final TP Zone and the first region that long-term investors should consider taking profits. The key 3.618 Fib extension is at $210k and in our opinion is the absolute max level we should look to sell all positions as chronologically Cycle wise the trend falls there towards the end of the year, which is where all Cycles topped. A 4.0 Fib test is highly unlikely to take place within this Cycle, unless macroeconomic fundamentals (extreme adoption and/or monetary intervention) kick in and that sits at $280k.
But what do you think? Do you agree with this Zones break-down and if yes are you considering taking profits at 135000? Feel free to let us know in the comments section below!
-------------------------------------------------------------------------------
** Please LIKE 👍, FOLLOW ✅, SHARE 🙌 and COMMENT ✍ if you enjoy this idea! Also share your ideas and charts in the comments section below! This is best way to keep it relevant, support us, keep the content here free and allow the idea to reach as many people as possible. **
-------------------------------------------------------------------------------
💸💸💸💸💸💸
👇 👇 👇 👇 👇 👇

BTC to $116K before midnight!Bullish Pennant on Bitcoin 6H chart taking Bitcoin to $116,000.
This is only technical analysis and without the anticipation of May 22!

BTC on its way to 120-124k by first week of july BTC looks strong here, i have no doubts it will be a good summer for crypto, i think we have good altseason starting when btc dominace drop, i think 16 june will the altseason blow off date. but its good to load some alts now and hold till first week of july.
maybe we see a fake manipulation dump to support arround 98k before the take off,
things looking good let see top btc schould be at least 140k everyone says oktober but i think this time we will have a good summer and oktober will be the worst month and we continue the bullrun from nov 2025 till feb 2026. where btc print at least 140k

Bitcoin BTC Bullish Setup: Here’s What I’m Watching Next!Bitcoin (BTC) is looking incredibly strong right now on the higher timeframes 🔥. We’re seeing a clear bullish trend with consistent higher highs and higher lows, which keeps my bias firmly to the upside 🚀...
In this video, I take you through my full multi-timeframe analysis, breaking down:
- The macro bullish structure unfolding on the daily chart 🗓️
- My key levels of interest for a potential pullback entry 🎯
- What I’m watching for on the 4H and 1H charts to confirm continuation setups ⏱️
- My target zones, including recent swing highs and areas of liquidity 📍
If Bitcoin gives us a healthy retrace, I’ll be watching closely for a bullish break of structure to confirm a high-probability buy opportunity 🟢.
⚠️ Reminder: This is not financial advice — always do your own research and manage your risk appropriately. 🛡️💼

MSTU - Microstrategy 2x Leverage TargetsI feel like BTC will hit ATH soon, very soon. Likewise this leveraged ETF will likely run as well. I have mapped out some upper targets for the bulls. Plenty of room to run on the daily time frame. Not financial advice. DYOR.

BITCOIN Free Signal! Sell!
Hello,Traders!
BITCOIN keep growing in a
Strong uptrend but the price
Will soon hit an an all-time-high
Price around 109,400$ which
Is also a resistance from where
We can go short with the
Take Profit of 103,900$
And the Stop Loss of 109,739$
Sell!
Comment and subscribe to help us grow!
Check out other forecasts below too!
Disclosure: I am part of Trade Nation's Influencer program and receive a monthly fee for using their TradingView charts in my analysis.

BTC/USDT Long Trade SetupBINANCE:BTCUSDT.P
Entry 104460
SL 104100
TGT 106840
W Pattern Trade with Fibo 0.5 rejection

GOLD is showing the $300k way to BITCOINBitcoin / BTCUSD is currently on a strong rebound on its 1week MA50.
It's 1week chart looks identical to Gold's 1month chart. Both are Cup and Handle patterns and Bitcoin lags behind.
Gold has already made its final parabolic rally and nearly touched its 2.0 Fibonacci extension.
This shows that BTC's potential is extremely big, eyeing (if symmetry plays out to the end) $300000.
Follow us, like the idea and leave a comment below!!

Bitcoin (BTC) Market Update – May 19, 2025📅 Bitcoin (BTC) Market Update – May 19, 2025
BTC is trading at $105,488 with a slight +0.0115% 24h uptick.
📊 Technical Snapshot:
• Price Range: $102,381 – $106,540 (Moderate volatility)
• Support: GETTEX:97K – $98.5K | Resistance: $110K – $115K
• Trend: Consolidation Phase – Awaiting breakout
🔗 On-Chain Highlights:
• 87% of supply in profit = Potential for sell pressure
• Accumulation increasing across wallet cohorts
• Improved investor sentiment
🧭 Fundamentals to Watch:
• Sharpe Ratio: 1.72 – High risk-adjusted returns
• ETF inflows rising = Institutional demand
• Macro Index flashing Buy signal
📈 BTC Price Outlook:
• Short-Term: $100K – $110K
• Mid-Term: $110K – $129K
• Long-Term: $174K – $462K 🚀
✅ Summary:
Bitcoin remains range-bound but shows strength in accumulation and fundamentals. Keep an eye on $110K resistance for a possible breakout.
#Bitcoin #BTC #CryptoAnalysis #SorooshX

BTCUSD: Going for the decisive breakout that opens path to 155,0Bitcoin is almost overbought on its 1D technical outlook (RSI = 69.391, MACD = 3884.400, ADX = 20.801), which during rallies is the starting condition that fuels bullish breakouts and continuations. Such a breakout is about to take place right now as the price is on the LH trendline coming from the ATH. As this chart shows, once Bitcoin breaks over a LH trendline on this Cycle, it has always delivered (much) more upside. Assuming we are currently on the 0.5 Fibonacci level of that breakout, the pattern gives a TP = 155,000.
## If you like our free content follow our profile to get more daily ideas. ##
## Comments and likes are greatly appreciated. ##

ADA (Cardano) – Long Swing Setup from Major Support ZoneADA is currently trading within a critical support area ($0.71–$0.73), offering a compelling higher low opportunity. With BTC holding strength, ADA may be gearing up for a rebound, particularly if it maintains structure above the support.
🔹 Entry Zone:
$0.71 – $0.73
🎯 Take Profit Targets:
🥇 $0.80 – $0.84
🥈 $0.98 – $1.02
🛑 Stop Loss:
Daily close below $0.66 (loss of higher low and structural invalidation)

LINK (Chainlink) – Breakout Setup Aligned With BTC Macro MoveWith BTC on the verge of a new all-time high, the market is poised for high-beta altcoins like LINK to follow with strength. LINK is currently testing the 200-day EMA — a critical momentum indicator. If BTC confirms breakout and LINK holds this zone, it sets up a high-probability continuation play.
🔹 Entry Zone:
$16 (on confirmation of support at 200-day EMA)
🎯 Take Profit Targets:
🥇 $20 (prior range high / psychological resistance)
🥈 $25 (multi-month breakout level)
🥉 $30 (macro extension target)
🛑 Stop Loss:
Daily close below $14.50 (breakdown of EMA support and invalidation of current structure)

4H Bitcoin Chart - What's Next?Bitcoin is currently trading near $105,000, fresh off a historic milestone where it crossed $100,000 for the first time last Wednesday, peaking at an all-time high of $104,000. This breakthrough past the six-figure mark is a big deal, it’s a psychological level that many traders have been watching for years.
Since hitting $104,000, Bitcoin’s price hasn’t just kept climbing, it’s taken a breather. On the 4H timeframe, we’ve seen some back-and-forth action, with the price pulling back from its peak to test lower levels before stabilizing around $105,000. This pullback isn’t unusual after a big breakout; it’s Bitcoin’s way of catching its breath. The chart shows a pattern of higher highs and higher lows over recent weeks, which keeps the uptrend intact, but the latest consolidation hints that the market is deciding its next move.
Key Levels:
The $104,000 mark, the recent all-time high, is now a resistance level (Bitcoin will need some serious buying power to push past it again). On the flip side, $78,000 is a major support level; if the price drops that far, it could signal trouble for the bulls. Closer in, $100,000 might hold as support now that it’s been conquered, while $90,000 and $94,000 could act as stepping stones for any dips or bounces in the near term.
Bitcoin’s price is dancing around its 50, 100, and 200-period moving averages. This clustering suggests a tug-of-war between buyers and sellers, with no clear winner yet. The Relative Strength Index (RSI) has cooled off, dropping to levels we last saw when Bitcoin dipped below $78,000. This could mean the market’s a bit oversold, setting the stage for a bounce if buying picks up. For now, the price ranging near these moving averages might be building a foundation for the next big push.
Market Sentiment:
The vibe around Bitcoin is a mixed bag right now. On one hand, there’s optimism, big inflows into BTC ETFs since the U.S. election and talk of a new SEC chief have people feeling bullish. On the other hand, some traders are cautious, pointing to a bearish RSI divergence on the 4H chart and warning of a possible correction if support levels crack. It’s a classic case of hope versus hesitation, and the chart reflects that uncertainty as Bitcoin hovers in this consolidation zone.
Wrapping it up, Bitcoin at $105,000 is in an interesting spot on the chart. The uptrend is still alive with those higher highs and lows, but this consolidation phase could go either way. If the RSI and moving averages hint at a reversal, we might see a run toward $104,000 or beyond. But if $78,000 gives way, a deeper pullback could be on the cards, keep $90,000 and $94,000 in sight as potential pit stops. Stay sharp and watch these levels, because Bitcoin’s next move could be a big one.

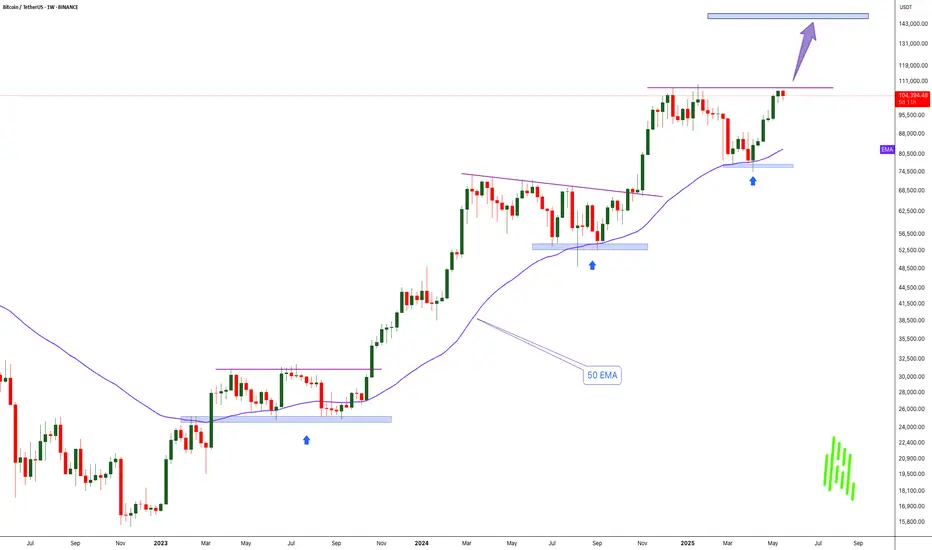
History Repeats: Bitcoin Bounces from Weekly 50 EMA-$150K Next!!MARKETSCOM:BITCOIN continues to show exceptional strength and bullish momentum. If we look back at the charts from 2023 and 2024, a clear pattern emerges — every time BINANCE:BTCUSDT touched the 50 EMA on the weekly chart, it led to a significant rally and eventually new all-time highs. That same setup seems to be unfolding again right now.
Recently, COINBASE:BTCUSD tested the 50 EMA around the $75,000 level and has since bounced strongly. The price has reclaimed the $100,000 mark and is now challenging previous all-time high resistance. Historically, after a successful bounce from this key moving average, Bitcoin hasn’t just recovered — it’s exploded to new highs.
Based on this repeating pattern, our current cycle target is set at $150,000. A clean breakout above the current resistance zone could be the catalyst that propels BYBIT:BTCUSDT Bitcoin into uncharted territory once again. The structure remains bullish, momentum is building, and the trend clearly favors the upside.
This is a classic “Buy and HODL” moment. The technicals are aligning, the market psychology is shifting, and all signs point toward a continued bull run. Buckle up — it looks like we’re in for another legendary Bitcoin rally.
Bitcoin vs Resistance Zones | Fake Breakdown Below the Channel!Bitcoin ( BINANCE:BTCUSDT ) has been moving up and down with high momentum over the past 24 hours and finally fell below the lower line of the ascending channel . Is this break of the lower line of the ascending channel valid?
Bitcoin is trading near the Resistance zone($105,100-$104,140) , Cumulative Short Liquidation Leverage($104,478-$103,941) . Since the volume of breaking of the lower line of the ascending channel is NOT high, the probability of a fake break is very high (in my opinion).
In terms of Elliott Wave theory , the structure of the main wave 4 seems to be an Expanding Flat(ABC/3-3-5) . The main wave 5 could lead to the formation of a new All-Time High(ATH ).
One of the reasons why I think we saw a Fake Break below the lower line of the ascending channel is that I think the S&P500 Index ( SP:SPX ) will trend upward , and given the high correlation between Bitcoin and S&P500 Index these days, we can expect Bitcoin to increase .
I expect Bitcoin to start rising again AFTER breaking the Resistance zone($105,100-$104,140) and touch the targets I have indicated on the chart.
Note: If Bitcoin touches $101,800, we can expect more dumps.
Please respect each other's ideas and express them politely if you agree or disagree.
Bitcoin Analyze (BTCUSDT), 1-hour time frame.
Be sure to follow the updated ideas.
Do not forget to put a Stop loss for your positions (For every position you want to open).
Please follow your strategy and updates; this is just my Idea, and I will gladly see your ideas in this post.
Please do not forget the ✅' like '✅ button 🙏😊 & Share it with your friends; thanks, and Trade safe.
