BTC UpdateLooking at historical data, we’re at a similar point as in 2021 — diverging RSI, declining volume, and signs of exhaustion. The key difference now is the level of institutional involvement: hedge funds are heavily in, MicroStrategy keeps buying, and even nation-states have exposure.
Despite the bullish narrative, I believe we’re heading down.
Price action isn’t convincing — we're still trading below the January monthly candle close, volume is drying up, and RSI continues to diverge. Each 5–10% pump is followed by a sharp spike in open interest (OI), then a brutal liquidation cascade wiping out $500M–$1B. This is starting to look like a leveraged casino, not a healthy uptrend.
That said, I wouldn’t rule out a final wick toward $120K to trap late longs and suck in liquidity before the real move down.
I called the top after the January rally — they called me a madman. Still, I was right.
Mastery tends to be a funny thing, seems like on a long enough timeframe you cant lose.
Stay safe everyone.
Btc!

PENDLEUSDT → Resistance retest. One step away from distributionBINANCE:PENDLEUSDT is preparing for distribution after a prolonged consolidation. The price is testing a key resistance level, which, if broken, will trigger a rally...
The coin is breaking through the flat resistance and consolidating above the upper border of the range. The key level is 4.400. If the bulls hold their ground above this level, the growth may continue.
Bitcoin is showing bullish dynamics, which supports the altcoin market. The bullish trend may continue in altcoins as well. Pendle may move from consolidation to distribution.
Resistance levels: 4.32, 4.400
Support levels: 4.024, 3.622
If the coin manages to consolidate above the key resistance level, thereby confirming the breakout, the price may move to aggressive growth. In this case, the target could be 4.800.
Best regards, R. Linda!

Hanzo / Btc 15m Path ( Confirmed Breakout Zones )🔥 BTC – 15 Min Scalping Analysis (Bearish Setup)
Bias: Waiting For Break Out
Time Frame: 15 Min
Entry Type: Confirmed Entry After Break Out
👌Bullish After Break Out : 105770
👌Bearish After Break Out : 105140
☄️ Hanzo Protocol: Dual-Direction Entry Intel
➕ Zone Activated: Strategic Reaction from Refined Liquidity Layer
🩸 Momentum Signature Detected:
Displacement candle confirms directional intent — AI pattern scan active.
— If upward: Bullish momentum burst.
— If downward: Aggressive bearish rejection.

Hanzo / BTX 15m Path ( Confirmed Breakout Zones )🔥 BTC – 15 Min Scalping Analysis (Bearish Setup)
Bias: Waiting For Break Out
Time Frame: 15 Min
Entry Type: Confirmed Entry After Break Out
👌Bullish Reversal : 103000
👌Bearish After Break Out : 102000
☄️ Hanzo Protocol: Dual-Direction Entry Intel
➕ Zone Activated: Strategic Reaction from Refined Liquidity Layer
Marked volatility from a high-precision supply/demand zone. System detects potential for both long and short operations.
🩸 Momentum Signature Detected:
Displacement candle confirms directional intent — AI pattern scan active.
— If upward: Bullish momentum burst.
— If downward: Aggressive bearish rejection.
💯 Market Zone: Transition Phase
Asset in premium-to-discount (or vice versa) range — valid for both reversal and continuation trades. Execute with precision.

Bitcoin Hourly Analysis (2H)Given Bitcoin's rapid movement near previous highs, along with quick pump-and-dump action and liquidity grabs, it's expected that the liquidity pool below the price will be swept, collecting orders from the green zone, and then price may reverse back to the upside.
A 4-Hour candle closing below the invalidation level will invalidate this analysis.
For risk management, please don't forget stop loss and capital management
Comment if you have any questions
Thank You

That's where the $BTC 2017 vibes are felt!As we mentioned before, the current cycle that Bitcoin is in is exact

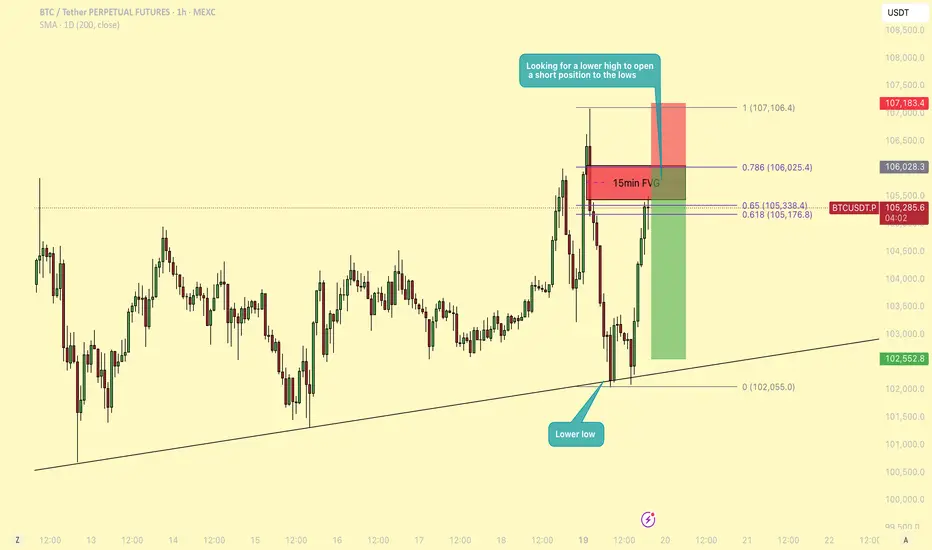
BTC - Will BTC revisit $102k or is a pump imminent?Bitcoin (BTC) has been in a consolidation phase for an extended period, marked by a lack of strong directional momentum and characterized by ranging price action. This type of market environment often leads to both liquidity grabs and choppy movement, and traders need to remain especially vigilant about key levels and structure shifts.
Liquidity grab
Yesterday, BTC managed to sweep the recent highs, grabbing liquidity above a short-term resistance zone before reversing and moving lower. This move appears to have been a classic stop-hunt or liquidity sweep, which was followed by a strong rejection. As price moved down from those highs, it left behind an unfilled gap on the 15-minute chart, what many refer to as a Fair Value Gap (FVG). This gap now acts as a magnet for price and is a key area to watch as we approach it again.
Market structure
On the 1-hour timeframe, BTC has now printed a lower low, suggesting a short-term shift in market structure to the downside. This structural break opens up the possibility for a lower high to form, setting up a classic trend continuation scenario. From a technical standpoint, the expectation would be for BTC to now create a lower high and then push lower, potentially targeting the range lows from yesterday and today. This provides an opportunity for a short setup with a favorable risk-to-reward (RR) ratio, estimated to be around 3:1, if the entry and stop are managed around the key resistance and structural levels.
Fibonaccy that aligns with the FVG
Currently, BTC is sitting at the Golden Pocket, the region between the 0.618 and 0.65 Fibonacci retracement levels. This area often serves as a reaction zone for price, and we are seeing some hesitation here. Interestingly, this Golden Pocket sits just below the aforementioned 15-minute FVG, and price appears to be gravitating toward this inefficiency, potentially looking to fill it before making a more decisive move.
What adds to the confluence at this level is the 0.786 Fibonacci retracement, which aligns almost perfectly with the top boundary of the Fair Value Gap. While many traders look to enter short positions at the 50% mark of the FVG, this added confluence makes the 0.786 + FVG top zone a more compelling entry point. This would allow for a tighter stop just above the gap or structure high, and thus improves the risk-to-reward ratio slightly compared to a more conservative FVG entry.
Conclusion
In summary, the plan would be to wait for BTC to either fill the FVG and reach the 0.786 level or show strong rejection signs there. A rejection from this zone would confirm the lower high thesis and offer a solid short setup aiming for a move back to the range low. With the current setup, market structure, and confluence levels lining up, this trade idea presents a tactical opportunity with clear invalidation and high RR potential.

Can BTC touch 110k today?Well if it closes 107.1k then stances change, as of now, 102.5k is what it looks delicious as per chart drawn ~~ Thank you!!

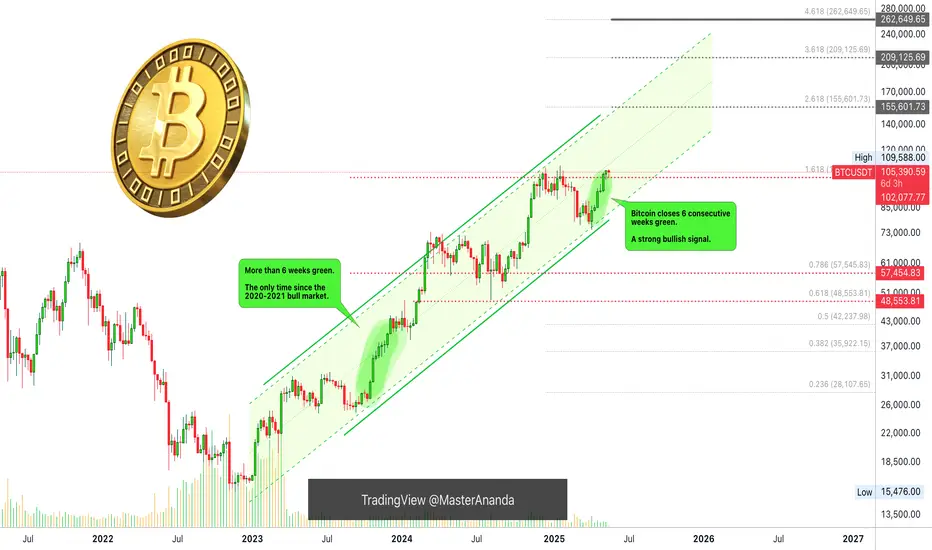
Altcoins: Bitcoin Daily Turns Bullish, New All-Time High But...New All-Time High but how high? How high is Bitcoin set to move in this breakout as a the new All-Time High? How high is Bitcoin set to continue in May that still has 12 days left and what about June and July 2025?
What happens after June-July 2025 and what happens in late 2025?
What's the map? How high comments section below—yes?!
Bitcoin is now challenging the "final resistance." This is truly the final resistance because we are in the 2025 bull market. There are many things happening around this final resistance. For example, the Altcoins market.
The Altcoins market goes bullish when Bitcoin grows above 100K yes? Yes it did/does and has been growing for an entire month many pairs are up 70% to 100% some are up 400% and this is only the start but, think of this... What happens when Bitcoin hits a new All-Time High?
For Bitcoin this isn't much, the ATH is at $109,588 and a new All-Time High is $110,000 but what about the Altcoin? Magic!
When Bitcoin hits a new ATH it goes on all media all screens and nobody can deny it is happening because it is happening and the market is full green. This creates boom, interest and many people trade only when resistance breaks. The Altcoins will boom growing 2-3 levels up within days. The bottom forever gone massive profits, lives changing and this is only the start.
The first level of importance as Bitcoin moves in price discovery eventuality and territory and market conditions—change, grow, win—sits around $120,000 and $130,000. This is the level to watch for.
Some people are saying a massive correction at this point more like a normal correction or maybe nothing for a few reasons that I will explain below.
The next range is $150,000 and $160,000 and here is the thing. If Bitcoin is going to $180,000-$220,000, then the correction cannot happen at 120/130K. It needs to happen on the second level around 150/160K, do you understand?
If the strong mid bull market correction happens at $120,000-$130,000 this is bad news because the final market cycle top gets lowered. If it happens later we have $180,000, $200,000, $220,000 or more. And this is the interesting part and what we want.
We are still in May month #5 and the minimum we can expect growth is until November month #11 which gives us 6 months. 6 months of straight up is a very long time. With a 2-3 months correction now it isn't that long.
These are the things that we need to consider but aim high because Bitcoin will always surprise.
Minimum, you can aim for $180,000 as the cycle top—minimum. Go higher leave a comment and with the excitement, euphoria and the first time since 2021 seeing so much growth, institutional adoption, Trump, Saylor, El Salvador think $220,000 can you see how that works? Comment below.
Things are bright for Cryptocurrency holders know why now think in this way. Your life can change forever if you take the right action following the right steps in the next 6 months. Imagine a lifetime of profits secured in this bull market bull run. The choice is yours.
It can happen of course, it has happened many times and will continue to happen but we have to be smart. It is happening now but we are early this time we have experience and we know exactly what will happen. It is not a question of if but when. When? In late 2025.
Thank you for reading.
Your comments show your continued support and helps activate the bots to do the same. Show them some love!
Namaste.

Check support near 104984.57
Hello, traders.
If you "Follow", you can always get new information quickly.
Have a nice day today.
-------------------------------------
(BTCUSDT 1D chart)
OBV indicator is showing signs of rising above High Line.
Therefore, the candle body color has changed to dark green (#00332a).
Therefore, the key is whether it can be supported near StochRSI 80 (104984.57) and rise above 10613.74.
If it falls,
1st: 104463.99
2nd: 102302.08
You should check whether it is supported near the 1st and 2nd above.
-
If it is supported near 104984.57, it is likely to rise, but since the volatility period continues until May 20 (up to May 28), it is recommended to check whether it is supported.
Therefore, the point of observation is whether the price can be maintained above 102302.08 even after the volatility period.
-
Thank you for reading to the end.
I hope you have a successful trade.
--------------------------------------------------
- Explanation of the big picture.
I used TradingView's INDEX chart to check the entire range of BTC.
I rewrote it to update the previous chart by touching the Fibonacci ratio range of 1.902 (101875.70) ~ 2 (106275.10).
(Previous BTCUSD 12M chart)
Looking at the big picture, it seems to have been maintaining an upward trend following a pattern since 2015.
In other words, it is a pattern that maintains a 3-year upward trend and faces a 1-year downward trend.
Accordingly, the upward trend is expected to continue until 2025.
-
(Current BTCUSD 12M chart)
Based on the currently written Fibonacci ratio, it is displayed up to 3.618 (178910.15).
It is expected that it will not fall again below the Fibonacci ratio of 0.618 (44234.54).
(BTCUSDT 12M chart)
Based on the BTCUSDT chart, I think it is around 42283.58.
-
I will explain it again with the BTCUSD chart.
The Fibonacci ratio ranges marked in the green boxes, 1.902 (101875.70) ~ 2 (106275.10) and 3 (151166.97) ~ 3.14 (157451.83), are expected to be important support and resistance ranges.
In other words, it seems likely that they will act as volume profile ranges.
Therefore, in order to break through these ranges upward, I think the point to watch is whether they can receive support and rise near the Fibonacci ratios of 1.618 (89126.41) and 2.618 (134018.28).
Therefore, the maximum rising range in 2025 is expected to be the 3 (151166.97) ~ 3.14 (157451.83) range.
In order to do that, we need to see if it is supported and rises near 2.618 (134018.28).
If it falls after the bull market in 2025, we don't know how far it will fall, but based on the previous decline, we expect it to fall by about -60% to -70%.
Therefore, if it starts to fall near the Fibonacci ratio 3.14 (157451.83), it seems likely that it will fall to around Fibonacci 0.618 (44234.54).
I will explain more details when the bear market starts.
------------------------------------------------------

Bitcoin: Top Altcoins Choice —Your Pick (Session 7)We've identified Bitcoin's strongest support in this current cycle thanks to some long-term numbers I extracted when calculating the size of the 2021-2022 bear market.
These numbers have been working great on a long-term basis so we can continue to use them moving forward.
You could extract these numbers right on November 21 2022 and see how good they have been working:
— The August 2024 low matched perfectly the 0.618 Fib. on the chart.
— The new All-Time High, final resistance and now support matches perfectly the 1.618 Fib. level on this chart.
— Bitcoin's next strong resistance zone sits at 2.618 Fib. or $155,601.73. If you really need an intermediary level before 155K, you can consider $137,000. This is another relevant resistance.
— We know now for certain that the strongest support ever for this moment now is $102,000. As long as Bitcoin trades above this level, ultra-bullish confirmed. Wow, if it moves and closes below.
Top Altcoins Choice —Your Pick (S7)
This time, let's do it differently. I only need your choices to find some interesting pairs, to look at something different.
Go to the comments section and share ALL your favorite Altcoins. Can be the ones you like most, the ones you trade, the ones you hate, the ones you love, the ones you see with huge potential or the ones you want me to look at for any purpose.
I will pick and choose and publish in my profile those that look good. I will also reply in the comments with an analysis if I reach my publishing limit for the day.
I need your support. Which one is your TOP ALTCOIN CHOICE? (TAC!)...
Comment below!
Namaste.
BITCOIN → Consolidation in a triangle amid a BULLISH TRENDBINANCE:BTCUSDT is consolidating. A symmetrical triangle is forming against the backdrop of a bullish trend. Given the current technical nuances, we can bet that this consolidation is forming with the aim of continuing growth...
Fundamental nuances have gradually improved over the past few weeks, and the cryptocurrency market has revived slightly. Technically, I like the market structure on D1. After strong growth, the price is not going to fall, consolidation is forming. The market is bullish, after 2-3 weeks of consolidation, a bullish distribution is forming. The cycle has repeated itself twice. On D1, you can see how long tails are forming downward within the consolidation, indicating that whales are buying up all attempts to fall, keeping the market away from risk zones. Accordingly, at the moment, I would say that consolidation may continue for some time, and I do not rule out an attempt to retest the triangle support before growth, or entry into a deeper zone to retest the distant liquidity zones of 101400 and 100700 before continuing growth.
Resistance levels: 103.6, 104.4, 105.0
Support levels: 102.5, 101.4, 100.6
A decline can be considered if the price breaks the triangle support and sticks to 101400, forming a pre-breakdown consolidation (if there is no upward rebound).
However, at the moment, intraday trading can be considered, i.e., from the consolidation boundaries. A signal to exit the consolidation upwards and continue growth will be consolidation between 103.5 and 105.0 and compression towards the upper boundary.
Best regards, R. Linda!

Fancy a cup of tea luv?This is the story of how Susan convinced her husband Frank to buy 3 Bitcoins at 105k..
Plus the story of Bitcoin going to a minimum of 126k before the end of May!
A giant Cup & Holder beginning way back in 2021 is a 75% sure prove of that!
What more do you need Frank!?
That's good odds right there for ya!

Solana – Speculative Long Trade Setup Ahead of Narrative CatalysDespite BTC and ETH rallying, SOL has lagged, making it a potential rotation play as capital moves across majors. With attention building around the Internet Capital Markets narrative, SOL may soon attract speculative inflows, especially given its historical performance during sector-wide momentum shifts.
🔹 Entry Zone:
$152 – $154
🎯 Take Profit Targets:
🥇 $172 (local resistance / prior rejection zone)
🥈 $181 (next HTF resistance and possible momentum breakout zone)
🛑 Stop Loss:
$144 (invalidates current short-term bullish structure)

BTC at a Critical Crossroad – Red Channel is the Last Standhello guys! let's review what happened in btc and what could happen!
📉 1. Blue Ascending Channel Broken:
Bitcoin has decisively broken below the blue ascending channel, signaling a shift in momentum from bullish to neutral/bearish.
🟥 2. Red Channel Holding as Support (For Now):
Despite the drop, the red ascending channel is still intact and currently acting as support. Price is consolidating right at its lower boundary.
⚠️ 3. If Red Channel Breaks – Expect Strong Downward Move:
A confirmed breakdown below the red channel would likely trigger a significant bearish move, potentially pushing BTC towards the GETTEX:97K - $96K support zone and possibly lower.
🧭 Conclusion:
We’re at a decision point. If bulls fail to hold the red channel, it could open the door to deeper correction.

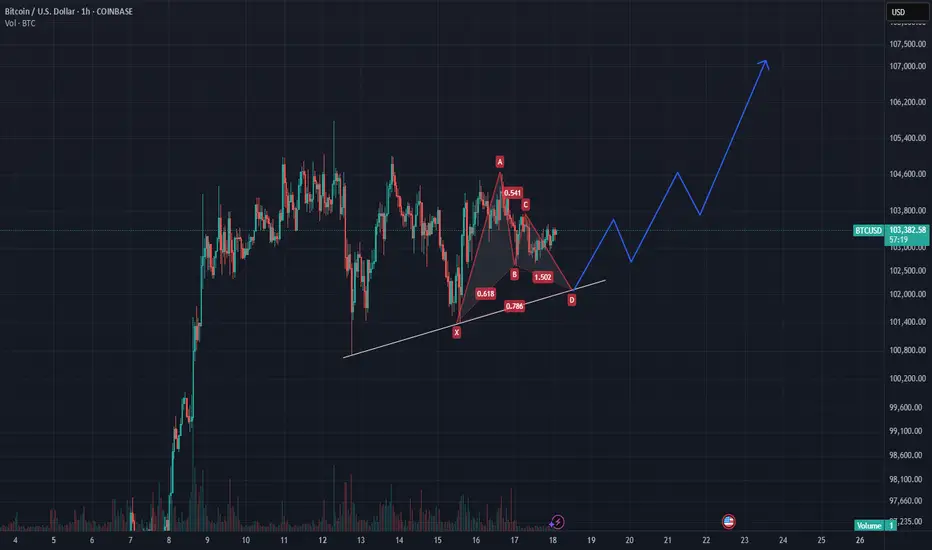
BTC Bullish Deep CrabAn idea to display an potential Deep Crab idea. This might hit the support line at 98k that was the last resistance from the last rally. Whether this holds is another story. Thank you

BTC Bullish GartleyAn idea to display an potential Gartley idea. This might hit the trendline that is upsloping. Whether this holds is another story. Thank you
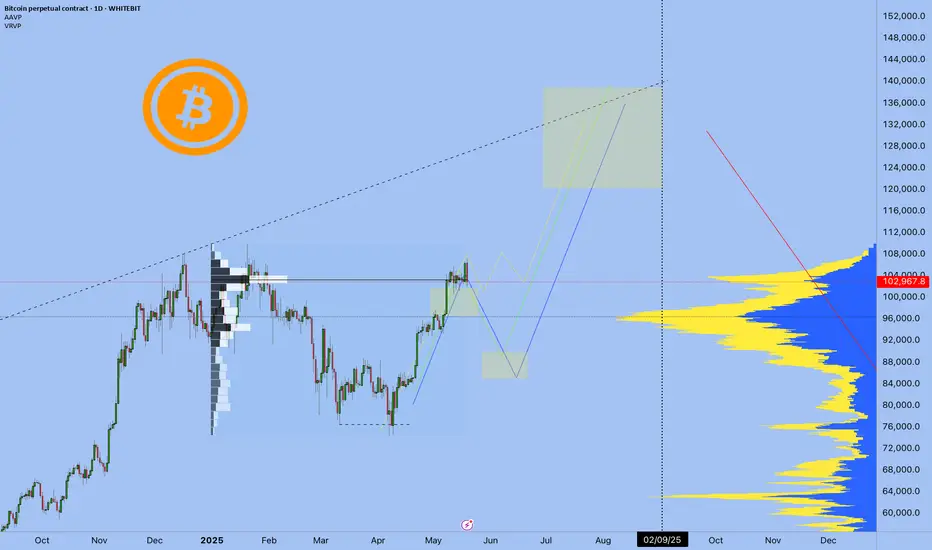
BTCUSD 19.05.2025 Bitcoin Navigator: BTC Update (May 2025)So the offline tournament is over, I took third place, and I just got back into work mode
In my previous publication ( link ), I outlined possible scenarios for Bitcoin’s price action, leaning towards a correction from around the $98-101k zone down to approximately $88k.
However, the current market situation demonstrates the most optimistic scenario (highlighted in yellow on the chart). At the moment, we're seeing Bitcoin consolidating within a clear range, likely preparing for an upward breakout without a significant correction. This scenario is certainly the most bullish one, yet my inherent skepticism doesn't exclude the possibility of a correction before we reach a new all-time high (ATH).
📌 Key points in the current market situation:
The main question now is not whether we'll achieve a new ATH (as this seems almost inevitable) but rather how we'll get there.
Two scenarios are on the table: a smooth upward trajectory without substantial corrections, or an initial correction followed by a strong breakout.
🔖 Profit Maximization Strategy:
Many traders are shifting their attention towards altcoins, tempted by potentially greater returns. However, it's crucial to remember that higher upside potential also means significantly higher risks (low liquidity, increased manipulation, higher volatility).
I have already chosen the tokens that I am interested in for long time
Also now a new narrative has appeared, Internet Capital Markets (ICM) tokens. If you are interested, write in the comments "interesting ICM"
Best regards EXCAVO
BRIEFING Week #20 : ETH Reversed, WTI Next ?!Here's your weekly update ! Brought to you each weekend with years of track-record history..
Don't forget to hit the like/follow button if you feel like this post deserves it ;)
That's the best way to support me and help pushing this content to other users.
Kindly,
Phil

BTCUSDT - fractal from ATH I think this is a classic pattern now, and we are repeating the situation in the same price range that we had half a year ago when the ATX was forming. That is, we will not update the high or will do it a little bit, and after that we will go to the zone of 93 thousand plus minus and from there will be a significant reversal to 102 thousand, after that it is difficult to predict what will happen next. Either strongly down or strongly up, until then we can safely work on the fractal and after that I will give an update of the idea.

19/05/25 Weekly OutlookLast weeks high: $105,46
Last weeks low: $100,751.75
Midpoint: $103,372.10
In my weekly outlook post from last week I mentioned how there was a clear pattern of consolidation with a tight range for a week with a week of expansion that followed, and that if the pattern were to continue we would see BTC consolidate around the weekly high. The theory was proven correct on this occasion with a tight range between weekly high and the 0.75 line, as theorized with only momentary dips below the 0.75 line. Now if the pattern were to continue this week would be expansion week, but for me this time it's slightly different as BTC approaches ATH there is a massive level of resistance just above this weeks weekly high. We've seen an initial early attempt to breakout above weekly high and that attempt has so far failed quite aggressively, which leads me to believe there will be volatility this week as both bulls and bears contest this very important area of the chart.
For the bulls maintaining momentum and breaking into price discovery with acceptance above $109,000 would be incredibly, the headlines will read new ATH, FOMO kicks in and retail follows etc, we know the drill. For the bears the objective is to hold the line and reject weekly high ($106,000) at all costs and print a strong SFP and unfortunately this does seem viable with $97,000 being the target area IMO. RSI on the daily is around the overbought level, combined with key resistance level a pullback would make sense.
For me this week I want to see how ETH and other major alts react to any pullback, do they get bought up with purpose? Is the structure strong to maintain this move or is this a HTF lower high? An interesting week coming up I'm sure.
Good luck this week!

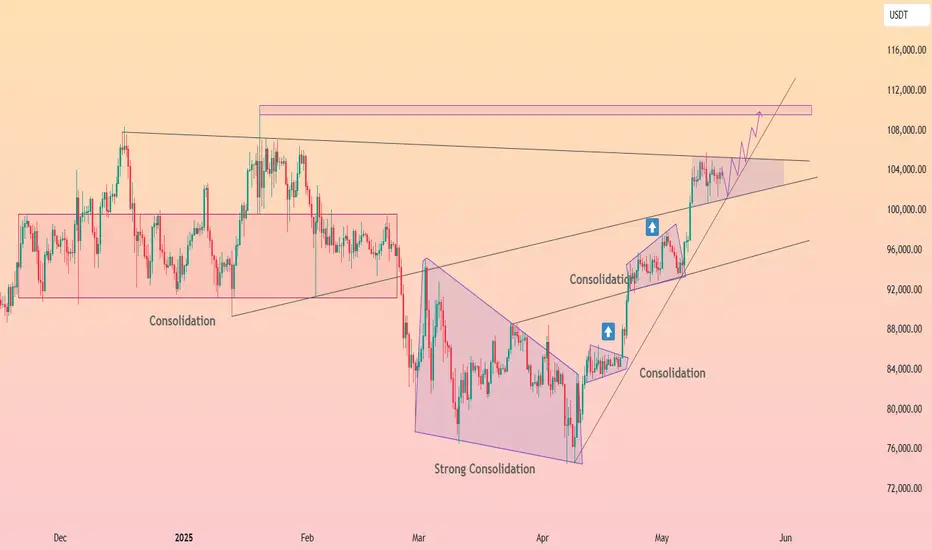
HolderStat┆BTCUSD channel grind toward 110 kCRYPTOCAP:BTC price has stair-stepped out of March’s strong consolidation triangle and is now travelling inside a neat rising channel. Each mini flag has resolved higher, with the latest squeeze holding the mid-line near 102 k. As long as that trend-line underbelly and the diagonal support from April lows remain intact, bulls retain control and can probe the 108-110 k supply zone highlighted on the chart. Only a daily close back inside the lower rail would threaten the current bullish momentum.