btc . w4 . may . wOpen . LONGto catch everyone of guard, whom thinks we're crashing today:
. LONG: look for good tpo at nyOpen, of running aLow and pump to liquidate and grab liquidity
. SHORT: still on the table - but the LONG could be a runner
Btc!

btc . w4 . may . wOpen . SHORTideally :
. good tpo and price not finding a floor during ny
SHORT
. ladder limits
. start pw.0.5
. end pwVAH - pdEQ
. withhold 30% of total order to add upon trade confirmation
. tp1 +1.5%
. tp 2 . mOpen . 94133.6 + 9%
- ride the momentum shift downwards

Bitcoin Not Looking Good At AllSome degree of 5 waves completed yesterday and reversal signs are there. Now, this 5 waves up could be just 1st leg of larger 5th or the 5th itself since this leg was 2.6 times of leg 1. Either way, we are heading towards 90K and if this was larger 5th that got complete then it's time for "serious worry", specially if you are a HODLer.

Bitcoin Entry & Risk Management Zones:
Entry Zone: 102,600 USDT (highlighted in orange)
Stop Loss (S/L): 101,500 USDT (red zone)
Take Profit (TP) Levels:
TP1: 103,750
TP2: 104,600
TP3: 105,500
TP4: 106,600
TP5: 108,200
------------------------------
After reaching TP1 - shift stop to entry

Deeper retracement is possible. 104-105.2 for short entryMorning folks,
So, last setup worked just partially - action started from 101K as suggested but BTC completed only 1.27 butterfly target, showing sharp reversal.
Current reversal is important because market is neither on some target, resistance or overbought. It means that reversal is driven by external factors. Although our long-term bullish view is still valid, with "at least" 110K target, the road to the target might be bumpy, with moderate pullback first.
It means that right now weekly/daily traders should sit on the hands and wait when retracement will be over. While daily/intraday traders could consider short entry from 104-105.2K resistance area by our view.

$BTC - Lower Timeframe OutlookCRYPTOCAP:BTC | 1h
Didn't expect such a strong rejection, another push back to 107k now seems unlikely
If we get a reaction at 102k to 101.5k ( val) , we might see a complacency bounce into 104.5k–105.3k to fill some inefficiencies.
That'd be a solid short, targeting 95k–94k

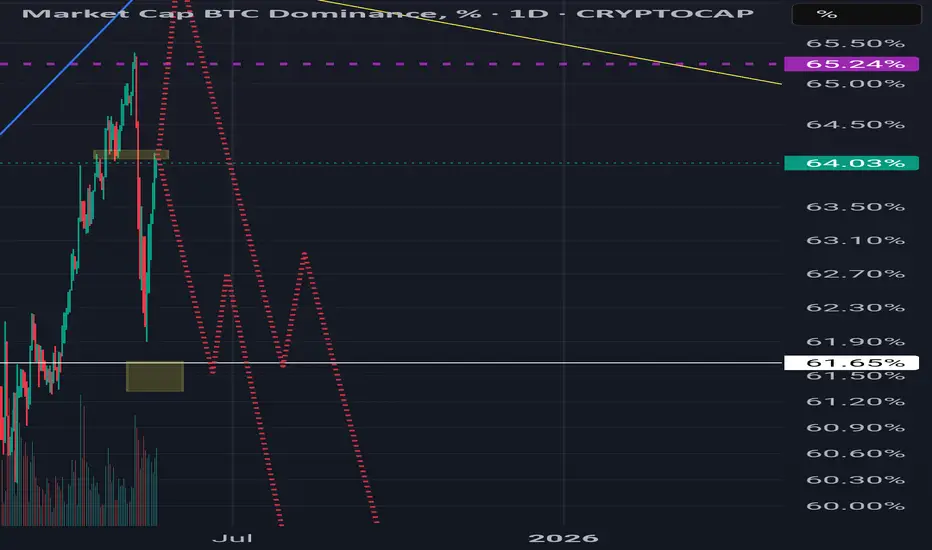
2025.05.19 bitcoin analysis
Here is the current Bitcoin chart.
The daily ascending trendline previously mentioned has now been broken.
However, I still believe there is a chance for a rebound because the support zone around 102,500 (highlighted with the purple circle since May 16th) is still holding.
From my perspective, a minor rebound is underway, but I expect Bitcoin to drop down to the red box zone, which was the previous consolidation area after the uptrend.
Whether this red box zone holds or not will be crucial.
If it breaks down, as mentioned yesterday, there’s a high chance of further correction toward 100,678 → 98,800 → 94,450.
Conclusion:
The daily uptrend line is broken. (As this is a very critical zone, I personally recommend closing positions if in profit.)
A bounce occurred from the support zone, but if it comes down again, it may break the previous low and head toward 100,678.
A break below 100,678 would likely signal a full trend reversal.

BITCOIN CORRECTION AHEAD|SHORT|
✅BITCOIN keeps growing in a
Strong uptrend in a narrowing
Bearish wedge pattern and the
Coin has reached a horizontal
Resistance level of 108000$
So IF we see a breakout from
The wedge a local bearish
Correction is to be expected
SHORT🔥
✅Like and subscribe to never miss a new idea!✅
Disclosure: I am part of Trade Nation's Influencer program and receive a monthly fee for using their TradingView charts in my analysis.

Bitcoin Retests Ascending Trendline After BreakoutBTCUSD daily chart shows price action respecting a rising trendline, following a successful breakout from previous pattern. This ascending trendline now acts as a key dynamic support and serves as a central guide for the medium-term bullish structure.
Currently, price is consolidating just below the $107,000 resistance area. There are two primary scenarios to consider:
Bullish Scenario:
A confirmed breakout and daily close above the $107,000 resistance could trigger another bullish leg, targeting the next level near $120,000.
Mild Bearish / Pullback Scenario:
If the price gets rejected again, it may retrace towards the ascending trendline around $95,000, which aligns with previous horizontal support and could serve as a solid buy-the-dip zone.
Trade Plan:
Buy Entry Option 1: On a breakout above $107,000 → Target: $120,000
Buy Entry Option 2: On a bounce from the trendline near $95,000

$BTC up to $107-108k?While I do think CRYPTOCAP:BTC will ultimately still see a larger correction, I can't deny that the chart looks bullish here.
I think we're likely to see a final move over the next week or two up to $107k-108k to retest the prior highs. I think the middle resistance at $108,183 is the most likely target for the move.
After we hit that, that's where I'll start to position short on BTC.
Let's see how it plays out over the next week or two.

$SPY Daily Chart Taz Plan - May 2025 into June-July Breakdown📉 SPY Daily Chart Trading Plan — May 2025
Thesis:
Price has returned to the exact level ($594.20) where the February impulse breakdown began. This zone is acting as a Lower High rejection within a broader bearish structure. A clean rejection here opens the door to multiple inefficiency fills below.
🔍 Structure Breakdown:
Feb High (ATH): $613.23
Feb Open: $592.67
Feb Close (last green candle before impulse): $594.20
Current Price: $594.20
Marked LH: $592.50
This is a rally back into rejection, not strength.
📉 Key Zones & Gaps:
🔺 Gap Supply: $566.48 – $578.50
🔺 Wick Gap: $558 – $566 → Needs a full-body candle to initiate fill
🟥 FVG (4/22): $528 – $541.52
🧱 Major Support: $481.80
🧠 Trade Plan:
Short Entry 1 (Confirmation-Based):
🔻 Red candle rejection under $592.50 = starter short
🔻 Watch RSI and MACD for momentum fade
Short Entry 2 (Gap Breach):
🔻 If $578 is broken and retested → scale in
🔻 Gap fill expected quickly once triggered
Short Entry 3 (Wick Gap):
🔻 Body close through $558 = last add
🔻 Sets up for final flush to FVG
🎯 Targets:
$578.50 → $566.48 (Gap Fill)
$558 → $541.52 (Wick Gap & FVG Top)
$528 – $530 (FVG Close)
$481.80 (Long-Term Panic Target)
❌ Invalidation:
Daily close > $595.50 = Pause thesis
Weekly close > $600 = Structural shift, short squeeze zone
🧠 Final Thoughts:
This isn’t just a gap fill play — it’s a structural fade from a lower high back into memory. The Feb impulse wave left behind layers of inefficiency, and price just tapped the origin of the breakdown.
Momentum is peaking. If this is a trap, the downside should begin immediately.
Let the chart prove it.

Heading into pullback resistance?Bitcoin (BTC/USD) is rising towards the pivot which has been identified as a pullback resistance and could reverse to the 1st support which. is also a pullback support.
Pivot: 108,391.05
1st Support: 98,383.98
1st Resistance: 119,108.79
Risk Warning:
Trading Forex and CFDs carries a high level of risk to your capital and you should only trade with money you can afford to lose. Trading Forex and CFDs may not be suitable for all investors, so please ensure that you fully understand the risks involved and seek independent advice if necessary.
Disclaimer:
The above opinions given constitute general market commentary, and do not constitute the opinion or advice of IC Markets or any form of personal or investment advice.
Any opinions, news, research, analyses, prices, other information, or links to third-party sites contained on this website are provided on an "as-is" basis, are intended only to be informative, is not an advice nor a recommendation, nor research, or a record of our trading prices, or an offer of, or solicitation for a transaction in any financial instrument and thus should not be treated as such. The information provided does not involve any specific investment objectives, financial situation and needs of any specific person who may receive it. Please be aware, that past performance is not a reliable indicator of future performance and/or results. Past Performance or Forward-looking scenarios based upon the reasonable beliefs of the third-party provider are not a guarantee of future performance. Actual results may differ materially from those anticipated in forward-looking or past performance statements. IC Markets makes no representation or warranty and assumes no liability as to the accuracy or completeness of the information provided, nor any loss arising from any investment based on a recommendation, forecast or any information supplied by any third-party.

Bitcoin Analysis: Bullish Bias, But Waiting for a Smart Entry!🚀 BTCUSDT Outlook: Bullish Momentum, But Waiting for Value 📉💰
Bitcoin (BTCUSDT) continues to push higher, showing strong bullish momentum across the daily and 4H timeframes. That said, current price action appears to be overstretched—in my view, it’s trading well into premium territory 📈⚠️.
💡 Although I maintain a bullish outlook, I’m now eyeing a pullback toward a more balanced zone—ideally between the 50% to 61.8% Fibonacci retracement levels. This would bring BTC closer to equilibrium and offer a more strategic opportunity to engage with the trend.
🔎 In this video, we break down:
- The dominant trend and current structure
- How to identify potential market structure shifts
- My buy scenario, which depends on a retracement forming a bearish short-term move (e.g. on the 30-min chart), followed by a bullish break of structure 📊✅
🕒 Timing is everything. Let price unfold—we’re not predicting, we’re preparing. Entries should only be considered when price action confirms the scenario laid out in this video.
⚠️ Disclaimer:
This content is intended for educational purposes only and reflects my personal analysis and opinion. It is not financial advice. Always conduct your own research and use proper risk management.

Bitcoin Hits New ATH on Candle Close & New 2025 ATH ProjectionsThis week Bitcoin produced its highest weekly candle close ever at $106,454. 12-May 2025 weekly session.
The previous ATH based on candle close happened on the 9-December 2024 weekly session at $104,464.
The current high is 1.91% higher than the previous one. Volume is still basically zero on this chart...
Good evening my fellow Cryptocurrency trader—likely to be morning by the time you read this—how are you feeling in this beautiful day?
Bitcoin actually did better than expected but this is not surprising, because Bitcoin is always a surprise on the positive side. This already tells us that the new bullish cycle top can turn out being something completely unexpected, the institutional wave.
The volume...
There are many ways to extract targets so don't mind me using different methods and showing the different possibilities. It is good to have a broad market perspective. Instead of just one option, we can look at all the possible scenarios.
The standard All-Time High based on the previous cycle sits at $155,601. Four years later, hyper hidden inflation, etc., we know this is not it. This same level based on dollars value, $155,000, would be something like $189,000 or $206,000 today, so we are not going to consider this level to be the end of the 2025 bull market.
There is no 180K in this setup. The next target is the 3.618 Fib extension and goes to $209,125. This is more like it. This is a very strong level and there is possibility that Bitcoin can peak right below it.
The next one and last one is the 4.618 Fib extension at $262,649... Let's consider this number for a few minutes. Close your eyes, breathe... Think of Bitcoin, late 2025 or early 2026 and consider this number. Do nothing and just let any impressions come to you. Can be visual, auditory, kinaesthetic or just mental chatter, logical. Yes, it is possible! We keep beyond $250,000 on the cards. Share your impressions in the comments section by the way.
Low volume is natural. If you look at this chart from March 2020 through November 2021 there is no significant spike in volume. It is neutral. So this signal has no use for us at this point. The data-based conclusion is the fact that Bitcoin has been going up for six weeks and volume continues to be low. It was only high when the market hit bottom in 2022 and when it broke up above the 2017 peak in early 2023, that's the highest volume.
Look at this black line:
This is the golden ratio, 1.618 Fib extension in relation to the previous market cycle. It is very interesting. This same level from years ago worked as resistance in late 2024/early 2025.
Last week Bitcoin closed above this level and this week it wicked below and finally closed above. Definitely the action happening here around $102,000. So these numbers are good.
We have a certain price of $155,601 in the coming months, this will be a very strong resistance, the midterm bull market correction can happen here. After the correction bottoms, we will have wave 5 and this one must go beyond this level in order to be real, so this opens up $209,000. Unless $155,000 is the cycle top and ATH, we are set to experience Bitcoin trading above 200K.
My friend, it is my pleasure to write for you again today. Its been so long, I cannot believe we are still seeing each other, exchanging, talking, chatting, trading, reading, writing, fighting and making up just to keep on growing together. Where were you 7 years ago? Where are you now?
Thanks a lot for your continued support.
Namaste.

Bitcoin Hits Highest Prince Since JanuaryThis is a pattern breaker. Volume is rising together with prices.
There was a rejection right below 106,000 but rather than a rejection a bear-trap & shakeout.
The move higher now confirms this.
Bitcoin is now trading with a full green candle and continues to challenge resistance. As prices move to $106,000, this is the highest since January 2025. A full recovery and a challenge of resistance leading to a new All-Time High.
It seems the new week, 19-May, will be the week when Bitcoin makes history again. This is all positive.
This is a short-term chart; 1H.
Many shakeouts are happening now, both bears (LONGs) and bulls (SHORTs) are being liquidated. Liquidation can only happen with positions using too much leverage. Everybody with 5X or lower is extremely safe long-term and can rest easy. Only the gamblers are having a hard time right now.
The market will continue to shake. Volatility can go up. Regardless of the short-term, Bitcoin is set to grow.
Namaste.

The point to watch is whether it can rise above 106133.74
Hello, traders.
If you "Follow", you can always get new information quickly.
Have a nice day today.
-------------------------------------
In order to distinguish which time frame chart the line was drawn on, it is divided into 3 types of lines.
You can create a trading strategy by responding to the support and resistance points or sections drawn on the chart depending on whether there is support or not.
-
The left is an example of when the support and resistance points were first created, and the right is an example of what it looked like after that.
To draw support and resistance points, you need to understand the arrangement of candles.
By checking how the candles are arranged, you can draw support and resistance points or sections like the example chart.
To draw support and resistance points or sections on a time frame chart like this, you need to check the arrangement of candles while minimizing the chart as much as possible.
-
Indicators are used to draw this work using more objective information.
That is, lines are drawn at the DOM(60), DOM(-60), HA-High, and HA-Low indicator points.
In this way, you will be able to reduce your subjective thoughts as much as possible.
Reducing your subjective thoughts will ensure the reliability of the drawn support and resistance points or sections.
-
Going back and drawing support and resistance points or sections with the arrangement of candles means that there must have been movement of candles in the past.
Therefore, if the candle moves to a point where there is no trace of the past, you can no longer draw support and resistance points or sections.
In terms of compensating for this shortcoming, it may be more useful to use indicators to display support and resistance points or sections.
-
The DOM indicator is an indicator that comprehensively evaluates the DMI + OBV + MOMENTUM indicators.
If the DOM indicator is 60 or higher, it means that all indicators have risen above their highest value.
If the DOM indicator is -60 or lower, it means that all indicators have fallen below their lowest value.
The fact that the DOM(60) indicator was created means that it is likely to enter the high point range.
The fact that the DOM(-60) indicator was created means that it is likely to enter the low point range.
Therefore, the DOM(60) indicator is likely to correspond to the resistance point, and the DOM(-60) indicator is likely to correspond to the support point.
Since the DOM indicator is displayed on the Close value, it has the disadvantage of being difficult to respond immediately when the actual DOM indicator is created.
However, once it is created, it will faithfully perform the role of support and resistance.
-
The HA-Low and HA-High indicators are indicators created to determine the trading point from the Heikin-Ashi candle.
Accordingly, the plotted point corresponds to the average value.
Therefore, the HA-Low and HA-High indicator points have the disadvantage of being expressed differently from the candle's value.
As you can see from the formulas of the HA-Low and HA-High indicators, the RSI value is included in the conditions of the formula.
The fact that the HA-Low indicator was created means that the price rose from the low point range.
Therefore, the HA-Low indicator corresponds to the support point.
The fact that the HA-High indicator was created means that the price fell from the high point range.
Therefore, the HA-High indicator corresponds to the resistance point.
Therefore, we basically have a trading strategy of buying when the HA-Low indicator is created and selling when the HA-High indicator is created.
-
It is not clear whether the actual support and resistance points or sections are supported or resisted.
However, as time passes, we can see whether it is supported or resisted.
To help determine whether it is supported or resisted, we use the StochRSI indicator and OBV indicator as auxiliary indicators.
-----------------------------------------
(BTCUSDT 1D chart)
It is showing an upward trend above the DOM (60) indicator displayed at the current candle position.
And, if StochRSI rises above 80 and maintains the price, the possibility of an upward trend will increase.
If the auxiliary indicator StochRSI indicator rises in the oversold zone and OBV rises above the High Line, the upward trend will be guaranteed.
The previous DOM (60) indicator is formed near the Fibonacci ratio 2 (106178.85).
Therefore, the point of observation is whether it can rise above that.
If it rises and maintains the price, it is expected to renew the ATH.
If not, and it falls below the HA-High indicator or the M-Signal indicator on the 1D chart,
1st: 97226.92
2nd: M-Signal on the 1W chart
You should check for support near the 1st and 2nd above.
-
This volatility period is expected to continue until May 20.
However, volatility may also occur around May 23 (May 22-24) and around May 27 (May 26-28), so you should be careful of volatility until May 28.
-
Thank you for reading to the end.
I hope you have a successful trade.
--------------------------------------------------
- This is an explanation of the big picture.
I used TradingView's INDEX chart to check the entire range of BTC.
I rewrote the previous chart to update it by touching the Fibonacci ratio range of 1.902 (101875.70) ~ 2 (106275.10).
(Previous BTCUSD 12M chart)
Looking at the big picture, it seems to have been following a pattern since 2015 and has been rising.
In other words, it is a pattern that maintains a 3-year uptrend and faces a 1-year downtrend.
Accordingly, the uptrend is expected to continue until 2025.
-
(Current BTCUSD 12M chart)
Based on the currently written Fibonacci ratio, it shows up to 3.618 (178910.15).
Fibonacci ratio 0.618 (44234.54) is not expected to fall again.
(BTCUSDT 12M chart)
I think it is around 42283.58 when looking at the BTCUSDT chart.
-
I will explain it again with the BTCUSD chart.
The Fibonacci ratio ranges marked in the light green boxes, 1.902 (101875.70) ~ 2 (106275.10) and 3 (151166.97) ~ 3.14 (157451.83), are expected to be important support and resistance ranges.
In other words, it seems likely to act as a volume profile range.
Therefore, in order to break through this section upward, I think the point to watch is whether it can rise with support near the Fibonacci ratios of 1.618 (89126.41) and 2.618 (134018.28).
Therefore, the maximum rising section in 2025 is expected to be the 3 (151166.97) ~ 3.14 (157451.83) section.
To do that, we need to look at whether it can rise with support near 2.618 (134018.28).
If it falls after the bull market in 2025, we don't know how far it will fall, but considering the previous decline, we expect it to fall by about -60% to -70%.
So, if the decline starts near the Fibonacci ratio 3.14 (157451.83), it seems likely that it will fall to around Fibonacci 0.618 (44234.54).
I will explain more details when the downtrend starts.
------------------------------------------------------

Bitcoin 6th Consecutive Week Green? Not Yet But...Wait! We are not there yet but I will explain this is good even if this turns out not to be the final outcome.
The last time that Bitcoin produced 6 weeks green in a row was October 2023. Yes, you guessed it, when Bitcoin moved above ~$30,000 for the first time after the bear market and this led to now, a new All-Time High of $110,000.
The same development now, in May 2025, sends a very strong warning for the bears and a super strong signal for the bulls. This means that a rise can continue to happen—because it is already underway with 5-weeks green—toward $200,000 or higher.
Even if the week were to close red the truth is that Bitcoin is rising with strong bullish momentum and a red week within the uptrend is nothing more than consolidation.
The current week has a long lower shadow which is bullish. The candle body being red or green would be irrelevant as the candle would still be a Doji which in this case means neutral. Neutral on the rise means that the previous candle and market dynamics is the predominant factor; in short, the uptrend continues.
Now, the possibilities are in our favor being right 100% choose to follow Bitcoin will keep on growing and now for more than 1.5 months and this is great. The Altcoins will BOOM! as soon as Bitcoin hits $110,000 and the best news is that this is not the end, only the start.
We are looking at the strongest bullish signal since October 2023. Bitcoin closing six consecutive weeks green. This would only confirm what is already happening and what we already know. The 2025 bull market is on.
Let's add a little bit more of support to our analysis because some people are lost. Leave comment with your thoughts.
The RSI, weekly, reads 64.64 this is super strong. Basic.
A strong RSI is needed for a massive rise and at the same time, read this, there is plenty of room available for additional growth and we are back to the terminology we used back in December 2017. Nice isn't it?
Here is the chart:
The weekly MACD is ultra-hyper bullish:
The MACD bullish cross came in just now and this with the MACD reversing above zero, within the bullish zone. Basically, the MACD hit bottom and is ready to grow. "Plenty of room available for growth." Literally, in front of a major advance.
The last time the MACD looked like this was in October 2024. Before the major new ATH everything my people... This is it! Bitcoin LONG only bullish.
Ok, let's continue.
The short-term doesn't matter it is up-confirmed until late 2025. $200,000 more or less confirmed. Who cares about the noise?
Finally, Bitcoin is easily trading above ALL moving averages.
Comment & follow...
Namaste.

btc . recap . w3 . maymon to eager . wait mon to show its hand - cw!
. early LONG compound because of the bullish outlook
- tp2 108462
tue didn't ride momentum - blind bullish
. tp1 HIT
. missed SHORT at 10pm (UTC+2)
- should have traded the momentum of mon looking to form support during the week later . for more compound LONG
wed mid of range . cw
. no trade zone
thu
. waiting for run of aLow during ny
. compound LONG - 101485
. tp1 HIT
fri didnt catch enough upward momentum
. tp1 HIT
. last limit order for bullish continuation . tpo - 102862.5
wknd
. tp1 for weekly LONG idea finally hit
. duration 5d 22h
. +4.33%
conclusion :
trade what you see, go with momentum, but have a narrative.
outlook :
america downgraded from AAA to AA+ . People will turn hardcore bearish, once the price starts falling. this could be the trigger to find the long awaited drop - while having retail call out a bearmarket . massive potential here, to both sides. wOpen and monday full data (while keeping an close eye on tpo and footprint charts), are key .

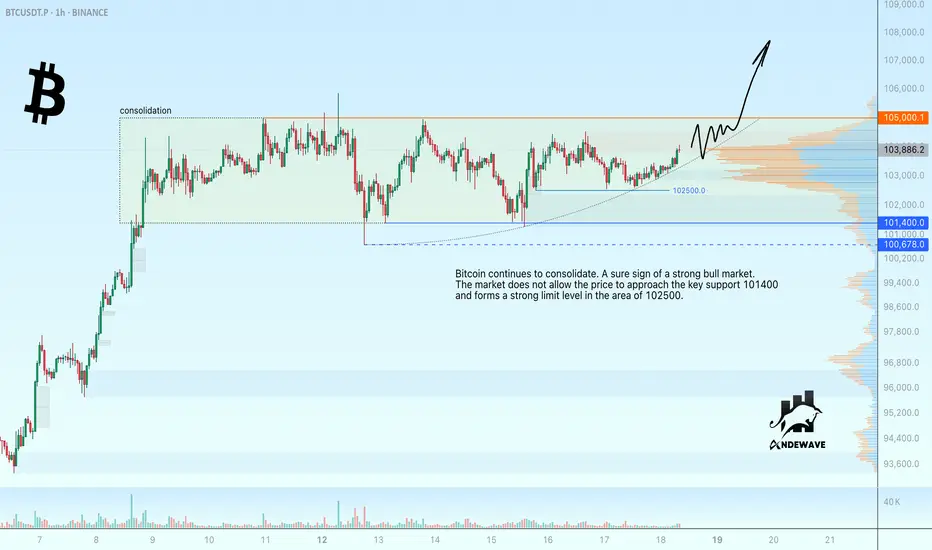
Bitcoin tests 105,000 with a view to breakout Bitcoin continues to consolidate. A sure sign of a strong bull market.
The market is not allowing the price to approach the key support 101400 and is forming a strong limit level in the 102500 area.
Scenario: I am waiting for a retest of 105000 resistance and if bitcoin remains consolidated above 103500 - 103800 and continues to test 105000, another retest of consolidation resistance could lead to a breakout and a rise towards ATH
An additional condition may be the consolidation of the price above 105000.
BTC/USD 4H Chart targets and stoplossHello everyone, let's look at the 4H BTC to USD chart, in this situation we can see how the price has come out of the downtrend channel on top, and the upward movement after leaving the channel is close to the height of the downtrend channel.
Let's start by defining the targets for the near future that the price has to face:
However, at the beginning we can see how the price is struggling with a strong resistance zone from $103882 to $108349. Next, we have potential targets:
T1 = 112,740 USD
T2 = 116,525 USD
Т3 = 120,000 USD
Now let's move on to stop-loss in case the market continues to fall:
SL1 = 100,551 USD
SL2 = 97,446 USD
SL3 = 92,525 USD
SL4 = 88,286 USD
The RSI indicator shows that in the 4H interval, the movement is at the upper limit of the range, which clearly affects the sideways movement on the chart.

BTC - Will the trend continue?Since the beginning of April, BTC has been on a notable upward trajectory, showing impressive strength with minimal retracements. This sustained momentum has captivated market participants and built a narrative of continued bullish pressure. Along this journey, BTC has carved out two distinct consolidation zones, periods of relative price stability, characterized by equal highs and lows. Each time, these consolidations were followed by a decisive breakout to the upside, reinforcing the prevailing bullish sentiment in the market.
Another consolidation phase
At the present moment, BTC appears to be entering yet another consolidation phase. The price is coiling, showing signs of compression that often precede significant moves. This naturally leads to the question: are we about to witness another breakout to the topside, continuing the pattern established over the past several weeks?
Bullish scenario
In a bullish scenario, a breakout to the upside would likely see BTC pushing towards the 106,000 level. This zone is a key target for traders watching in this consolidation. Should momentum carry the price beyond this threshold, Bitcoin would be well-positioned to challenge its all-time high near 109,000. A clean move through these resistance levels could spark a new wave of optimism, potentially attracting fresh capital into the market and confirming the strength of the current uptrend.
Bearish scenario
However, it’s important not to ignore the risks. The bearish scenario involves BTC breaking down below the current support zone, which sits around the 101,000 mark. A decisive move beneath this level would undermine the bullish structure and signal a shift in market sentiment. In this case, Bitcoin might find itself revisiting the 97,000 to 98,000 range, an area that previously acted as resistance during the last consolidation phase and may now serve as a potential support zone if tested from above.
Conclusion
In essence, the market is at a critical juncture. BTC’s recent behavior suggests a buildup toward a significant move, but the direction remains uncertain. Whether it continues its march toward new highs or corrects to retest lower levels, this period of consolidation is likely to define the next phase of Bitcoin’s trend. Traders and investors alike are watching closely, as the next breakout, up or down, could set the tone for the weeks to come.
Thanks for your support.
- Make sure to follow me so you don't miss out on the next analysis!
- Drop a like and leave a comment!

BTC/USDT at Decision Point: Triangle Pattern Signals BreakoutHello guys!
Bitcoin is consolidating in a symmetrical triangle pattern near a key resistance zone after a strong uptrend within the ascending channel. The price is trading just below the triangle’s top line, indicating a potential breakout or breakdown setup.
✔ Key Scenarios:
👀 Scenario 1 – Bullish Breakout:
If BTC breaks above the top of the triangle, we could see a sharp move upward toward the $106K resistance zone and potentially higher.
This would signal trend continuation and strength in the bullish momentum.
👀 Scenario 2 – Temporary Pullback (Triangle Breakdown):
If BTC breaks the bottom of the triangle, the price might fall toward the $99,715 support level.
This zone is also aligned with a previous consolidation and could serve as a strong demand area.
A bullish reversal from this area is likely, providing another long opportunity targeting the same $106K resistance.
Conclusion:
Bitcoin is moving in a tightening range. A breakout from the triangle will dictate the next move. For clearer direction, traders should watch for a decisive move above or below the triangle structure.
