ONDO (Ondo Finance) – Long Swing Trade Setup Near Key SupportONDO is retracing alongside broader market weakness and is approaching a key support zone around $0.95, which previously acted as a breakout base. This area now presents a potential high-reward swing trade if buyers step in to defend the level.
🔹 Entry Zone:
$0.95 (critical horizontal support & potential demand zone)
🎯 Take Profit Targets:
🥇 $1.15 – $1.25 (prior local highs and resistance)
🥈 $1.40 – $1.55 (macro range extension)
🛑 Stop Loss:
Just below $0.83 (breakdown below previous structural low)
Btc!

BTC/USDT Short Side TradeEntry 102650
SL 102800
Target 101700
There is a strong selling pressure and also its a fibo zone

Correction Imminent? Will Bitcoin Drop Or Continue Rising?As we can see here, Bitcoin is challenging resistance very close to the All-Time High. This is a price range. The highest Bitcoin was able to hit was $105,850, right below $106,000. Will Bitcoin drop now, even if short-term, or continue moving higher?
» Bitcoin will continue higher and produce a minimum of retrace.
Bitcoin is very likely staying above $100,000 and after some consolidation continue higher to hit a new All-Time High.
While Bitcoin moved above $100,000 on the 8th of May, there isn't any bearish pressure nor bearish momentum. The bears have no strength.
If there is selling happening, the bulls are more than ready and happy to buy everything up. Anyone and everyone selling now will simply lose their coins and miss a huge opportunity because Bitcoin is already growing and will continue to grow. It is normal to see some consolidation after a strong resistance level is hit. This resistance stands around $105K. Once this level breaks, we will see additional growth.
Bitcoin is bullish.
The market is bullish.
Any retraces are just an opportunity to buy-up, rebuy and reload. Do not sell your coins, hold strong. Hold easy or even buy more because Bitcoin is going up!
It can start growing right away, within hours or it can take a maximum of few days but the next major move is up. When Bitcoin starts going, it never looks back. The market will continue growing. Rest easy and buy more Altcoins.
Namaste.

Important section: 101947.24-106133.74
Hello, traders.
If you "Follow", you can always get new information quickly.
Have a nice day today.
-------------------------------------
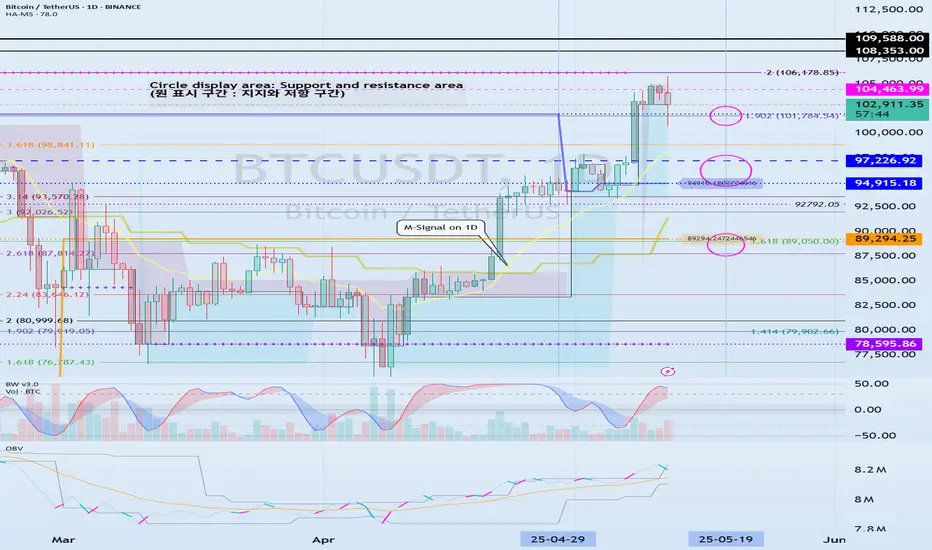
(BTCUSDT 1D chart)
It has touched the Fibonacci ratio 1.902 (101784.54) and is rising.
The key is whether it can receive support near the StochRSI 50 indicator (102971.99) and rise.
If not, it can fall to the 94915.18-97226.92 area.
Since the HA-Low indicator is formed at the 89294.25 point, it is important whether the price can be maintained above that point.
If the StochRSI indicator falls below the overbought range and then rises while moving sideways around the Fibonacci ratio range of 1.902 (101784.54) ~ 2 (106178.85), it is expected to renew the ATH.
Even if it falls more than expected, if it rises along the M-Signal indicator on the 1D chart, it is highly likely to renew the ATH.
----------------------------------------------------------
I will explain the newly added indicators, StochRSI 50, StochRSI 80, and StochRSI 20.
The disadvantage of interpreting the StochRSI indicator added as an auxiliary indicator is that it cannot determine the price movement.
Because of this, when interpreting the StochRSI indicator so far,
- Whether it is in the overbought or oversold zone,
- Whether StochRSI is above or below the 50 point,
we interpreted it as above.
Therefore, we added the price movement to the StochRSI indicator to check the movement more accurately.
-
The StochRSI 50 indicator is literally created when the StochRSI indicator passes the 50 point.
Therefore, we need to think about a response plan based on the price StochRSI 50 indicator.
-
The fact that StochRSI 80 is created means that the StochRSI indicator has risen above 80.
Therefore, in order to continue the upward trend, StochRSI must rise above 80.
If StochRSI 80 is not created and only StochRSI 20 is created, the upward trend will occur when the price is maintained above the StochRSI 50 indicator.
-
The fact that StochRSI 20 was created means that the StochRSI indicator has fallen below 20.
Therefore, in order to continue the downtrend, it must fall below StochRSI 20.
If StochRSI 20 is not created and only StochRSI 80 is created, the downtrend will occur when the price is maintained below the StochRSI 50 indicator.
-
Thank you for reading to the end.
I hope you have a successful trade.
--------------------------------------------------
- This is an explanation of the big picture.
I used TradingView's INDEX chart to check the entire range of BTC.
I rewrote the previous chart to update it by touching the Fibonacci ratio range of 1.902 (101875.70) ~ 2 (106275.10).
(Previous BTCUSD 12M chart)
Looking at the big picture, it seems to have been following a pattern since 2015.
In other words, it is a pattern that maintains a 3-year bull market and faces a 1-year bear market.
Accordingly, the bull market is expected to continue until 2025.
-
(Current BTCUSD 12M chart)
Based on the currently written Fibonacci ratio, it is displayed up to 3.618 (178910.15).
It is expected that it will not fall again below the Fibonacci ratio of 0.618 (44234.54).
(BTCUSDT 12M chart)
I think it is around 42283.58 when looking at the BTCUSDT chart.
-
I will explain it again with the BTCUSD chart.
The Fibonacci ratio ranges marked in the light green boxes, 1.902 (101875.70) ~ 2 (106275.10) and 3 (151166.97) ~ 3.14 (157451.83), are expected to be important support and resistance ranges.
In other words, it seems likely to act as a volume profile range.
Therefore, in order to break through this section upward, I think the point to watch is whether it can rise with support near the Fibonacci ratios of 1.618 (89126.41) and 2.618 (134018.28).
Therefore, the maximum rising section in 2025 is expected to be the 3 (151166.97) ~ 3.14 (157451.83) section.
To do that, we need to look at whether it can rise with support near 2.618 (134018.28).
If it falls after the bull market in 2025, we don't know how far it will fall, but considering the previous decline, we expect it to fall by about -60% to -70%.
So, if the decline starts near the Fibonacci ratio 3.14 (157451.83), it seems likely that it will fall to around Fibonacci 0.618 (44234.54).
I will explain more details when the downtrend starts.
------------------------------------------------------
Bitcoin at PRZ! Is This the Calm Before a Drop?As I expected in yesterday's idea , Bitcoin ( BINANCE:BTCUSDT ) started to rise from near the Support line and hit the Target .
Bitcoin is trading near the Potential Reversal Zone(PRZ) , the upper line of the ascending channel(minor) , and the Resistance line .
In terms of Elliott Wave theory , it seems that Bitcoin has successfully completed the microwave B of the main wave 4 in the ascending channel(minor). A break of the lower line of the ascending channel(minor) could be a sign of the completion of this wave. The corrective structure of the main wave 4 so far could be a Zigzag(ABC/5-3-5) .
I expect Bitcoin to drop to at least $100,923 AFTER breaking the lower line of the ascending channel(minor) and breaking the Support line, the next target could be the lower line of the ascending channel(major) .
Cumulative Short Liquidation Leverage: $106,943-$105,913
Cumulative Short Liquidation Leverage: $105,525-$104,500
Cumulative Long Liquidation Leverage: $100,763-$99,774
Note: If Bitcoin goes above $105,300, we can expect more pumps.
Note: If Bitcoin touches $99,400, we should expect further declines.
Please respect each other's ideas and express them politely if you agree or disagree.
Bitcoin Analyze (BTCUSDT), 1-hour time frame.
Be sure to follow the updated ideas.
Do not forget to put a Stop loss for your positions (For every position you want to open).
Please follow your strategy and updates; this is just my Idea, and I will gladly see your ideas in this post.
Please do not forget the ✅' like'✅ button 🙏😊 & Share it with your friends; thanks, and Trade safe.

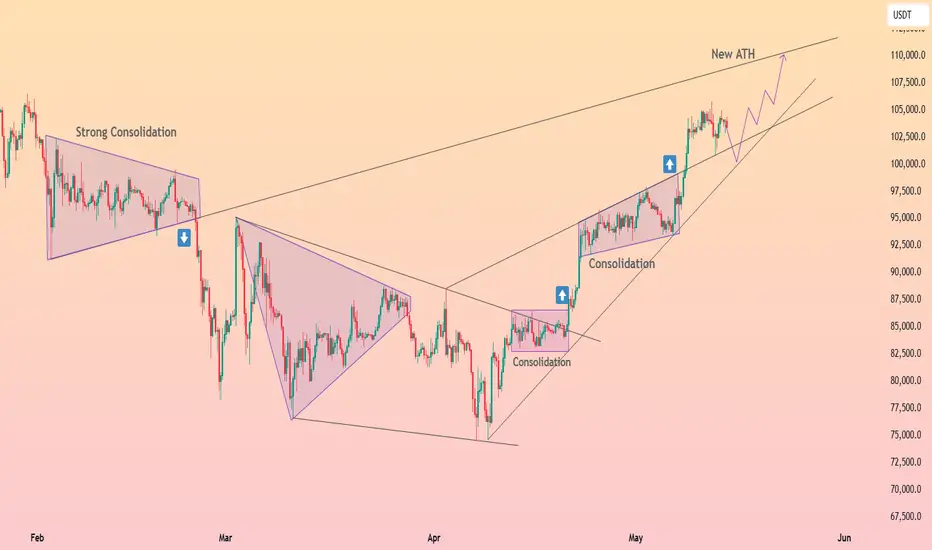
HolderStat┆BTCUSD channel run to 115kAfter February’s strong consolidation wedge cracked, Bitcoin price rebounded, carving a fresh ascending channel that sits snug on wedge support above 100 k. Each mini‑consolidation has resolved higher, and the current leg projects into the 112‑115 k new‑ATH rail drawn on the chart. Pullbacks toward 100‑102 k are structurally healthy so long as the lower trend‑line stays intact, keeping the broader BTC breakout narrative alive.
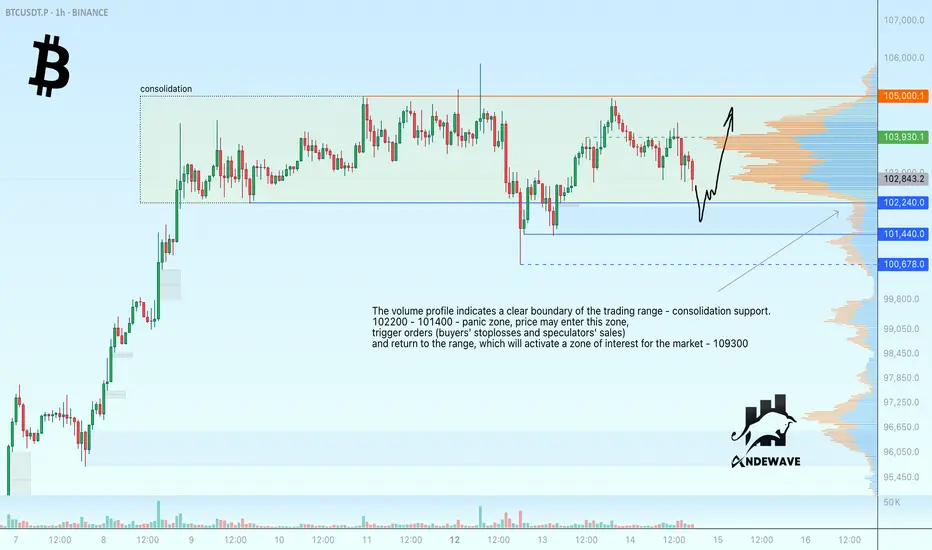
Bitcoin ready to test support before risingThe volume profile indicates a clear boundary of the trading range - consolidation support as a target for the current local movement.
102200 - 101400 - panic zone, price may enter this zone, provoke bids (buyers' stoplosses and speculators' sales) and return to the range, which will activate a zone of interest for the market - 103930.
Scenario: the price is trading inside the consolidation with clear boundaries - support and resistance. The price is aiming for the support within a bullish trend. False breakdown of support may trigger a rebound and growth. Target 103930 - 105000
Technical Analysis – Bitcoin (BTC/USD) 1H Chart + TRADE PLANThe chart displays a symmetrical triangle pattern, which is a neutral continuation pattern often leading to a breakout in the direction of the prevailing trend.
The current price action is at the apex of the triangle, suggesting an imminent breakout.
The price is currently testing the lower trendline support, with a visible weakening momentum.
Indicators Analysis:
VMC Cipher B Divergences: Showing bearish momentum with continued red wave dominance and lack of significant bullish divergence.
RSI (14): Bearish territory at 32.51, approaching oversold but no bullish divergence visible.
Money Flow Index (MFI): At 28.90, indicating weak buying pressure, leaning toward bearish continuation.
Stochastic Oscillator (14, 3, 3): In the oversold zone (1.49), which could indicate a short-term bounce is possible, but not confirmed by other indicators.
Volume:
Note that the chart mentions volume data is unavailable. Confirmation on volume spikes during breakout is essential to validate any move.
Scenarios and Targets
Scenario 1 – Bullish Breakout (Less probable based on current conditions)
Break above triangle resistance (approx. 102,300 USD).
Target 1: 107,500 USD (Measured move from triangle height).
Target 2: 115,500 USD (Extended target based on historical breakout levels and Fibonacci projection).
Confirmation needed: Clear breakout with high volume and RSI recovery above 50.
Scenario 2 – Bearish Breakdown (More probable currently)
Break below triangle support (approx. 101,300 USD).
Immediate Target 1: 97,000 USD (Measured move from triangle height).
Target 2: 93,500 USD (Previous major support zone).
Confirmation needed: Hourly candle close below support zone and breakdown with increased volume, RSI falling below 30, Stochastic remaining oversold.
Trading Plan
Bias: Bearish unless invalidated by bullish breakout confirmation.
Entry Strategy:
Aggressive short entry: On hourly candle close below 101,300 USD.
Conservative short entry: On confirmation below 101,000 USD with volume spike.
Stop-Loss:
Above 102,500 USD, invalidating the bearish thesis.
Take-Profit Zones:
TP1: 97,000 USD
TP2: 93,500 USD
Risk Management:
Max risk per trade: 1-2% of portfolio.
Monitor closely for fakeouts at the apex; symmetrical triangles are prone to false moves.
Alternative Strategy:
If bullish breakout occurs above 102,500 USD with RSI reclaiming 50, switch to a long setup with:
Stop Loss: Below 101,000 USD
TP1: 107,500 USD
TP2: 115,500 USD
Current indicators, price behavior, and chart pattern favor a bearish scenario.
Key to execution is waiting for confirmed breakout direction with volume confirmation, especially near the critical apex zone.
Stay adaptive, as symmetrical triangles can break either way, and false breakouts are common.

BITCOIN 's 'Final 6 months rally' kickstarts the Altseason!This isn't the first time we show you this chart but it couldn't be more relevant than today. We have established on previous analyses how Bitcoin (BTCUSD) has most likely started the final rally of its Cycle, historically the parabolic rally of the last 6 months of the Bull Cycle that ends with its Top.
The addition of today's analysis is that with Bitcoin Dominance (orange trend-line) approaching its 8-year Lower Highs trend-line, this 'Final 6 months rally' of BTC is what technically also starts the Altseason. This is when lower cap coins see massive gains compared to the high cap ones.
At the same time, we get one more confirmation of why a $150k BTC Target is realistic, as by the end of 2025, this price would still be on the 0.618 Fibonacci level of the 8-year Fib Channel Up, a rather 'bad case' scenario based on this pattern.
So what do you think? Will BTC's Final 6 months rally spark a massive Altseason too? Feel free to let us know in the comments section below!
-------------------------------------------------------------------------------
** Please LIKE 👍, FOLLOW ✅, SHARE 🙌 and COMMENT ✍ if you enjoy this idea! Also share your ideas and charts in the comments section below! This is best way to keep it relevant, support us, keep the content here free and allow the idea to reach as many people as possible. **
-------------------------------------------------------------------------------
💸💸💸💸💸💸
👇 👇 👇 👇 👇 👇

btc . may . w3 . thuin retrospect
- SHORT towards 2pm (UTC+2) . into wOpen + fib resis - was the TOD
- compounding LONG gave a new avg LONG
entry . 102586
sl . 100017
tp1 . 104576
tp2 . 105871
for bullish continuation, price around 2pm needs to be a support zone.
if we see it the other way around, we could rotate to lower prices.
if price breaks out above 102586, we TRAP NEW SHORTS - which came in at 102100 . 20mil vol . push price back into 0.75% weekly range for tp1

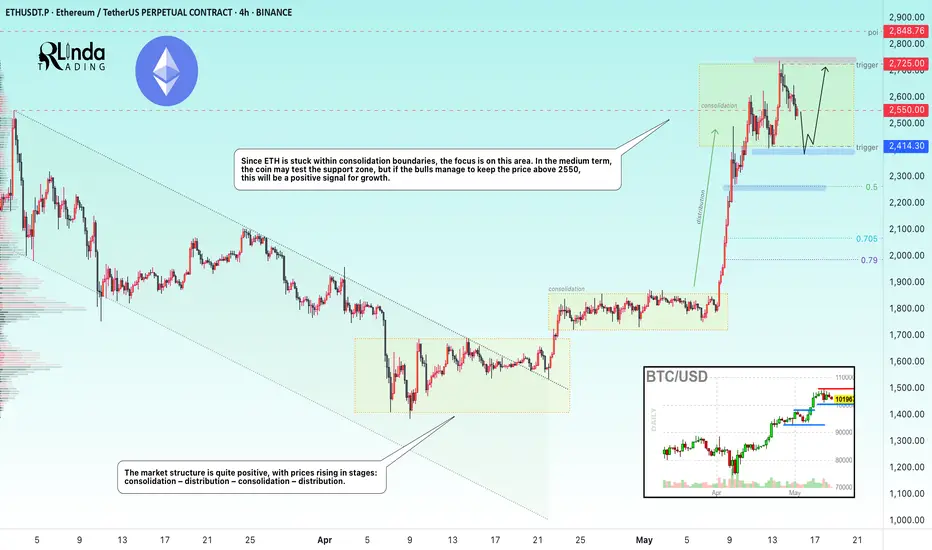
ETHEREUM → Consolidation. Which way will the distribution go?BINANCE:ETHUSDT.P has moved into a consolidation phase after the distribution phase. Focus on the 2414-2725 range. A retest of support is possible during the current phase. Despite the bullish trend, there are risks of a reversal...
ETH has been a fairly unprofitable project over the past few years, with the price hitting one bottom after another. While Bitcoin and altcoins were flying high, ETH has only shown itself to be a bull in the last few days.
In the current phase, the focus is on the consolidation boundaries, as well as the 2550 level. If the bulls keep the market above 2550, then the coin could strengthen to 2725, which would be a positive sign for us that buyers are interested in continued growth.
If ETH continues its correction towards support at 2414, then we will need to monitor the market's reaction to this level. I remain skeptical about ETH due to its weak long-term performance despite a strong fundamental backdrop.
Resistance levels: 2550, 2725
Support levels: 2414, 2260
Further movement will determine the price's exit from consolidation: a breakdown of support means a fall, a breakout of resistance means growth. But the current scenario is trading within the range. If ETH trades near 2725 and forms a pre-breakout consolidation, then we will have a chance for growth.
The opposite scenario is if the price falls below 2550 and begins to test 2414. In this case, sticking to the support level and numerous retests will indicate that the bull market has exhausted its strength and we can expect a correction to 2260-2065.
Best regards, R. Linda!
101K to 110KMorning folks,
So, since Monday situation barely has changed. As we said - retracement should be small and we pointed 101K support area. 98K is also nice but it is a kind of vital area for this setup.
Now you could see everything goes great. Market is moving out of 101K.
Here is two shapes might be - immediate upside action by butterfly, or still, a bit deeper retracement in a way of "222" Buy. But anyway market has to stay above 98K to keep this scenario valid.
So let's see. By far everything looks very accurate and predictable.

Bitcoin Will Like Decline: Institutional Traders are SellingFenzoFx—Bitcoin is overbought, as indicated by the Stochastic Oscillator. Meanwhile, 52 percent of institutional traders are holding sell positions.
If resistance between $106,000 and $109,000 holds, the price may drop toward $96,000.

BTC (Y25.P2.E1) Have 2 scenariosHi Traders,
I won't use words as the charts do the job if you can read charts.
Scenario #1, price moves up from here
Scenario #2, price sweeps the lows for liquidity. A fractal is aligned with it.
I'm looking to enter the trade big at the lows with Avwap, EMAs and liquidity making a strong case.
Here are short term levels based on our approach.
All the best,
Regards,
S.SAri

BTC (Y25.P2.E2). Ideal scenarioHi Traders,
As per the chart, the VAH is the main resistance so another dip might be the catalyst required to break through it.
Difficult to say if we sweep the highs first at 106k range for liquidity for a nice short or sweep the lows first.
All the Best
SSari
SMALLER TIME FRAME
in a range to trade

Momentum Fades: Is Bitcoin Poised for a Pullback to Rebalance?Given the recent easing of US-China tariff tensions 🇺🇸🇨🇳, we’re observing a notable rotation of capital into equities 📈. This shift is lending strength to the US dollar 💵, which in turn has exerted downward pressure on Bitcoin’s price action. After a strong momentum-driven rally 🚀, Bitcoin is now showing early signs of weakness, suggesting a potential consolidation or a measured pullback.
With equity markets—particularly tech stocks—appearing overextended 🏦, a retracement seems likely. Since Bitcoin remains closely correlated with the tech sector, a synchronized pullback across both asset classes is a plausible scenario. I’m closely monitoring for a counter-trend opportunity, specifically eyeing a short entry should we see a decisive break in market structure 🔍.
It’s important to note that this setup is highly dependent on price action confirming the thesis as outlined in the accompanying video. If the anticipated conditions do not materialize, this trade idea will be promptly invalidated. ⚠️
Disclaimer:
This analysis is for informational purposes only and does not constitute financial advice. Trading cryptocurrencies and equities involves significant risk. Please conduct your own research and consult with a professional advisor before making any investment decisions. 📊
