BTC with potential for $115,000/$120,000🔍 Market structure (Price Action)
📈 Trend:
The market previously formed higher highs (HH) and higher lows (HL) – a classic uptrend.
Then there was a correction and a lower high (LH) and lower low (LL) appeared – a potential change in the trend to a downtrend.
The last two lows are again HL (Higher Lows) – suggesting an attempt to return to the uptrend.
🔄 Key support and resistance levels
✅ Resistance (green horizontal lines):
117.469 – local resistance and potential breakout target from the current range.
115.802 – confirmed resistance from previous consolidations.
111.814 – strong local resistance (LH – Lower High formed there).
109.341 – current resistance, the price is currently testing it.
🛑 Support (red horizontal lines):
105.370 – local support, price reacted at this level in recent days.
102.650 – important support, level of previous HL.
100.095 – consolidation level before breaking out upwards.
98.213 – last LL – very important level in the context of defending the structure.
🧭 Structure of peaks and troughs
HH: Higher High – confirmed the previous uptrend.
LH: Lower High – first warning about changing the structure to down.
LL: Lower Low – confirmed a potential change to downside.
HL (x2): two more higher lows – suggest a possible return to growth.
📊 Stochastic RSI (at the bottom of the chart)
The oscillator is currently in the overbought zone (>80), approaching a downward crossover.
It suggests a possible short-term halt in growth or correction.
But in strong trends it may "stick" to the upper range.
📌 Potential scenarios:
🟢 Bullish:
If the price breaks above 109.341, it may test 111.814 and then 115.802.
Continuation of the HL → HH formation will confirm a trend reversal and further growth.
🔴 Bearish:
If the price does not stay above 109k and breaks below 105.370, there is a risk of a test of 102.650 and lower.
A break of 100.095 and especially 98.213 will negate the growth structure.
🧠 Conclusions:
The market is at a key decision point - HL formation vs. resistance zone.
Buyers' strength will be confirmed only after breaking 111-112k.
Stochastic RSI warns of potential pullback or consolidation.
Btc!

BVIV major BULL season ahead, BTC (from 106k) and ALTS ↑↑↑BVIV volatility index is a major confluence that 99% don't look at. Proof of this is there are only 3 posts about it, and one of them is mine lol. This is the 4th one. So you know its special.
This btc index is a major predictor of the market. When this shifts majorly, the whole market gets magnetized by it in massive scale.
Based on the current long term metrics. BVIV is hinting of another monster shift. It took 16 months for this signal to resurfaced. Last one was from September 2023, where BTC surge from 24k to 112k in 7 months. And as of this writing, June 2025 another big shift is transpiring after 16 months of long wait -- conveying another major ascend ahead in the next coming months.
Ideal seeding season is now -- you cant miss out because this change in structure doesnt come often. When this shows up, YOU SHOW UP. :)
Expect some weighty rise on the next few seasons. Market will be very very generous.
Spotted at 106k btc / 2400 eth.
Targets: Sky is the limit.
TAYOR.
Trade safely.
Not financial advice.

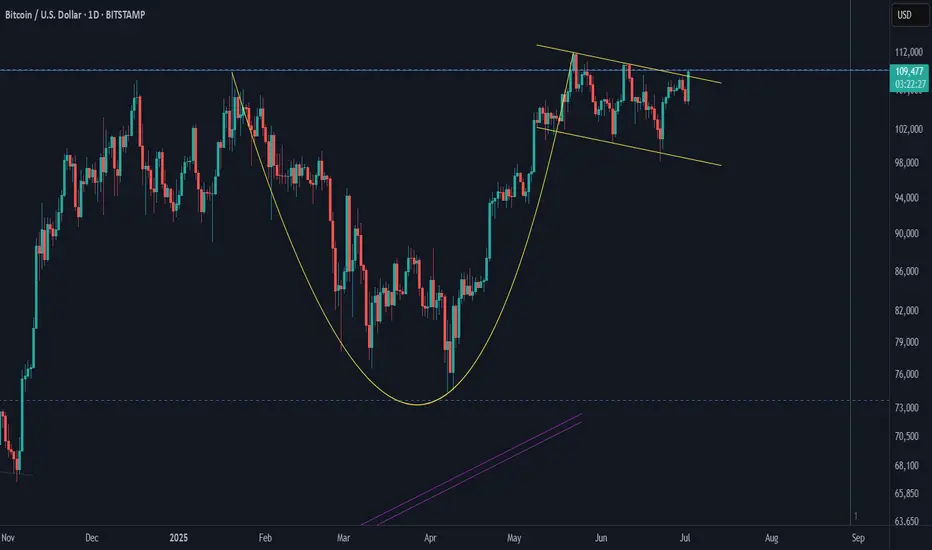
Bitcoin Upward Waves vol 2Continuing from the previous Bitcoin analysis:
Bitcoin is trying to break the Handle upward. If successful, that means the Cup and Handle pattern is confirmed. Next, have to wait for Bitcoin to go up and finish the pattern. How far can Bitcoin rise? Let's see what happens.
BITCOIN: The $110K Crossroads - Bull vs Bear Battleground! The Setup: "The Healthy Pullback Hypothesis
🔵 BLUE SUPPORT TRENDLINE (Rising from ~$76K)
The Foundation: This ascending support has held multiple tests
Current Status: Price dancing right on this crucial line
Psychology: Bulls' last stand
🔴 RED RESISTANCE CHANNEL (Descending from $112K peak)
The Ceiling: Two parallel resistance lines creating downward pressure
Pattern: Classic bearish channel formation
Volume Profile: Declining volume suggests exhaustion
🟡 YELLOW HORIZONTAL ZONES
Key Level 1: ~$98K (Previous resistance turned support)
Key Level 2: ~$112K (The rejection zone)
🟢 BULLISH SCENARIO (65% Probability)
Setup: Breakout above red channel resistance (~$108K)
🚀 Rocket Ship: Explosive move to $120K+
📉 Reality Check: Deeper correction to $95K-98K range
Entry: $97K - 98K (confirmed breakout)
Target 1: $104K
Target 2: $110K
Stop Loss: $95K
____________________________
⚠️ Risk Disclaimer: This analysis is for educational purposes. Always manage risk and never risk more than you can afford to lose. Markets can remain irrational longer than you can remain solvent! ⚠️

BITCOIN STRONG RESISTANCE AHEAD|SHORT|
✅BITCOIN is going up now
But a strong resistance level is ahead at 112,000$
Which is also an All-Time-High
Thus I am expecting a pullback
And a move down towards the target of 107,300$
SHORT🔥
✅Like and subscribe to never miss a new idea!✅
Disclosure: I am part of Trade Nation's Influencer program and receive a monthly fee for using their TradingView charts in my analysis.

Bitcoin - Flag pattern is brokenBitcoin had been consolidating within a flag pattern for the past three months. That pattern has now officially broken to the upside, with the price surging to $109K — a strong bullish signal fueled by encouraging news around institutional adoption.
Based on both the technical flag breakout and ongoing fundamental momentum, the next target for Bitcoin is $145K. Any move beyond that would be considered a bonus in this current bull cycle.
Stay tuned for more updates.
Cheers,
GreenCrypto

BTC Weekly Analysis : Rise or Fall ? Let's SeeBy analyzing the #Bitcoin chart on the weekly timeframe, we can see that last week’s candle closed at $108,350, and BTC is currently trading around $107,500. If the price manages to hold above $105,700, we could expect further upside momentum. The next potential bullish targets are $111,700, $124,000, and $131,800.
So far, this analysis has yielded over 9% return, and we’ll be sharing more updates soon from lower timeframes!
🎥 If you enjoyed this video analysis and found it helpful, please show your support with a LIKE and COMMENT below!
These video-style breakdowns take time and effort, and I’ll only continue them with your support 🙌
Your engagement is my biggest motivation to keep going 💛
Thanks for being part of the journey!

AERO Long Swing Setup – Strong Pullback into Fibonacci SupportAERO has shown notable strength in recent months and is now retracing into a key support zone, aligning with the 38.2% Fibonacci level. The $0.75–$0.80 area offers a solid long swing opportunity.
📌 Trade Setup:
• Entry Zone: $0.75 – $0.80
• Take Profit Targets:
o 🥇 $1.04 – $1.32
o 🥈 $1.60 – $2.05
• Stop Loss: Daily close below $0.70

Bitcoin Breakdown? Support Zone & CME Gap in FocusBitcoin ( BINANCE:BTCUSDT ), as anticipated in my previous analysis , attacked the Resistance lines and then resumed its decline. In previous analysis, both Long and Short positions could have been profitable .
Bitcoin is approaching a Support zone($106,800-$105,820) and the CME gap($106,645-$106,295) .
From an Elliott Wave theory perspective , it appears that Bitcoin has finally completed a five-wave impulsive move with the help of an Expanding Ending Diagonal .
I expect Bitcoin to attack the Support zone($106,800-$105,820) after breaking the lower line of the Expanding Ending Diagonal .
Note: To break through the Support zone($106,800-$105,820), Bitcoin may potentially use either a Head and Shoulders pattern or a Bearish Quasimodo formation.
Note: If Bitcoin breaks the Resistance lines, we can expect more pumps.
Cumulative Long Liquidation Leverage: $106,249-$105,094
Cumulative Short Liquidation Leverage: $109,483-$108,790
Please respect each other's ideas and express them politely if you agree or disagree.
Bitcoin Analyze (BTCUSDT), 1-hour time frame.
Be sure to follow the updated ideas.
Do not forget to put a Stop loss for your positions (For every position you want to open).
Please follow your strategy and updates; this is just my Idea, and I will gladly see your ideas in this post.
Please do not forget the ✅' like '✅ button 🙏😊 & Share it with your friends; thanks, and Trade safe.

Long positions have achieved profits, BTC market outlook📰 News information:
1. Pay attention to the trend of gold and US bonds
📈 Technical Analysis:
At present, BTC has rebounded and profited, and rebounded to around 108,000 again. 109,000 is also the upper track of the Bollinger Band. There is a certain suppression in the short term. Before the suppression fails to break through effectively, BTC may still fall into a weak and volatile market. If BTC hits resistance and pressure above 108,000-109,000 during the day, you can consider shorting. In view of the current volatile market, everyone must strictly control their positions, use leverage prudently, and do a good job of risk management to cope with market uncertainties.
🎯 Trading Points:
SELL 108,000-109,000
TP 107,000-106,000-105,000
In addition to investment, life also includes poetry, distant places, and Allen. Facing the market is actually facing yourself, correcting your shortcomings, confronting your mistakes, and strictly disciplining yourself. I hope my analysis can help you🌐.
TVC:GOLD OANDA:XAUUSD FX:XAUUSD FOREXCOM:XAUUSD PEPPERSTONE:XAUUSD FXOPEN:XAUUSD

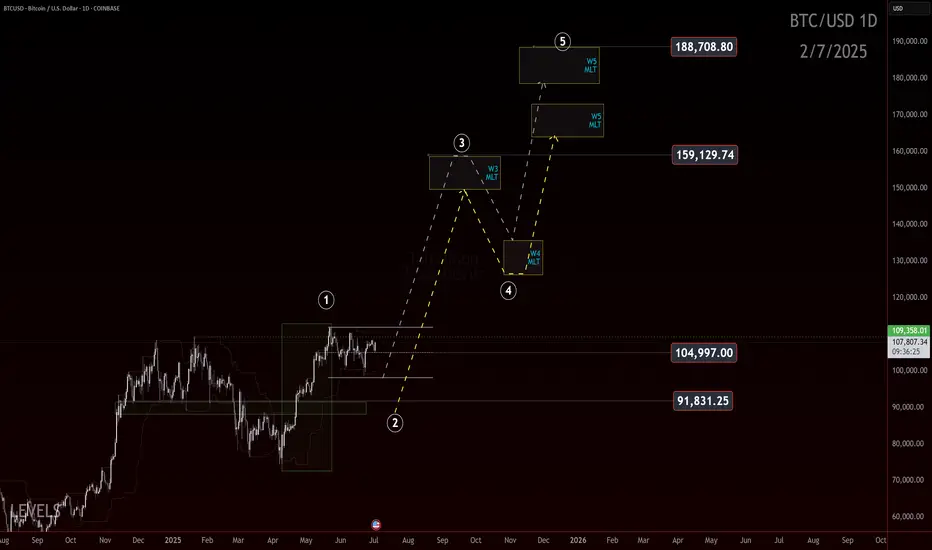
Bitcoin: 170k–180k?If you find this information inspiring/helpful, please consider a boost and follow! Any questions or comments, please leave a comment!
Bitcoin: 170k to 180k?
Let’s talk bias.
We’ve seen a powerful move off the 75k low, and it’s hitting some markers of a potential wave 1 impulse. If that structure holds and price doesn’t come back to wipe out the lows in a wave 2 retracement, then this is what we’d be looking at.
The idea? This is a conservative roadmap built off Elliott Wave Fibonacci projections and it targets the 170k to 180k zone.
Now, let’s be clear. This is a conservative projection. We’re not talking hopium fueled 250k moon targets here. We have no proof of that yet. We're anchoring the wave count and saying: if this is a 1, we’re due a 2, and then a 3 takes us to the upper levels.
But there’s a catch. Always is.
If price starts to fade back through the 91.8k area in a deep aggressive retrace, this roadmap gets less likely. Breaking the 75k pivot means the impulse structure failed or was misread, and we shift the count.
Until then, the 170k–180k level is a possible destination based on this roadmap.
Trade Safe!
Trade Clarity!
BITCOIN FLASHING EARLY BEARISH SIGNALS!!! (Don’t get trapped) I am explaining why Bitcoin might start crashing towards $93k. If we get enough confirmations, amazing RR short opportunities might be great money-making machines !!!

TOTAL Q3 As Q2 closes, Q3 begins...
The 2nd quarter of 2025 made up for a lot of the losses of Q1 peaking at $3.5T in the middle of the quarter. Since the peak a steady downtrend channel has formed and continues to be the case going into Q3.
What can we expect to see in the next 3 months in the crypto market? For me there are two different scenarios that are bullish, and one that is bearish IMO:
Bullish scenario 1 - The most likely scenario I think is a breakout above the downtrend channel and a move towards the range top. My reasoning for this comes from what we know about the driving forces in the market. Just last week BTC ETFs had a $2.2B net inflow, MSTR bought another 4,980BTC for $531.9m, various ETFs on the way for other majors such as SOL. Crucially the M2 money supply is at a record ATH. What that means is huge demand and the means to purchase with a what feels like a deadline closing in.
Bullish scenario 2 - We see a trend continuation until the range midpoint which has provided support before. It would coincide with the bottom of the trend channel and therefor I believe would provide a good launchpad for long positions.
Bearish scenario - For me this is the least likely situation but one that must be prepared for, a loss of the range midpoint would be a major setback, one that would mean a potential revisit of the range low in a symmetrical move down mirroring Q2s move up. The reason I believe this is the least likely is there is just too much in favor of risk on assets like crypto currently, I've mentioned the fuel that is the M2 money supply piling up to be deployed. A US interest rate cut all but confirmed for September and the institutional race for acquiring these assets before it is too late.
In conclusion just keeping it simple on the chart, a breakout above the trend channel is a great long opportunity to target the highs.
If BTC continues the grind down a great place for it to turn bullish is the range midpoint as has happened previously.
In the event BTC loses the midpoint a retest of the weekly low would make sense to me.

BTC's Situation, A Comprehensive Analysis !!!The situation has become quite strange. Bitcoin is forming deceptive patterns, and altcoins continue their downward trend. Currently, Bitcoin is positioned within two triangles—one symmetrical and the other descending. Now that Bitcoin has reached the top of the triangle and appears ready to break upward, it might actually be hiding yet another trap within the price action.
This market has shown disregard for technical patterns, and every time the price approaches historically significant levels, it reveals its true intentions and disappoints us. This cycle tends to repeat.
In my opinion, we’re likely to see one more drop in Bitcoin’s price. After that, instead of continuing the expected downtrend from the pattern, the price could break the descending formation and experience a strong upward move.
Stay Awesome , CobraVanguard.

CULT DAO ON ITS WAY TO A BILLION DOLLAR MARKET CAPIf you want an in-depth look at everything CULT DAO, check out the TA below:
This is just a technical update.
A massive breakout occurred as expected. I’ve been highlighting the divergence forming in the MACD for months — it’s all detailed in the TA above.
Over the last 1,096 days, CULT DAO has formed a giant descending wedge — both in price structure and on the MACD. The path was clear.
Onwards and upwards.
A billion-dollar market cap is very possible by Q4 2025.
Breakthrough tech.
Mainnet launch around the corner.
Rocket ship loading.

Check if price can hold above M-Signal indicator on 1D chart
Hello, traders.
If you "Follow", you can always get new information quickly.
Have a nice day today.
-------------------------------------
I failed to register a modified indicator of StochRSI indicator on TradingView alone, so I added it to the existing OBV by readCrypto indicator.
From the top of the indicator setting window to the bottom
1. OBV indicator of Low Line ~ High Line channel
2. PVT-MACD oscillator indicator
3. StochRSI indicator
They are registered in the order above.
Since the values used are all different, you should activate and use one indicator.
Please check the chart above.
------------------------------------------
(BTCUSDT 1D chart)
It is showing a downward trend as it failed to rise above the HA-High indicator (108316.90) on the 1D chart.
It is currently checking whether there is support near 107340.58, which is the StochRSI 50 indicator point.
If it fails to receive support and falls, it is expected to fall to around 104463.99.
The 104463.99 point is the DOM (60) indicator point of the 1W chart, which corresponds to the end of the high point on the 1W chart.
Since the StochRSI 20 indicator point is formed near the 104463.99 point, its importance can be considered high.
-
Since the M-Signal indicator of the 1D chart is passing near 106133.74, there is a possibility of volatility when touching this area.
Since the volatility period begins around July 2 (July 1-3), it is necessary to keep an eye on the current movement.
-
However, the key is to buy near the HA-Low indicator and sell near the HA-High indicator, so the current movement may be natural.
This volatility period is expected to last until around July 10 (July 9-11), so be careful when trading to avoid being fooled by fakes.
----------------------------------------
- The StochRSI indicator is showing signs of transitioning to a state where K < D.
- The PVT-MACD oscillator indicator is showing signs of decline.
- The OBV indicator of the Low Line ~ High Line channel is showing signs of decline in the High Line.
Therefore, if you look at the indicators, they are showing signs of decline overall.
However, if the OBV rises above the High Line, the price will show signs of rise.
Therefore, we need to observe the movements of the indicators while checking whether there is support at the StochRSI 50 indicator point.
Basically, the time to make a purchase is when it shows support near the DOM (-60) ~ HA-Low indicator.
If you want to make a purchase outside of that, you should not forget that a short and quick response is required.
The indicators that tell you the high point are HA-High, DOM(60) indicators.
In addition, there are StochRSI 80 and StochRSI 20 indicators that require quick response.
-
Thank you for reading to the end.
I wish you successful trading.
--------------------------------------------------
- Here is an explanation of the big picture.
(3-year bull market, 1-year bear market pattern)
I will explain the details again when the bear market starts.
------------------------------------------------------

Bitcoin summer of fun...If we are in a continuation pattern, and Bitcoin breaks the neckline soon.
We could be on the cusp of a very interesting and strong few months of price action.
Continuation upward sloping #inverseheadandshoudlers

BITCOIN Bull Cycle's next two probable stops..Bitcoin (BTCUSD) has been trading within a 2.5-year Channel Up throughout the entirety of its 2023 - 2025 Bull Cycle, showcasing incredible consistency. This is perhaps BTC's most stable Bull Cycle and that can help us estimate to some degree its next two key levels, before its tops.
As you can see, every major Higher High of this pattern has been either on or marginally above a +0.5 Fibonacci interval:
Fib 0.5 was the February 2023 High and Accumulation Phase.
Fib 1.0 the April - September 2023 Accumulation.
Fib 1.5 December 2023 - January 2024.
Fib 2.0 March - September 2024.
Fib 2.5 December 2024 - February 2025.
Right now the market seems to be attempting a break-out above a Bull Flag, following the massive April 07 2025 rebound on the 1W MA50 (blue trend-line), a level that has been the most optimal buy entry in the past 2 years.
The next stop based on this model is the 3.0 Fibonacci extension level at 133000, where there are high probabilities for the market to consolidate (accumulation phase) in preparation for perhaps the final stop and Cycle peak on the 3.5 Fib ext around 191000. As we've discussed on previous analyses, a final Target between those two around $150000 may be more fitting, carrying less risk into the final months of the Bull Cycle.
So what do you think? Do you believe that's the blueprint to follow until the end of the year/ Cycle? Feel free to let us know in the comments section below!
-------------------------------------------------------------------------------
** Please LIKE 👍, FOLLOW ✅, SHARE 🙌 and COMMENT ✍ if you enjoy this idea! Also share your ideas and charts in the comments section below! This is best way to keep it relevant, support us, keep the content here free and allow the idea to reach as many people as possible. **
-------------------------------------------------------------------------------
💸💸💸💸💸💸
👇 👇 👇 👇 👇 👇

Wait for your EDGE...
Discipline is what separates professionals from amateurs.
Stay patient. Wait for your edge. Let the probabilities work in your favor.
👉 “Agree with this? Hit Boost to spread the message.”
#TradingPsychology #Discipline #BTC #Bitcoin #Forex
#TradingMindset #AlBrooks #TradingDiscipline #PriceAction #ForexTrading #CryptoTrading #StockMarket #MJTrading #TradingQuotes #TraderLife #MindOverMarkets

HYPEUSDT Probably CookedToken driven by demand from trading on Hyperliquid. Crypto looks set for a few month long consolidation probably into Q4.
That loss in trading volume will reduce demand for the token and the company may be forced to sell the token to come up with large gains for its clients. Either way it's a bearish catalyst for the token which has really ran hard. Ugly head and shoulders as well as a topping pattern in an overall financial market that looks like it wants a pull back

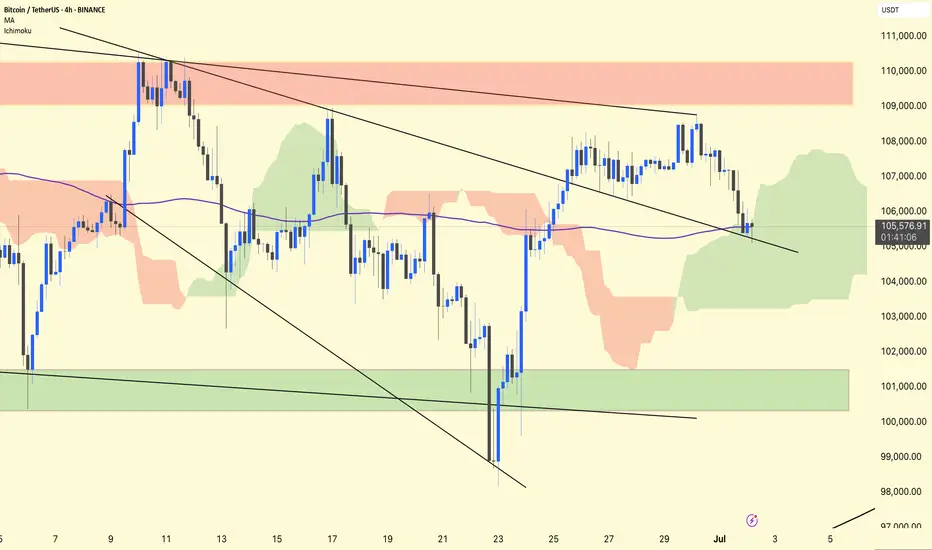
BTC/USDT 4H Analysis.
BTC remains in a retest phase after breaking out of the first descending broadening wedge.
The price has returned to test the upper wedge trendline, which is now acting as support around ~$105,500.
The purple 1 00-period MA (~105,570) overlaps this retest zone, adding additional confluence to the support.
Ichimoku
BTC is inside a green cloud, indicating indecision but not a confirmed trend reversal.
The cloud provides dynamic support in the ~$104,500–105,500 area.
Stay alert!
Bitcoin - An Epic Move Awaits!Bitcoin gained 13% in H1 2025, outperforming Ethereum and Solana, which dropped ~25% and ~17% respectively—highlighting BTC's strength in turbulent market conditions.
Institutional wedge: spot-BTC ETFs saw huge inflows—BlackRock’s took in $336M, and total crypto product inflows approached $45B+ this year.
AI models foresee BTC holding $105K+ by end-June, with ChatGPT pointing to $118K and Grok forecasting $108K, based on momentum and ETF flows.
We see BTC holding the 20 MA and spiking to new all time highs.

The Critical Blue Line – Will Bitcoin Soar or Sink
🔹 Bitcoin Technical Analysis – Key Blue Line, Bear Trap Possibility & Long-Term Scenario
On the Bitcoin chart, the blue horizontal level has acted multiple times as both support and resistance. The price has broken it several times but failed to sustain above, indicating high-volume decision-making zones by institutions and large players.
📉 Why this pattern keeps repeating:
Strong supply and demand concentration at this level.
Inability to break and hold shows market indecision.
Repeated fakeouts are likely used to shake out weak hands.
🔍 Important hidden scenario: Bear Trap Potential
If the price dips below the blue line but quickly reclaims it, it may form a bear trap, tricking short sellers into entering prematurely. This move could ignite strong bullish momentum from trapped sellers and renewed buyers.
🔮 If price holds above the blue line:
Signals market strength and potential bullish structure shift.
Targets:
109,800
117,200
120,000+ (Long-term)
📛 If support fails again:
Retracement toward the lower channel near 101,000 or lower is possible.
📊 Conclusion:
This zone is one of the most critical decision points in the current market. Traders should combine volume, candlestick behavior, and confirmation signals to avoid getting trapped by fake breaks
