Bearish reversal?The Bitcoin (BTC/USD) is reacting off the pivot and could drop to the 1st support.
Pivot: 108,836.36
1st Support: 103,622.00
1st Resistance: 112,088.89
Risk Warning:
Trading Forex and CFDs carries a high level of risk to your capital and you should only trade with money you can afford to lose. Trading Forex and CFDs may not be suitable for all investors, so please ensure that you fully understand the risks involved and seek independent advice if necessary.
Disclaimer:
The above opinions given constitute general market commentary, and do not constitute the opinion or advice of IC Markets or any form of personal or investment advice.
Any opinions, news, research, analyses, prices, other information, or links to third-party sites contained on this website are provided on an "as-is" basis, are intended only to be informative, is not an advice nor a recommendation, nor research, or a record of our trading prices, or an offer of, or solicitation for a transaction in any financial instrument and thus should not be treated as such. The information provided does not involve any specific investment objectives, financial situation and needs of any specific person who may receive it. Please be aware, that past performance is not a reliable indicator of future performance and/or results. Past Performance or Forward-looking scenarios based upon the reasonable beliefs of the third-party provider are not a guarantee of future performance. Actual results may differ materially from those anticipated in forward-looking or past performance statements. IC Markets makes no representation or warranty and assumes no liability as to the accuracy or completeness of the information provided, nor any loss arising from any investment based on a recommendation, forecast or any information supplied by any third-party.
Btc!

ETHBTC: Ethereum to outperform massively Bitcoin.ETHBTC turned neutral again on its 1D technical outlook (RSI = 41.566, MACD = -0.00033, ADX = 21.423) as in the past 4 weeks it failed to extend the rebound of the April 14th bottom. Ahead of a MACD Bullish Cross, a little further correction to make a Double Bottom (DB) would make the pattern more bullish, much like the December 9th 2019 DB. That was the start of Ethereum's bull season. Similarly, we expect it to start outperforming Bitcoin massively and approach the R1 level (TP = 0.0800).
## If you like our free content follow our profile to get more daily ideas. ##
## Comments and likes are greatly appreciated. ##

BTC daily bull flag formationBTC is looking bullish on the daily chart in my opinion. One more pullback might be in order before we test new highs on the daily chart. The 100 sma has crossed over the 200 sma and the 50 sma is crossing the 21 sma. The rsi is neutral at time of publication. This bullish breakout could occur in late july after a pullback in the near term.
I think bitcoin is setting up to make another all time high push as summer draws on.
Not financial advice. Do your own DD.
Thanks for viewing the idea.
Comment what you think is going to happen over the course of this summer.

HolderStat┆BTCUSD broke the trend lineOKX:BTCUSDT on the 3h chart is accelerating from a breakout above $104,000 after several consolidation phases. Price is approaching $109,000 resistance. A breakout above this could trigger a run toward $112K+.

How about another RR2 Short?Lets try for a RR2 Sell..
Entry: 107100
SL: 108500
TP1: 106000
TP2:104800
See below for Reason and Full Analysis:

Super high risk setup BTC with 60 R:RIt looks like BTC is about to close the weekly candle above 106K.
If the bulls are still in control, they need to act very soon. The 100K support level has been successfully retested, and now could be the time for a move upward.
📈 Trade Setup (Educational Purpose Only):
Entry: 106,040
Stop Loss: 105,431
Target: 144,000
Risk-Reward Ratio: 1:60
This is a super high-risk setup, but the potential reward is significant. Proceed with caution and always do your own research.

15 R:R setup for EthereumWe assume that this marks the beginning of a new uptrend for BTC. This setup offers an easy 15:1 risk-to-reward ratio.
Entry: 2534
Stop Loss: 2373.33
Target: 5000
This is for educational purposes only.

Trade setup for SUI 20 R:R. Now or never!!!BTC and ETH are already showing signs of reversal. Do you believe a bull run is coming? This might be a good setup before the market takes off. Risk-to-reward ratio of 20:1 — extremely risky but potentially very rewarding. Only two resistance levels left before reaching the all-time high (ATH).
Entry: 3.3944
Stop-loss: 3.1721
Target: 8.0000
This is for educational purposes only

BTC/USD 1h Chart Analysis: BTFDBitcoin is showing a bullish structure on the 1h timeframe with a potential move towards $109,000.
On smaller timeframes, it exhibits a clear "buy the dip" profile.
Key Levels:
$109,000: Potential upside target.
$107,000: Resistance/Support zone to watch for rejection.
$105,000: Low Volume Node (LVN*) a possible good long entry zone.
$102,000 - $100,000: Support levels to monitor if $105,000 fails.
Currently it have bullish trend with a potential dip near $105,000 showing good entry point.

BITCOIN Cup & Handle completed! Technical Target $169k!Bitcoin (BTCUSD) is about to complete the Handle of a Cup and Handle (C&H) pattern. This comes only days after breaking below its 1D MA50 (blue trend-line) buy holding the 1D MA200 (orange trend-line) and rebounding.
Well the 1D MA50 has been recovered and on top of that, the 1D MACD just formed a Bullish Cross. This (isolated) Bull Flag, which is the Handle, technically targets the 2.0 Fibonacci extension at $169000.
Do you think that's realistic or a little excessive within thin time-frame? Feel free to let us know in the comments section below!
-------------------------------------------------------------------------------
** Please LIKE 👍, FOLLOW ✅, SHARE 🙌 and COMMENT ✍ if you enjoy this idea! Also share your ideas and charts in the comments section below! This is best way to keep it relevant, support us, keep the content here free and allow the idea to reach as many people as possible. **
-------------------------------------------------------------------------------
💸💸💸💸💸💸
👇 👇 👇 👇 👇 👇

110K, maybe 112K at the bestMorning folks,
So, previous setup is done perfect, and BTC even reached 108K area. Now we think that upside potential is limited, at least in short-term. Price is coming to resistance area around 110K and previous top. Some intraday targets point on 112K area as well, but I wouldn't count now on something more extended.
The point is US Dollar stands at record monthly Oversold. So, its weakness in short term is limited as well. Besides, we're coming to very bumpy period of tariffs negotiations from 9th of July, debt ceil discussion and BBB voting, as early as tomorrow...
So for now, uncertainty and risk overcome the upside potential on BTC.

SatochiTrader Expecting a huge BTC CRASH AFTER This..BTC Market Update by SatochiTrader
EVERY CRASH DID START WITH A FALSE INCREASE TREND.
Depending on the market sentiment and price action, BTC is currently showing strength with a positive trend. However, based on deeper data and insights held by myself and a small group of early-cycle followers, this current movement may be a deceptive signal — potentially foreshadowing a major crash.
This is not trading advice. Those who are confident in the long position should continue, and those on the other side should stay prepared as well.
We have previously explained that the current cycle appears to have ended. Since 2013, BTC has consistently respected its macro cycle targets. The end of such a cycle typically leads to significant corrections.
A cycle ending implies not just a retracement, but the potential for a major crash. Hedge funds and real BTC whales understand the underlying indicators and risks at play. Our expectation remains clear: BTC may soon fall below the 100K level, with $85K identified as a critical support and target zone.
Stay sharp. Stay informed. The market may look bullish — until it isn't.
The best way to follow BTC is not the news.. but the cycle overview.
This update is an education update, which means the high expectations of the upcoming correction for BTC.
Compared to last quarter, miners are now less severely underpaid, though profitability remains low

Bitcoin is gearing up for 120K and 140K (1D)The flip zone has been reclaimed, but no proper pullback had occurred. The recent pullback came with a sweep of the all-time high (ATH), which has caused confusion and uncertainty among market participants.
In fact, this drop can be interpreted as a pullback to the flip zone, accompanied by an ATH hunt.
We expect the price, after touching the green zone and forming a base around this level, to move toward the targets of 120K and 140K — which we currently consider as Bitcoin’s final targets for this cycle.
A weekly candle close below the invalidation level would invalidate this analysis.
For risk management, please don't forget stop loss and capital management
When we reach the first target, save some profit and then change the stop to entry
Comment if you have any questions
Thank You

BTC Key levelsBTC key levels are below
These are very important levels for reversals and breakouts.
111, 898
97,893
89,362
74, 538

ADA Long Swing Setup –Support Holding, Watching for Retest EntryADA has held the $0.50 support level over the past few weeks. If price retraces into the $0.53–$0.55 zone, we’ll be looking to enter a long spot trade from support for potential upside continuation.
📌 Trade Setup:
• Entry Zone: $0.53 – $0.55
• Take Profit Targets:
o 🥇 $0.64 – $0.66
o 🥈 $0.71 – $0.75
o 🥉 $0.80 – $0.84
• Stop Loss: Daily close below $0.51

INJ Long Swing Setup – Breakout Retest Opportunity at Key LevelIf the crypto market pushes higher and INJ flips current resistance into support, we’ll be looking to enter on a retest of the $11.60 zone. This level could act as a launchpad for the next leg up.
📌 Trade Setup:
• Entry Zone: $11.60 – $11.60 (Breakout Retest)
• Take Profit Targets:
o 🥇 $14.20 – $16.25
o 🥈 $19.80 – $23.00
• Stop Loss: Daily close below $10.70

GOLD Trading: trategy: Look to SELL at resistance zone,downtrend🎯 Trade Setup:
Entry Zone (Sell Limit): 3,353 – 3,357 USD
Stop Loss (SL): 3,375 USD
Take Profit (TP): 3,280 – 3,283 USD
Risk-Reward Ratio: Approximately 1:3 → suitable for 2–4 session swing trades.
📊 Technical Analysis:
1. Overall Trend:
GOLD is clearly in a downtrend, confirmed by:
A descending trendline connecting recent lower highs.
Price consistently forming lower highs and lower lows.
2. Indicator-Based Analysis:
🔹 SMA 89 (Purple Line):
Price is trading below the 89-period SMA, confirming bearish momentum.
SMA89 acts as a dynamic resistance, and the 3,353–3,357 zone aligns with this resistance level.
🔹 BB20 (Bollinger Bands):
The upper band sits near 3,383, close to the SL zone → validating 3,375 as a proper stop.
Price is currently bouncing from the lower BB, so a rejection from the mid-to-upper band is likely, supporting a SELL setup.
🔹 Volume Analysis:
Volume is decreasing during this recent rebound, indicating:
Weak bullish pressure, typical of a corrective move.
The rally lacks conviction → strengthens the bearish case.

BTC - 103.5 - 102k when?OKay so the move as marked did move but is choppy, owing to the new pattern, lets see if triple tops are made and is done in a manner where it falls, LIQ shows at 108,800, BTC genuinely looks very very tired!

SPX is overheated, a correction is necessary📉 Market Update: No, It Has Nothing to Do with Trump
This move has nothing to do with Trump’s dramatic announcements. The reality is simple: the MACD on the daily chart is overheated, and a healthy correction is needed — likely down to the 5,520 level — before resuming the uptrend.
Now, does it surprise anyone that Trump acts like a PR agent for his investors? He always seems to drop “bad news” at the exact moment the charts call for a pullback. My guess? They're shorting right now.
🪙 Bitcoin Stalling
CRYPTOCAP:BTC is also losing momentum, and looks like it’s in need of a short-term correction as well. This suggests a week of consolidation ahead for the whole crypto market.
But let’s be clear:
🚀 The Bull Market Is Not Over
The weekly charts remain very bullish, and this trend could last another 4–6 months. The macro bullish structure for crypto remains intact.
However, in TradFi, there are cracks:
🔻 20-year bonds sold at 5.1% — a major recession red flag
💸 Tariffs are putting pressure on global trade
📉 The entire traditional market is starting to de-risk
🔮 What to Expect
Short-term correction to ~5,518 (first bottom target)
A possible rebound after healthy consolidation
A continued uptrend in crypto unless key support breaks
I’ll publish a new update when conditions change.
📌 Follow me to stay ahead of the market. And as always: DYOR.
#CryptoMarket #Bitcoin #MACD #TechnicalAnalysis #CryptoCorrection #BullishTrend #RecessionWarning #TradFi #Altcoins #BTC #MarketUpdate #TrumpEffect #DYOR

Next Volatility Period: Around July 2nd
Hello, traders.
If you "Follow", you can always get the latest information quickly.
Have a nice day today.
-------------------------------------
(BTCUSDT 1D chart)
The key is whether it can rise above 108316.90 and find support.
When OBV rises above the High Line, we need to check if the PVT-MACD oscillator switches to above the 0 point.
However, since the StochRSI indicator is currently showing signs of entering the overbought zone, I think there is a high possibility of resistance.
We need to check for support in the 108316.90-111696.21 zone, which is the high point boundary zone.
- If OBV fails to rise above the High Line,
- If the PVT-MACD oscillator fails to remain above the 0 point,
- If the StochRSI indicator falls from the overbought zone and switches to a state where K<D,
It is highly likely that it will eventually encounter resistance in the high point boundary zone and fall.
Therefore, what we need to do is to check for support near 108361.90-108353.0.
If it rises after that, we need to check for support near 111696.21.
Entering a new purchase in the high point boundary section is a very risky transaction.
Therefore, a short and quick response is required when making a purchase.
The basic trading strategy is to buy near the HA-Low indicator and sell near the HA-High indicator.
Do not forget this.
However, since the HA-Low or HA-High indicators are intermediate values, they may move in the opposite direction.
In other words, there is a possibility that the HA-Low indicator will receive resistance and fall, showing a stepwise downtrend, and the HA-High indicator will receive support and rise, showing a stepwise uptrend.
Therefore, you must check whether there is support in the low point boundary section of the DOM(-60) ~ HA-Low section or the high point boundary section of the HA-High ~ DOM(60) section.
To do this, you must trade in a split transaction method.
-
The next volatility period is expected to start around July 2 (July 1-3).
The reason why we calculate the volatility period is because it can be a turning point of the trend.
Therefore, making a new trade during the volatility period means that there is a high possibility of being caught in a fake.
-
Thank you for reading to the end.
I hope you have a successful trade.
--------------------------------------------------
- Here is an explanation of the big picture.
(3-year bull market, 1-year bear market pattern)
I will explain the details again when the bear market starts.
------------------------------------------------------

Descending broadening wedge after peak BTC/USD 4hCurrently BTC/USD is in a descending broadening wedge after a peak.
This means high chance of upward breakout. Price increase from breakout point is usually the difference from pattern top to pattern bottom, which would mean a price of $123000.
Not financial advice. There is a chance of this not playing out, even though the chance is small.

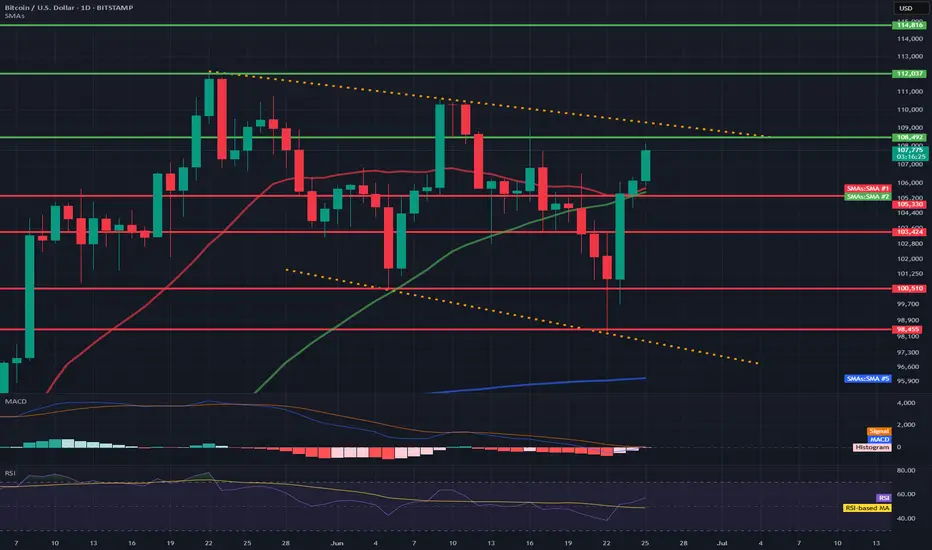
BTC/USD 1D Chart📊 1. Technical formation: Downtrend channel marked with orange lines
Upper trend line (resistance): ~108,200 – 110,000 USD
Lower trend line (support): ~98,455 – 97,000 USD
➡️ Such a formation usually ends with a breakout. The direction of the breakout will be key – currently, the price is testing the upper resistance line.
💵 2. Support and resistance levels
📈 Resistance:
108.202 – currently tested
112.037 – psychological level
114.816 – local top
📉 Support:
105.300 – SMA 50 + local support
103.424 – local lows
100.510 – key psychological support
98.455 – lower edge of the triangle
📉 3. Moving averages (SMA)
SMA 50 (green): currently as dynamic support (~105.300)
SMA 200 (blue): far below the price (~96.000), inactive in the short term
SMA 20 (red): price broke through it upwards – a signal of bullish strength
➡️ A bullish crossover took place between SMA 20 and SMA 50 → bullish signal.
📉 4. MACD (Momentum)
MACD line is approaching the intersection with the signal line from below.
The histogram is becoming less and less red → a potential intersection and a bullish crossover signal may occur any day now.
📉 5. RSI (Relative Strength Index)
Currently: 57.19
RSI is rising and approaching the overbought zone (70), but it is not overheated yet.
Exceeding 60 would be a signal of further bullish strength.
🔍 6. Volume and context
There is no volume marking on the candles, but:
The current bullish candle is strong and breaks through the key averages (SMA 20, 50).
This indicates buyer activity with technical support.
🟢 Bullish scenario (if a breakout occurs up)
A breakout above 108.200 with a close of the daily candle could open the way to:
112.037 (next resistance)
then even 114.816
🔴 Bearish scenario (false breakout)
A rejection from 108.200 and a drop below 105.300 → a possible return to:
103.424 or even 98.455 (lower triangle line)
Premium zone tagged — now we watch how the Smart Money reactsBitcoin just tapped into the 108,151 level — the top of a measured premium range and a likely area where profit-taking begins and fresh distribution footprints form.
This run-up wasn’t random. Price surged from inefficiency, cleanly filled the fair value gap (FVG), and is now flirting with a key liquidity pocket.
Here's what the structure says:
Premium reached: 108,151 (0% fib)
If rejection holds, Smart Money looks to discount entries:
0.236: 106,136
0.382: 104,889
0.5: 103,882
Deep retracement zone: 0.618 at 102,874
Final defense for bulls? The unmitigated FVG block between 101,440 → 99,613
Possible Playbook Scenarios:
Quick retrace → higher high:
Bounce off 104,889 or 103,882 before attacking 108,967+
Deeper sweep:
Into 102,874 (0.618) before Smart Money steps in again
Invalidation:
Break below 99,613 closes this bullish narrative and confirms a structural break
TL;DR Execution Logic:
Wait for retracement into 0.5–0.618 fibs
Look for bullish reaction (engulfing or SFP)
Upside targets:
108,151 (retest)
108,967 (liquidity sweep)
Further upside if momentum sustains
