BTC - Will the Bears finally get their chance?Buy Side Liquidity Sweep in Progress
Price is currently climbing toward a region densely packed with resting buy side liquidity, marked by multiple previous highs. The area around 108,900 to 111,000 is especially significant, with two clear liquidity pools stacked above recent swing highs. These levels are likely to attract price as market participants seek to trigger stop orders and induce fresh buying interest—setting the stage for a potential reversal.
Weakness in the Current Impulse
The recent rally has advanced with minimal retracement and virtually no visible Gaps. This lack of corrective structure often indicates imbalance and suggests the move is overextended. When price moves upward too cleanly, it tends to leave behind thin liquidity zones, making the entire leg vulnerable to a sharper correction once exhaustion sets in.
Fair Value Gap as a Draw Below
Below current price lies a prominent bullish Fair Value Gap around 104,000. This inefficiency was left unfilled during the last leg up and may now serve as a magnet for price. These types of Gaps are often revisited by the market in an effort to rebalance supply and demand, especially after aggressive moves that break structure to the upside.
Once the higher liquidity levels are swept, watch for a clear reaction—either a strong rejection or lower timeframe structure shift—which could signal that the top is in. If that shift materializes, price may begin a downward leg targeting the unfilled Gap below. The magnitude of the move, combined with the lack of structure on the way up, leaves plenty of room for corrective action.
For those looking to engage, waiting for confirmation on a lower timeframe—such as a break of short-term bullish structure or the formation of a bearish Gap—can help time entries more precisely. In setups like these, patience is key: let the Sweep play out, observe how price reacts, and only then consider stepping in.
Btc-bitcoin

Bitcoin Approaches PRZ – Will the Falling Wedge Break ?Bitcoin ( BINANCE:BTCUSDT ) failed to break through the Support zone($106,800-$105,820) after attacking it five times , and started to rise again.
Bitcoin is currently moving near the Resistance zone($109,220-$108,280) , Cumulative Short Liquidation Leverage($108,800-$108,085) , Potential Reversal Zone(PRZ) , and Resistance lines .
From a Classical Technical Analysis perspective , Bitcoin's movements over the past two days seem to have formed a Falling Wedge Pattern .
From an Elliott Wave theory perspective , Bitcoin appears to have completed the main wave 4 within the Falling Wedge Pattern. The structure of the main wave 4 was a Double Three Correction(WXY) .
I expect Bitcoin to attack the Resistance lines after breaking the upper line of the Falling Wedge Pattern . If Bitcoin fails to break the Resistance lines before the global markets close , we can expect Bitcoin to fall again. Because entering Saturday and Sunday , the trading volume is generally low , and I think Bitcoin needs a lot of volume to break the resistances .
Do you agree with me?
CME Gap: $106,645-$106,295
Cumulative Long Liquidation Leverage: $106,055-$105,430
Note: If Bitcoin manages to break the Support zone($106,800-$105,820), we should expect further declines.
Please respect each other's ideas and express them politely if you agree or disagree.
Bitcoin Analyze (BTCUSDT), 1-hour time frame.
Be sure to follow the updated ideas.
Do not forget to put a Stop loss for your positions (For every position you want to open).
Please follow your strategy and updates; this is just my Idea, and I will gladly see your ideas in this post.
Please do not forget the ✅' like '✅ button 🙏😊 & Share it with your friends; thanks, and Trade safe.

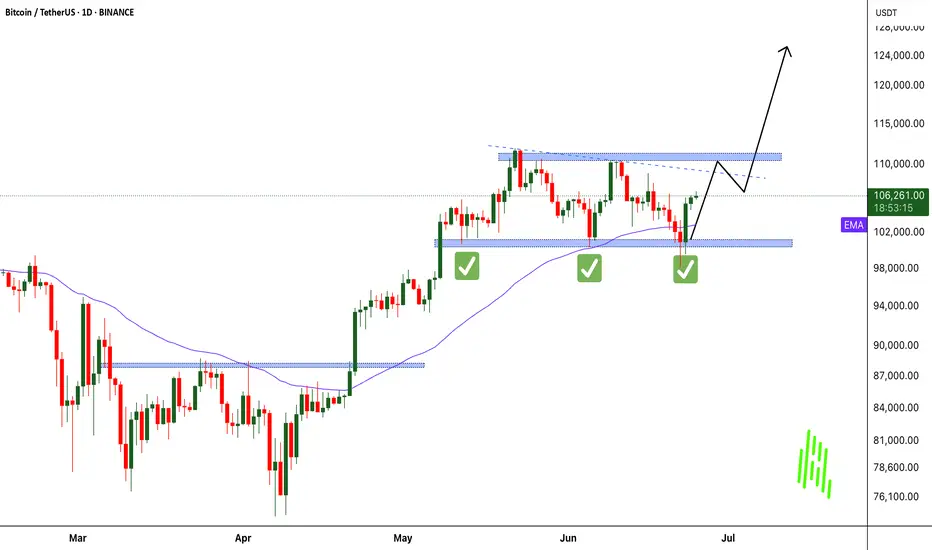
BTC - Falling Correction = Continuation?BTC has been playing by the rules lately!
Every time Bitcoin forms a falling correction, it turns out to be a bullish continuation pattern — and history might be repeating itself 👀
As shown on the chart:
Previous falling channels (flag/wedge structures) have consistently led to strong bullish impulses.
The current correction also appears to be a falling channel, hinting at another potential bullish leg soon.
As long as the structure holds and no major support is broken, the next target could be a new all-time high.
Let’s see if BTC continues to respect this textbook behavior.
📌 Remember: Falling corrections in an uptrend = healthy continuation!
📚 Always follow your trading plan regarding entry, risk management, and trade management.
Good luck!
All Strategies Are Good; If Managed Properly!
~Rich

BITCOIN ROAD TO $44k - UPDATEI am updating the leading diagonal formation development, together with other insights that, if synergized properly, can give us the early warning of a potential crash towards $44k!!!!

IRENs Incredible Surge Continue next wWeek?NASDAQ:IREN has been on a rampage since the April surging 175% and nearing all time high! A great couple of trades for us so far!
Price is likely to hit all time high next week with such a strong trend, where resistance and a pullback is a high probability.
The weekly pivot is $9.77, the most likely area for price to find support just above the 0.382 Fibonacci retracement (which will be dragged up to the weekly pivot once a new high is made).
Price discovery terminal target are the R3 & R5 weekly pivot points at $28 and $40.
Safe trading

HolderStat┆BTCUSD aiming for 112kBINANCE:BTCUSDT is forming a bullish continuation structure after bouncing from the mid-range. With support holding and consolidation patterns completing, price action suggests a rally toward the 115,000 resistance line. Triangle and consolidation behavior confirms a strong uptrend continuation setup.

MOONPIG - Solana Meme Coin Ready to Rocket in the Next Bull RunTechnical Analysis: Bullish Signals Flashing Bright:
The MOONPIG/USDT chart is painting a bullish picture. After a sharp retracement from its all-time high near a $125M market cap, the token has found solid support around $0.0045 and is now trading at $0.0052, showing signs of a reversal. Here’s what the charts tell us:
Breakout Momentum: On the 6-hour chart, $MOONPIG recently broke above a key downtrend line, signaling a shift from bearish to bullish momentum. A potential double bottom pattern suggests a continuation toward $0.008 or higher.
Support and Resistance: The $0.0045 level has held as strong support, with resistance looming near $0.0075 (a recent high). A clean break above $0.0075 could open the door to $0.01 or beyond, aligning with the 1.618 Fibonacci extension from the recent swing low.
With Bitcoin rallying and altcoins showing signs of life, $MOONPIG’s technical setup screams opportunity for traders eyeing a breakout.
Fundamentals:
Community Power: With over 18,000 holders as of early June 2025, $MOONPIG boasts a fiercely loyal community. Unlike many meme coins reliant on paid shills, its growth is organic, driven by retail investors who love its “normie-friendly” branding. Posts on X highlight strong morale, with users like JamesWynnReal calling it a “raging bull flag” poised for a $50M–$100M market cap.
Exchange Listings: Recent listings on HTX Global, MEXC, and LBank have boosted liquidity and visibility, with more exchanges reportedly in talks. These listings are a catalyst for retail FOMO, as seen in the $7M+ on-chain trading volume.
Solana’s Hot Streak: Solana’s fast, low-cost blockchain is the perfect home for meme coins like $MOONPIG. With Solana’s ecosystem thriving and retail interest in tokens like $POPCAT and SEED_WANDERIN_JIMZIP900:WIF soaring, $MOONPIG is well-positioned to ride the wave of altseason capital inflows.
Market Timing: As Bitcoin nears new highs and market sentiment turns bullish, low-cap meme coins historically see explosive gains.

Bitcoin Reaches PRZ with Bearish Signals — Is a Drop Imminent?Bitcoin ( BINANCE:BTCUSDT ) has reached the Potential Reversal Zone(PRZ) as I expected in yesterday's post .
Bitcoin is trading in the Heavy Resistance zone($110,720-$105,820) , Potential Reversal Zone(PRZ) , and near the Resistance lines .
In terms of Elliott Wave theory , it seems that Bitcoin has managed to complete the main wave 5 with the help of the Ending Diagonal . The structure of wave 5 can be different.
Also, we can see the Regular Divergence(RD-) between Consecutive Peaks.
I expect Bitcoin to drop to at least $105,400 .
Cumulative Short Liquidation Leverage: $107,334-$108,250
Cumulative Long Liquidation Leverage: $105,037-$103,392
Note: We could be in for a bit of excitement in the financial markets during Federal Reserve Chairman Powell's speech.
Note: Stop Loss(SL)= $109,020 = We can expect more pumps.
Please respect each other's ideas and express them politely if you agree or disagree.
Bitcoin Analyze (BTCUSDT), 1-hour time frame.
Be sure to follow the updated ideas.
Do not forget to put a Stop loss for your positions (For every position you want to open).
Please follow your strategy and updates; this is just my Idea, and I will gladly see your ideas in this post.
Please do not forget the ✅' like '✅ button 🙏😊 & Share it with your friends; thanks, and Trade safe.

Bitcoin short position After my win streak from previous trades on btcusd I happy to give me to the people who followed me
Here's another great trade for you
Short Bitcoin with a limit order at 108,500
Take profit at 101k , stop loss at 109,500
A 7.5 to 1 risk reward ratio 🔥😉
You can never find anybody trade Bitcoin like me

BEst long on Btc is at $104 600CRYPTOCAP:BTC
Our plan is still bullish
But price reached VAH
That's why some pullback is possible
$104 600 is key zone for me. POC + VWAP. I`ll take a long trade in a case of local confirmation.

BTC/USD 1h Chart Analysis: BTFDBitcoin is showing a bullish structure on the 1h timeframe with a potential move towards $109,000.
On smaller timeframes, it exhibits a clear "buy the dip" profile.
Key Levels:
$109,000: Potential upside target.
$107,000: Resistance/Support zone to watch for rejection.
$105,000: Low Volume Node (LVN*) a possible good long entry zone.
$102,000 - $100,000: Support levels to monitor if $105,000 fails.
Currently it have bullish trend with a potential dip near $105,000 showing good entry point.

SatochiTrader Expecting a huge BTC CRASH AFTER This..BTC Market Update by SatochiTrader
EVERY CRASH DID START WITH A FALSE INCREASE TREND.
Depending on the market sentiment and price action, BTC is currently showing strength with a positive trend. However, based on deeper data and insights held by myself and a small group of early-cycle followers, this current movement may be a deceptive signal — potentially foreshadowing a major crash.
This is not trading advice. Those who are confident in the long position should continue, and those on the other side should stay prepared as well.
We have previously explained that the current cycle appears to have ended. Since 2013, BTC has consistently respected its macro cycle targets. The end of such a cycle typically leads to significant corrections.
A cycle ending implies not just a retracement, but the potential for a major crash. Hedge funds and real BTC whales understand the underlying indicators and risks at play. Our expectation remains clear: BTC may soon fall below the 100K level, with $85K identified as a critical support and target zone.
Stay sharp. Stay informed. The market may look bullish — until it isn't.
The best way to follow BTC is not the news.. but the cycle overview.
This update is an education update, which means the high expectations of the upcoming correction for BTC.
Compared to last quarter, miners are now less severely underpaid, though profitability remains low

BITCOIN BULL TRAP!!!? IS THIS YOUR SHORT ENTRY TO $44k?I am explaining a potential Bitcoin’s leading diagonal formation, that is forming an UHTF wave 1, that if successfully formed can be a start of the crash towards 44k!

2/1/15I’ve found a fractal on Bitcoin. Today is June 25, 2025, 13:22 — I’m analyzing the 2-hour timeframe from the high on May 22 up to today, and the same pattern of pre-accumulation is forming as in 2024, from March 13 to July 29, 2024.
We are also inside a pattern I named “Dragon’s Wings.” It forms two peaks at the highs after a strong rally, and the shared low between them creates a deep retracement.
Whether this pattern leads to the beginning of a major drop and a bear cycle, or whether it’s a pre-accumulation structure in a buffer zone, depends on the area in which it forms.
In this case, the 93–74K zone is potentially a re-accumulation zone, with a reversal to the upside — possibly taking Bitcoin above $140,000.

What now BTC?#bitcoin price has been moving in an ascending wedge for a few days. Although ascending wedges may end up bearish, there' s another chance for #btc price to break out this wedge and catch upper liquidities above 108K. But, also there' s a bearish divergence has been forming in this lower time frame chart of #btcusdt .
Maker may ignore this divergence and allow bots to print another HH but it' s now wise to be careful and watch out. The reverse is acceptable for #usdt dominance chart.
Breaking out 110K is the temporary invalidation of bull trap and above 120K is the complete invalidation.

Bitcoin Roadmap: Key Levels to WatchBitcoin( BINANCE:BTCUSDT ) managed to pump as I expected yesterday , of course, the main catalyst could have been the ceasefire announcement between Iran and Israel , which had a major impact on high and medium risk assets in the financial markets .
Bitcoin is once again moving near the Heavy Resistance zone($110,720-$105,820) and the Resistance zone($107,520-$106,100) after breaking the Resistance lines .
In terms of Elliott Wave theory , it seems that given Bitcoin’s bullish momentum , Bitcoin has completed the main wave 3 and is currently completing the main wave 4 on the 1-hour time frame . The corrective wave structure of wave 4 could be a Double Three Correction(WXY) .
I expect Bitcoin to start rising again near the Support zone($104,380-$103,060) , 50_SMA(Daily) , Support lines , and Cumulative Long Liquidation Leverage($104,412-$103,812) to rise at least to the Potential Reversal Zone(PRZ) and Resistance lines .
Note: Stop Loss(SL)= $102,600 = We can expect more dumps.
Please respect each other's ideas and express them politely if you agree or disagree.
Bitcoin Analyze (BTCUSDT), 1-hour time frame.
Be sure to follow the updated ideas.
Do not forget to put a Stop loss for your positions (For every position you want to open).
Please follow your strategy and updates; this is just my Idea, and I will gladly see your ideas in this post.
Please do not forget the ✅' like '✅ button 🙏😊 & Share it with your friends; thanks, and Trade safe.

Bitcoin Reclaims Momentum: War Fears Fading, Bulls Eye $125K! MARKETSCOM:BITCOIN just delivered a powerful bounce right off the critical $100K level. A key psychological and technical support zone tested multiple times in recent sessions. This time, the bounce came with strong volume confirmation, signaling renewed buyer interest. As geopolitical tensions in the Middle East begin to ease, market confidence is returning, fueling bullish sentiment across the board.
CRYPTOCAP:BTC now looks poised to retest the $110K resistance zone, where some short-term rejection could occur. However, a decisive breakout above $110K opens the gates for a potential rally toward the next major target at $125K. Stay sharp, always manage your risk, and don’t forget to set a proper stop loss. The trend is strong, and momentum is building!
Follow Our Tradingview Account for More Technical Analysis Updates, | Like, Share and Comment Your thoughts
BTCUSD: Minimum target for this Cycle is 150,000Bitcoin turned neutral again on its 1D technical outlook (RSI = 52.882, MACD = -410.600, ADX = 22.509) as it recovered the losses of the last 2 days thanks to the Truce announcement between Israel and Iran. The long term picture couldn't be more bullish however as it hasn't even hit the bottom red zone of the Logarithmic Growth Curves model. According to the Time Cycles that mark each Cycle High, the Top for this Cycle is estimated to be between October and December. By October 2025, the top of the first profit taking zone (lightest pink) would be $150,000. That is technically the bare minimum of Top that should be expected based on the current LGC model. Technically it can even hit $200,000 but fundamentals have to help a lot in this scenario (adoption, ETFs, rate cuts).
## If you like our free content follow our profile to get more daily ideas. ##
## Comments and likes are greatly appreciated. ##

Something Like ThisI believe the charts are pointing towards the market gearing up for a play somewhat like this.
The timing may well be off, but the levels and sequence seem broadly predictable.

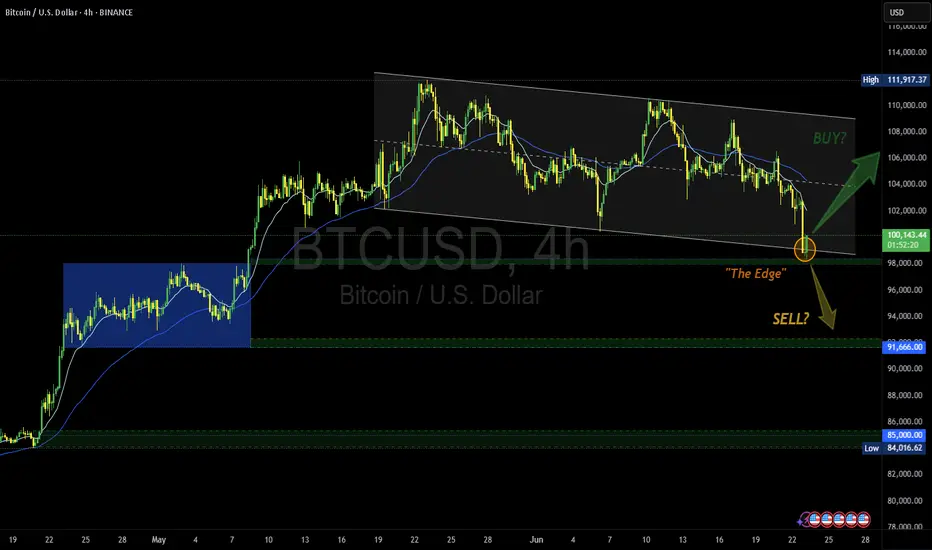
Another Edge - Decision time | Buy? or Sell? share your opinionTitle: BTCUSD: At The Edge – Decision Time Looms
Idea: Bitcoin is currently flirting with "The Edge"—a key decision zone near $98,000 where trend dynamics could shift sharply. After touching the lower boundary of a descending channel, BTC is testing support that could mark either a springboard for a bullish reversal or a trapdoor for further downside.
If bulls reclaim territory above the descending resistance line and push toward $104,000, we may see a trend breakout and renewed upside momentum. Confirmation with volume would strengthen the case for a long position, targeting the $111,917 level.
However, failure to hold "The Edge" could open the door to a swift move lower toward the $91,666 then $85,000 support zone, especially if accompanied by broader risk-off sentiment.
Trade Plan:
• Long above $100K with confirmation and strong volume;
target $111,917.
Stop below $97K.
• Short on breakdown below $97K with bearish momentum;
target $91,666.
Stop above $100K.
Watching: Volume spikes, macro news, and behavior around the channel boundaries.
🚀 Will Bitcoin bounce off the edge—or fall into the abyss?
#MJTrading #BTC #Bitcoin #Buy #long #chart #signal #forex
BTC is the champion our portfolio needs. BTC has some work to do. Either it will correct for a nice confrimatio low or strucure out for a bull fag. Either way, the price remains within a downward-sloping channel. That keeps me neutral bullish. But until I see a pivot point structure with signs of divergence in oversold conditions, it's difficult to get a proper RR.
Full TA: Link in the BIO

ADA | BTC | ET | Why ALTSEASON is COMING SOONAfter a -34% retracement, ADA is ready to go higher alongside with the rest of the alt market.
We see a very interesting phenomena here, were ADA also represents a large part of the larger alts: BTC pulls back, ETH is starting to increase or trades sideways (before the increase) whilst the alts dip.
This is actually BULLISH for alts, showing the very clear rotation between BTC, ETH and top 15 alts.
If we look at the macro of ANY of the alts I've been working through recently, a similar pattern appears - a clear bottom, followed by a sideways trade. This is usually the point just before the big ALTS season.
We actually see this pattern at the end of the 2018 rally, as well as after the 202- Covid dip:
The bottom line -
ADA and other alts are gearing up for their ALTSEASON. With patience, we will soon see some great gains across the markets.

Bitcoin Breakout Incoming? Flash PMI & CME Gap in FocusBitcoin ( BINANCE:BTCUSDT ) started to fall ( about -4%) after the news that the US was involved in the Middle East tension , but it has risen again with good momentum .
Do you think Bitcoin will go below the previous bottom($98,200) again on the 1-hour time frame?
Bitcoin is trading in the Resistance zonezone($102,130-$100,700) and near the Resistance lines .
In terms of Elliott Wave theory , it appears that a Double Three Correction(WXY) has been completed near the Potential Reversal Zone(PRZ) . Also, the first 5 microwaves of the Impulsive have now been completed .
---------------------------------
Bitcoin traders should monitor today’s Flash Manufacturing (expected 51.1) and Services PMI (expected 52.9) . Both forecasts are already lower than last month’s figures (51.3 and 54.8) , but I see a chance they come in even weaker.
Why weaker PMI is likely?
Slowing retail sales and softer labor data point to reduced consumer demand.
High interest rates are starting to pressure both the production and services sectors.
Regional Fed surveys already showed a cooling in business activity.
If the PMI prints below expectations, the market may anticipate a more dovish Fed, pushing the dollar( TVC:DXY ) down and giving Bitcoin a potential bullish boost.
---------------------------------
I expect Bitcoin to move towards filling the CME Gap($103,730-$102,275) after breaking the Resistance lines , and if the Resistance zone($104,380-$103,060) is broken, we should expect further increases.
Cumulative Short Liquidation Leverage: $103,391-$103,934
Cumulative Long Liquidation Leverage: $100,800-$100,250
Cumulative Long Liquidation Leverage: $97,691-$97,241
Note: Increased tensions in the Middle East or new and important news surrounding this news can make the analysis invalid, so be more careful with capital management.
Note: If Bitcoin can touch $98,170 , we can expect more dumps.
Please respect each other's ideas and express them politely if you agree or disagree.
Bitcoin Analyze (BTCUSDT), 1-hour time frame.
Be sure to follow the updated ideas.
Do not forget to put a Stop loss for your positions (For every position you want to open).
Please follow your strategy and updates; this is just my Idea, and I will gladly see your ideas in this post.
Please do not forget the ✅' like '✅ button 🙏😊 & Share it with your friends; thanks, and Trade safe.
