BTC Roadmap — May 2025🚨 BTC Roadmap — May 2025
Here’s the timeline you’ll want to pin and come back to.
⸻
🔴 May 4–6
Low volume. No major moves expected.
BTC goes DOWN and BTC dominance starts trending down, but it’s not the moment to jump in yet. Patience.
🟢 May 7–9: ALT PUMPS
BTC Volume increases!
BTC UP
This is the first major altcoin opportunity.
🔴 May 10–13: SELL SIGNAL
This is your exit window.
1D SELL confirmed. Prepare for cooling.
BTC Volume drops.
⚪️ May 15–17: May USDT.D will go UP!
USDT dominance reaches a local bottom - BTC HUGE DUMP .
BTC Volume rises again → BIG MOVE up after 17th.
🟢 May 17–20: BTC and ALT PUMPS
Perfect LONG entry zone.
🔴 May 21–23: USDT HIGH — market will go UP faster!
USDT.D peaks. BTC and altcoins prepare for breakout.
BTC Volume high.
💸 Dollar weakens → Risky assets explode (BTC, alts, growth)
⸻
NOT FINANCIAL ADVICE
Btc-bitcoin

"Bitcoin Analysis" (Update)Here's what I can gather from the chart right now:
The Minor Resistance zone has been strongly broken to the upside; we haven't seen good pullbacks to this level yet.
On the other hand, below the broken zone, there's a price gap toward the FVG, as indicated by the arrow.
Also, the pullback to the breakout level at 0.382 has not been completed, and no patterns have formed in that area!
So? When we analyze all the breakout factors, we see a very high chance of a correction.
Now, this correction could start from the confirmation level at 96,364, or with an overextension, it could happen from the 98k zone.
Stay Awesome , CobraVanguard

BTC breaks out - Can it sustain the bullish momentum?Over the past week, Bitcoin (BTC) has shown notable strength, forming an ascending triangle pattern, a typically bullish structure that often resolves to the upside. True to form, BTC has now broken out above the triangle's resistance, pushing higher with strong momentum.
-------------------------------
Price target ascending triangle
This breakout sets a technical price target above $98,000, suggesting there’s still significant upside potential if the pattern plays out fully. However, the rally is now approaching a critical test.
-------------------------------
Golden Pocket + POC
BTC is currently moving into a zone of strong resistance, both the Golden Pocket Fibonacci retracement level and the Point of Control (POC) from recent months converge in this area. These technical levels often act as magnets for price and can serve as significant barriers, potentially leading to a pullback or consolidation.
-------------------------------
Stochastic RSI
Adding to the caution, the daily Stochastic RSI remains in overbought territory, where it has lingered for an extended period. While this doesn’t guarantee an immediate reversal, it does suggest that a corrective move could be on the horizon.
-------------------------------
Conclusion
Still, there's a chance BTC could first push toward the psychologically significant $100K level before any major retracement occurs. Traders should keep a close eye on how BTC behaves around this key resistance area, confirmation or rejection here will likely shape the next major move.
-------------------------------
Thanks for your support.
- Make sure to follow me so you don't miss out on the next analysis!
- Drop a like and leave a comment!

BTC Outlook May 2025CRYPTO:BTCUSD
Bitcoin Nears Major Resistance – What Comes Next?
As of this writing, Bitcoin is trading around $96,000, climbing steadily as it approaches what I believe is a critical resistance zone between $98,000 and $102,000. This area has the potential to act as a major turning point.
If Bitcoin can break through and hold above the $102,000 level, I believe there's a strong chance we see continued momentum pushing the price toward $120,000 or even higher. However, if Bitcoin is rejected at this resistance zone, it could mark the beginning of a retracement, with the next major support area appearing around the $71,000 level.
This zone of resistance is, in my view, one of the most important to watch in the current cycle. Whether Bitcoin can establish new support above it—or get turned away—could shape the trajectory for the rest of the year.
Previous Bitcoin Outlook
Disclaimer: The views expressed in this article are my personal opinions and should not be considered financial or investment advice. Trading cryptocurrencies involves significant risk, and you should always do your own research and consult with a financial advisor before making investment decisions.

BUY BTCUSD ScalpI am buying BTCUSD 96000, lets try this for a short scalp. This is my personal bias, practice at your own. No any financial advise just for learning purpose.

NZDJPY BULLISH OR BEARISH DETAILED ANALYSIS ??NZDJPY has successfully completed a bullish breakout from the descending channel structure that has been forming since mid-2024. The price action respected the trend boundaries flawlessly, and the breakout above the upper trendline confirms a reversal from the previous downtrend. Now trading around 86.200, this pair is showing strong momentum, supported by both technical breakout validation and fresh bullish sentiment in the market.
The pair is now targeting a measured move towards 93.000 in the coming weeks. The breakout is supported by increasing risk appetite across markets, as investors shift from safe-haven currencies like the Japanese Yen toward riskier assets such as the New Zealand Dollar. The sharp rejection from the lower trendline and the steady climb through April and early May marks the beginning of a potential bullish cycle. Traders should watch for retests and bullish continuation patterns to ride this wave.
Fundamentally, the New Zealand economy is seeing upward momentum with recent improvements in dairy exports and a surprise drop in unemployment to 3.8%, beating expectations. On the other hand, Japan’s stagnant inflation data and dovish Bank of Japan stance have weakened the Yen further. The widening interest rate differential between the Reserve Bank of New Zealand and the Bank of Japan continues to favor the Kiwi. This macro backdrop aligns with the technical breakout, offering additional conviction to bullish traders.
With technicals and fundamentals now in alignment, NZDJPY offers a high-probability long setup. Breakout traders and trend followers should consider riding this move toward the 93.000 target, with trailing stops to lock in profits as momentum continues. Keep an eye on global risk sentiment, commodity prices, and upcoming economic data from New Zealand for confirmation along the way.

Bitcoin Range-Bound in Heavy Resistance – CME Gap Still Open!Bitcoin ( BINANCE:BTCUSDT ), like Gold , has been moving in a Range for the past 5-6 days and is currently in a Heavy Resistance zone($95,950-$88,500) , as it has been in the past few days .
In terms of Elliott Wave theory , Bitcoin appears to be completing a main wave 4 . The main wave 4 structure can take two forms: Double Three Correction(WXY)_Expanding Flat(3-3-5) .
I label this analysis " Short " for the following reasons:
Due to Bitcoin's higher correlation with the S&P 500 Index ( SP:SPX ) these days, I am short on the S&P 500 Index.
China’s president Xi Jinping says Trump lied about them having a phone call ; it is NOT good news for the S&P 500 Index and Bitcoin .
CME Gap($92,525-$91,415) has NOT filled yet, and I think Bitcoin will NOT start the next bullish rally before filling the CME Gap.
I expect Bitcoin to drop to at least $92,830 and then decline to the Support zone($92,000-$91,400) if the Support lines are broken.
Cumulative Short Liquidation Leverage: $96,741-$95,520
Note: If Bitcoin can touch $97,000, we should expect more pumping.
Note: If Bitcoin goes below the 100_SMA(Daily), we should expect a fall.
Please respect each other's ideas and express them politely if you agree or disagree.
Bitcoin Analyze (BTCUSDT), 1-hour time frame.
Be sure to follow the updated ideas.
Do not forget to put a Stop loss for your positions (For every position you want to open).
Please follow your strategy and updates; this is just my Idea, and I will gladly see your ideas in this post.
Please do not forget the ✅' like '✅ button 🙏😊 & Share it with your friends; thanks, and Trade safe.

Top of ABC correction on Bitcoin ~ ShortBitcoin has had quite the run up since 2023 and is currently in an ABC corrective pattern after a 5 wave impulse. The January high was the starting point. The April low was A. Now is the top of B which happens to be 0.618 retracement of the A wave. What follows is a down move for C which should end somewhere between 63k and 53.5k. This will make a bottom and will stay in accumulation until late 2027 early 2028 before shooting to the upside in anticipation of the next halving.

Sell in May and go away, but when? 🧭 Current Situation:
📈 Market remains bullish, but I anticipate possibility for S&P500 to drop on US open. If that happens, BTC can also make a dip, but since it looks much stronger than stocks, that drop might not be a big one. Nevertheless area around 95k looks very attractive.
⚠️ Price will need to show stronger bearish pressure to trigger any real panic or sell-off. Until then, this looks more like healthy volatility within trend continuation.
🧱 The breakout level at 95770 was already re-tested, so it’s now off my watchlist. The next meaningful support is around 95K flat.
---
🔥 CME Gap Update:
4H CME gap has expanded — now stretching from 95280 to 96560
This zone will act as a magnet in the coming sessions until it gets filled.
Just a quick reminder — 4H CME gaps are not as strong or reliable as Daily gaps. They don’t carry the same close rate or magnetism.
However, they can still offer directional hints and serve as target zones, especially in short- to mid-term setups. Use them as guidance — but don’t treat them like guaranteed gravity wells.
🎯 Key Levels to Watch
• Bullish Targets: 97666 / 98500 / 99431
• Bearish Targets: 94971 / 94125 / 93550
---
🔥 BTC Liquidation Heatmap
Above: 97530 / 98191 / 98998 / 100100
Below: 96063 / 95623 / 94670 / 93715

Probably nothing btcBitcoin has not yet recorded a real increase in percentage growth compared to previous cycles, so 2025 seems to be accompanied by surprising movements

$BTC Huge Daily Close Above the .618 Fib !Very BIG Daily Close for ₿itcoin above the .618 Fib 🥵
CRYPTOCAP:BTC needs to close the next week in or above the green box demand area in order to keep the rally alive and flip resistance into support.
As I originally mentioned in my idea, PA either needs to correct accordingly or this is the long-awaited PARABOLA in the making.
I still stand with my original belief on how this will play out, and have numbered my ideas accordingly.
1. Correct to 200DMA
2. Correct to 50DMA
3. Inverse Head and Shoulders reversal pattern
4. PARABOLA 🚀
I hope it's time to MOON more than anyone!
but I still have a good chunk of cash on the sideline in case the market needs more time 🤓

BTCUSDT forming a Bullish Flag patternBitcoin (BTCUSDT) is currently forming a classic bullish flag pattern on the daily chart, often regarded as a strong continuation setup in technical analysis. The breakout from the prior descending wedge has already provided strong bullish momentum, and now BTC is consolidating just below key resistance, signaling the next possible leg upward. With volume steadily increasing during this consolidation phase, this flag pattern holds significant potential for a breakout rally.
The price structure reflects healthy accumulation, where smart money seems to be stepping in before the anticipated surge. The flagpole leading up to the pattern shows strong bullish dominance, and the sideways flag structure suggests that Bitcoin is merely taking a breather before pushing higher. A confirmed breakout from the flag could target an upside of 20% to 30%+, aligning with the projected price move shown on the chart.
Fundamentally, Bitcoin continues to gain mainstream traction, and the broader crypto sentiment is turning positive again. The volume patterns and technical indicators reinforce the bullish outlook. Investors are showing renewed interest, especially as BTC holds above key psychological and structural levels, which adds confidence to the continuation narrative.
This setup is ideal for breakout traders and investors looking to capitalize on short to mid-term gains. If the bullish flag plays out as expected, BTC could make another significant move toward its all-time high zone.
✅ Show your support by hitting the like button and
✅ Leaving a comment below! (What is You opinion about this Coin)
Your feedback and engagement keep me inspired to share more insightful market analysis with you!

Bitcoin 1-Hour Chart: Quick Market BreakdownIn this concise market review, we'll analyze the latest movements on Bitcoin's 1-hour chart.

btc. SHORT to LONGwe saw a nice price rotation downwards, following the idea of NY giving up the SFP on tuesday and started looking for lower prices themselves.
SHORT entry running ASIA high at 2pm
entry . 95146
tp1 . 93453 . +1.78%
the 1h SUPPORT LEVEL of ASIA . 92902
held SUPPORT during that down price rotation.
LONG IDEA
see a rotation to dOpen / cw0.5 / value area Low / micro SFP / 2pm
entry . 94000
tp1 . 96.972
at 1 step extension of cw

EYES ON THESE TWO HYSTORICAL TRENDLINESWe are at a crucial point, the price is touching a cross between two trend lines that have lasted for YEARS.
Decisive moment for BTC.
If it breaks to the upside we will fly.
For the moment I value a short position with SL just above the trend lines.
Good Luck

ONDO Trade Setup – Range Support + Fibonacci ConfluenceONDO has retraced to a key confluence zone, aligning with both lower range support and the 38.2% Fibonacci retracement level. This presents a solid opportunity for a long spot entry, especially if bullish confirmation follows.
🔹 Entry Zone:
Around $0.90
🎯 Take Profit Targets:
🥇 $1.15 – $1.25
🥈 $1.40 – $1.55
🛑 Stop Loss:
Just below $0.85

btc . month . outlookLONG worked out nicely, BUT there was no SFP liguidity grab at cw/cmHigh
- finished LONG trade with 10pm (+2h tz)
- price dropped below entry . out of LONG . looking for lower new entry
As we're just before a new monthly open, possibility for retrace during Month May enhances
- This would give a nice new SWING LONG entry
- As well as a nice SHORT entry to ride the rotation downwards
Tuesday gave up a couple of SUPPORT levels . got me to shift SHORT for wednesday
- scaling SHORT at fib + cw0.75
Invalidation:
Running stops at 92.750 and recovering above cw0.5

Do you think I'm joking ???I might be wrong and this might never happen, but it might come true From a technical perspective!!!
Give me some energy !!
✨We spend hours finding potential opportunities and writing useful ideas, we would be happy if you support us.
Best regards CobraVanguard.💚
_ _ _ _ __ _ _ _ _ _ _ _ _ _ _ _ _ _ _ _ _ _ _ _ _ _ _ _ _ _ _ _
✅Thank you, and for more ideas, hit ❤️Like❤️ and 🌟Follow🌟!
⚠️Things can change...
The markets are always changing and even with all these signals, the market changes tend to be strong and fast!!
BTC/USDT 1H Chart Analysis: Breakout Incoming?Hey traders! Let’s dive into this juicy BTCUSDT 1-hour chart. Bitcoin is teasing us with some serious action!
We’ve got a textbook symmetrical triangle pattern forming, with price consolidating tightly between converging trendlines. This is a classic setup for a big move — Bitcoin is coiling up like a spring, ready to explode!
The chart shows multiple phases of consolidation , with the latest triangle pushing BTC toward a critical decision point near the weekly high of $95,773.15 and the monthly high of $95,119.06.
The price is currently hovering around $95,000, testing resistance. A breakout above the upper trendline could send BTC soaring past $96,600, potentially targeting $97,200 or higher!
On the flip side, a rejection here might see it dip toward the daily low of $92,839.27 or even the lower trendline for support.
Key Levels to Watch:
Resistance: $95,773.15 (weekly high)
Support: $92,839.27 (daily low)
Breakout Target: $97,200+
Breakdown Target: $92,800
✉ What do you think — bullish breakout or bearish?
Drop your thoughts below!

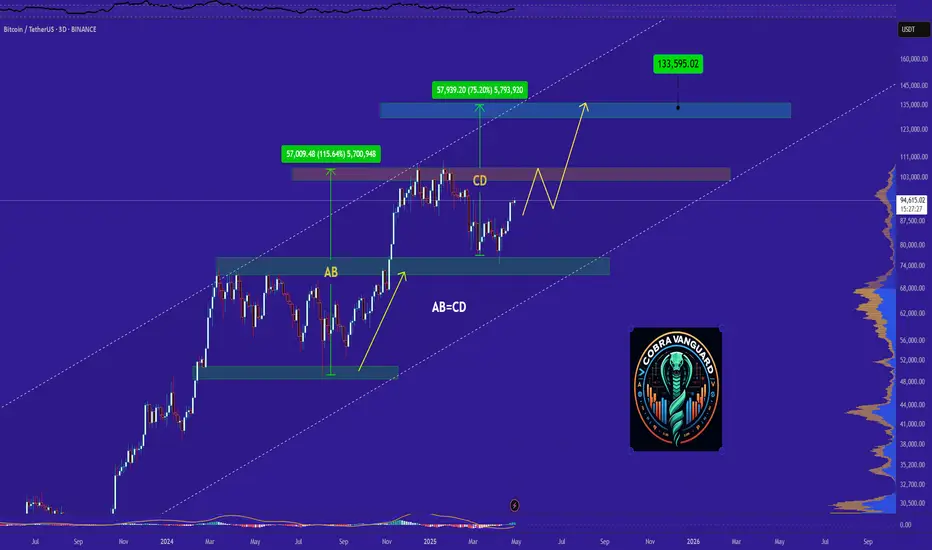
BITCOIN Why is this rally surprising you?Bitcoin (BTCUSD) has completed 3 straight green weeks, with an impressive last 1W candle closing and started the new one right where it left. This rise shouldn't be surprising to most as it has fulfilled all the conditions that initiated all major rallies since the November 2022 Bear market bottom.
The first week of April rebounded strongly on the 1W MA50 (blue trend-line), which as mentioned numerous times on our channel, has been this Bull Cycle's main Support and kickstarted the Q4 2023 and Q4 2024 rallies.
At the same time, the 1W RSI broke last week above its MA, which has been the final confirmation of those Bullish Legs. With the 1W Bollinger Bands (BB) still ranged, the top trend-line is expected to rise aggressively as BTC's uptrend accelerates, something that resembles October 2023 and October 2024.
Throughout this Bull Cycle, those rallies have lasted around the same time, the longest being 14 weeks. As a result, the latest the current Bullish Leg tops should be on the week of July 14 2025 and a +92% rise as February - March 2024 should deliver a test of the Higher Highs trend-line around $140000.
Do you think that's the most probable scenario? Feel free to let us know in the comments section below!
-------------------------------------------------------------------------------
** Please LIKE 👍, FOLLOW ✅, SHARE 🙌 and COMMENT ✍ if you enjoy this idea! Also share your ideas and charts in the comments section below! This is best way to keep it relevant, support us, keep the content here free and allow the idea to reach as many people as possible. **
-------------------------------------------------------------------------------
💸💸💸💸💸💸
👇 👇 👇 👇 👇 👇

GBPJPY DETAILED TECHNICAL AND FUNDAMENTALSGBPJPY is currently trading around the 191.00 zone, and price action is forming a classic bullish flag pattern on the 4H chart. This follows a strong impulse leg, suggesting a potential continuation to the upside. The consolidation is tight and healthy, showing market participants are preparing for a breakout. My upside target stands at 193.000, which aligns with the descending trendline resistance.
From a fundamental perspective, the British Pound remains supported by recent hawkish signals from the Bank of England, which is facing persistent inflation pressures. Meanwhile, the Japanese Yen continues to weaken across the board due to the Bank of Japan’s ultra-loose monetary stance and its defense of yield curve control, which makes it less attractive in a high-interest environment.
Technically, this setup aligns with key momentum indicators and market structure. If price breaks above the flag pattern with volume confirmation, we can expect buyers to take control, pushing price toward the 193.000 resistance zone. This level also coincides with a key liquidity area where prior sellers may be trapped.
Overall, GBPJPY continues to offer a solid bullish bias in the short term. The pair is fundamentally and technically aligned for a push higher. Breakout traders should monitor closely as the price approaches the upper trendline of the flag. This is one of the most watched JPY pairs right now—momentum is building.


btc . tue . recap plan to LONG came to fruition
LONG note:
as i found wOpen heavily BULLISH - i was eager to get in early and equaly positioned:
cw0.5 . 94.200
to
cw0 . 92781
entry: 93.975
this left me with not the nicest entry . not all orders were filled . should have favoured increasing order size . one never really knows until it happens . but happy
DAY TRADE note:
a day trade of nysOpen SFP . 95.400 (to ride down for our LONG IDEA)
LONG SUPPORT will show during the day . NICE! . but not taken . it supported our search for LONG though
recap
wOpen . ASIA . LONG
nysOpen . SFP to 5.30pm . LONG
tueOpen . ASIA take profit . rotation to cw0.5 . (LONG in favour)
nysOpen . idealy tp1 : SFP . possibly rotation . (look out for SHORT and LONG)
