$BTC cycle projection. Upside to $134k-$160k, then to sub $33kHere's a chart of my cycle projection of bitcoin. I think it's likely that we find support in the $62k region over the next couple of weeks and then continue the bull run up to $129k-$137k.
In terms of gains from here, I think BTC is only a ~2x, however, I think we're going to see our biggest altcoin run since bitcoin's inception.
After we hit the top $134k-160k, I think we'll make a very large correction back down to the $20-30k region (supports on the chart) before the next long term cycle begins.
This is the final wave of the first cycle of bitcoin.
Lots of money to be made.
Btc-bitcoin

BTC or Gold?Answer Gold!
The BTC/Gold ratio is on the verge of cracking here.
A crack here will trigger a sell-off in BTC relative to Gold.
This is a very simple, low risk, ratio trade.

BTC - Two Bullish Scenarios...Hello TradingView Family / Fellow Traders! This is Richard, also known as theSignalyst.
📉 BTC has been overall bearish, trading within the falling channel marked in red.
The $70,000 area is a key confluence zone — it aligns with the lower red trendline, horizontal support, a psychological round number, and a potential demand zone.
📚 According to my trading style:
As #BTC approaches the blue circle zone, I’ll be looking for bullish reversal setups — such as a double bottom pattern, trendline break, and more.
🏹In parallel, for the bulls to take over long-term, and shift the entire trend in their favor, a break above the last major high marked in red at $88,888 is needed!
📚 Reminder:
Always stick to your trading plan — entry, risk management, and trade management are key.
Good luck, and happy trading!
All Strategies Are Good, If Managed Properly!
~Rich

Do you think I'm joking ???Chart is speaking itself...
Give me some energy !!
✨We spend hours finding potential opportunities and writing useful ideas, we would be happy if you support us.
Best regards CobraVanguard.💚
_ _ _ _ __ _ _ _ _ _ _ _ _ _ _ _ _ _ _ _ _ _ _ _ _ _ _ _ _ _ _ _
✅Thank you, and for more ideas, hit ❤️Like❤️ and 🌟Follow🌟!
⚠️Things can change...
The markets are always changing and even with all these signals, the market changes tend to be strong and fast!!

BTC has just bounced, game a long entry from weekly support..110
“🔍 BTC has just bounced off our weekly support—here’s why I’m eyeing $110k next…”
Analysis bullets:
🛑 Risk: stop-loss around $78–80k (weekly close below red band)
▶️ Entry: current weekly close above the descending trendline
🎯 Target: $110k resistance (green zone)
Call to action:
“What do you think — will we break out or retest lows? Comment below! 👇”

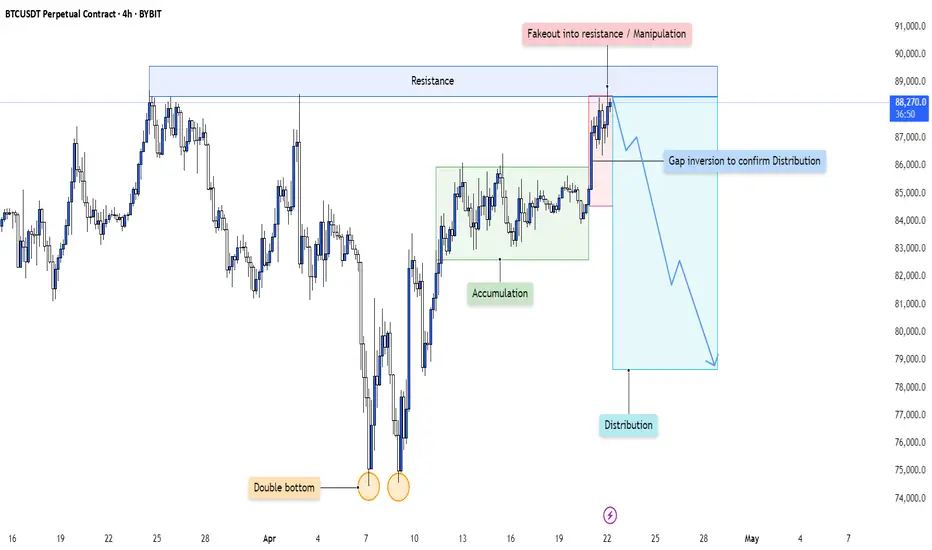
BTC - Distribution Confirmed After Accumulation Cycle CompletionThis 4H chart is a textbook illustration of how smart money cycles play out over time—starting with accumulation, leading into a sharp markup, and culminating in a deceptive distribution phase characterized by manipulation and false breakouts.
Let’s dissect each stage of this engineered move:
---
1. Accumulation Phase Following a Double Bottom
At the left of the chart, price forms a clear double bottom —a classic retail reversal signal.
- Smart money likely used this area to absorb sell-side liquidity, building long positions while retail traders expected further downside.
- This base formation set the foundation for the upcoming accumulation range , marked by sideways price action and multiple rejections from both highs and lows of the range.
The purpose of accumulation is simple: transfer supply from weak hands to strong hands. Every dip in this range allowed large players to fill bids without driving price too aggressively.
---
2. Sharp Markup and Resistance Interaction
Once positions were fully loaded, price launched into a strong impulsive move upward , confirming the transition from accumulation to markup.
- The move stalled at a clear horizontal resistance zone—marked as an area of prior supply and potential seller re-engagement.
- Price consolidated just below this resistance, building tension and liquidity in the form of breakout longs and stop orders from early shorts.
This led to the final stage of the cycle: distribution via manipulation.
---
3. Manipulation Above Resistance: The Fakeout
What followed was a classic fakeout above resistance .
- Price briefly broke above the key resistance area, attracting breakout buyers who assumed the trend would continue.
- In reality, this move served as a liquidity sweep and exit trap , allowing institutions to offload long positions accumulated earlier.
- The immediate rejection from this fakeout confirms a bull trap —a hallmark of distribution.
This is where smart money transitions from buyers to sellers while retail is left holding the bag.
---
4. Gap Inversion: Confirmation of Distribution
Post-fakeout, price creates a gap and immediately inverts back into the prior range , invalidating the breakout and forming a clear distribution schematic .
- The gap acts as a volume void or inefficiency , often revisited in reversal models.
- Once this area is rejected and price fails to reclaim the resistance zone, it becomes clear that distribution has been finalized.
- This breakdown marks the beginning of a markdown phase—typically faster and more violent than the markup.
The rejection confirms that price is now being delivered to the downside.
---
5. Narrative: From Accumulation to Redistribution and Collapse
This setup isn’t random—it’s narrative-driven:
- Double Bottom → Accumulation → Breakout → Manipulation → Distribution → Reversal
Each phase builds on the previous one, guided by smart money's intent to trap liquidity and maximize profit during transitions.
Now that distribution is confirmed, the expectation is continued downward delivery as price seeks out untapped liquidity and rebalances imbalances left behind during the markup.
---
Conclusion:
This 4H structure is a clear representation of the Wyckoff distribution model in action:
- Accumulation fuels markup.
- Breakout entices buyers.
- Manipulation traps them.
- Distribution unloads supply.
- Reversal completes the cycle.
The move down is not a random pullback—it is the deliberate continuation of a planned liquidity cycle . Expect further downside unless this structure is invalidated with a reclaim and break of the prior fakeout zone.
Will ETH do it again?Looks like we are in a decent spot to scale in for the next mark-up phase.
ETH has retraced a bit further/deeper than originally anticipated, however that just makes the entry all the better.

$BTC Closes Above the 200DMAPretty crazy how accurate ₿itcoin PA follows my squiggles, eh? 🤓
CRYPTOCAP:BTC has Closed above the 200DMA with a massive 25% rally over the past two weeks.
Next target $100k, but expect a retest of the 200DMA ~$88,5

#BTC Market Update – April 22, 2025Current Price: $90,700 (+4%)
📊 Technical Overview
• 200-Day MA: $88,356 – BTC is trading above it → Bullish sign
• RSI: 78 – Overbought zone → Possible pullback
• Resistance: $90,000 – Key psychological level
• Support: $85,000 – Watch this level on retracement
🔗 On-Chain Insight
• Long-Term Holders: Some distribution happening → Profit-taking
• Network Activity: Steady → Healthy usage
• Sentiment: Bullish → Weak USD + institutional inflows
🧭 Macro & Fundamentals
• U.S.–China tensions + Fed uncertainty → BTC seen as safe haven
• Institutions are increasing their exposure → Positive market signal
✅ Summary:
BTC shows strong bullish momentum, but RSI is overheated. Stay alert for potential short-term correction. Key levels: $85K support / $90K breakout.

Dominance the system core- for me it has always been very complicate to explain BTC.D to peoples, because it's complicate ! lol
- it's weird to understand the moves and many factors have to be compared together an alchemy have to happen to see something happening.
- So basically to explain it, i will tell you what "we want to see" or "what we don't want to see" in the future. if the story repeats again.
1/ BTC.D have to grow up, then Altcoins will struggle down trying to find a potential bottom.
- While BTC.D grow up, BTC price have to grow up also or at least stabilize ( this is a good sign )
2 / if BTC price down and BTC.D up, it's bad, it's just the normal way ( No Divergence )
- When BTC price + BTC.D both up together, it's a kind of " inversed divergence ", it means something good gonna happens. ( get it ?)
- Basically also if USDT/USDC Dom Grow and BTC price stabilize and not goes down anymore, it's a good sign.
- Normality the normal way is : BTC up / USDT/USDC.D Down OR BTC Down / USDT/USDC.D up.
- Before we had no reason to check those Stables coins because they had not much DOM in markets, but now have to count with them.
- So While BTC.D is growing, altcoins will just make some weak moves.
- When BTC will reach is next Dominance's ATH ( witch have to be lower than last years because more concurrence )
- BTC.D will crash and ALT SEASON will start.
- it took me many years to understand that, but it's pure logic ( Fibonacci is working perfectly on it )
- again it's not easy to get it.
- if you have any questions feel free to add a comment.
Happy Tr4Ding !

Just In: Bitcoin ($BTC) Reclaims $90,000 The world's renown digital asset Bitcoin ( CRYPTOCAP:BTC ) surged nearly 4% today to reclaim the $90k resistant zone, amidst breaking out of a bullish symmetrical triangle pattern enroute to $100k.
Bitcoin for almost 1 month now has been swinging within the $80k price range, since losing it's $100k resistant in the month of February, 2025 but with increasing momentum a move to the $100k resistant doesn't seem far fetch because CRYPTOCAP:BTC has already broken the ceiling of the symmetrical triangle.
With the 4-hours RSI at 79, we may experience a respite before the major leap to $100k price point. Notable firms like Micro strategy and Michael Saylor the CEO were integral in this price movement.
The company purchased 6,556 CRYPTOCAP:BTC for ~$555.8 million at ~$84,785 per bitcoin and has achieved CRYPTOCAP:BTC Yield of 12.1% YTD 2025. As of 4/20/2025, Micro strategy holds 538,200 CRYPTOCAP:BTC acquired for ~$36.47 billion at ~$67,766 per bitcoin.
Notably, financial bodies like Standard Chartered Bank says Bitcoin ( CRYPTOCAP:BTC ) could reach a new all-time high due to concerns over the Federal Reserve's independence.
As of the time of writing, CRYPTOCAP:BTC is up 3.70% currently trading at $90,715 per CRYPTOCAP:BTC setting the coast for $100k resistant.
However, on bearish tone, should CRYPTOCAP:BTC fail to pull up that stunt, a price correction might send CRYPTOCAP:BTC back to FWB:83K support.

Daily Price Action BITCOIN BTC Tuesday 4/22/2025In this video, we will be looking into the potential price action of BTCUSD.

BTCUSD Weekly Analysis Targeting; 94k - 96k, Followed By 109k
BTCUSD Weekly Analysis
Bitcoin is currently trading around $88,638, showing strong recovery momentum after bouncing off the key 61.8% Fibonacci retracement level at $74,412, often referred to as the “golden pocket.” This bounce suggests that buyers are stepping in aggressively at this support zone, which has historically acted as a major turning point in bullish market structures.
On the upside, BTC has now reclaimed the 38.2% retracement level at $87,375, turning it into a short-term support zone. Holding above this level gives Bitcoin a clear path toward the next key resistance at $94,430, followed by a stronger resistance cluster around $96,211, where both Fibonacci and historical horizontal resistance align.
Technically, the weekly chart also confirms a breakout above the descending trendline, adding confluence to the bullish reversal. This move aligns with the Inverse Head & Shoulders pattern seen on the daily chart — a classic bullish formation that typically leads to strong upward continuation.
If BTC continues to hold above $87,000, the next short-term target would be $94,000–$96,000, and if that level breaks with volume, Bitcoin could be gearing up for a retest of its previous highs around $109,000. On the downside, $81,145 (50% retracement) and $74,412 (61.8%) remain critical support levels, with any break below $74K shifting the outlook back to bearish.
The chart structure, key Fibonacci zones, and bullish reversal pattern all point toward continued upside, with BTC needing to maintain above GETTEX:87K to sustain the bullish trend.

BITCOIN - Bullish Double BottomHello Traders !
The BTC price formed a double bottom pattern.
Currently, The neckline is broken !
So, I expect a bullish move🚀
______________
TARGET: 88700🎯

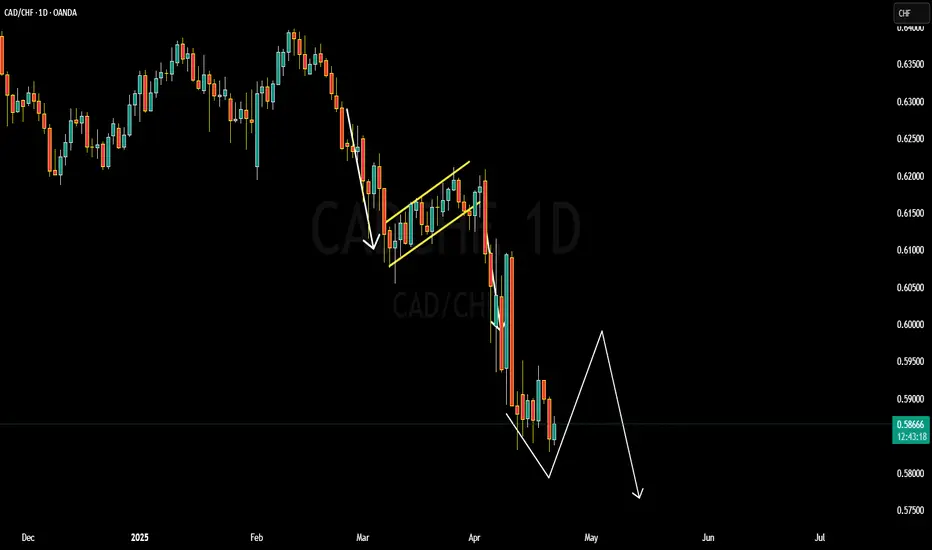
CADCHF BULLISH OR BEARISH DETAILED ANALYSIS We closely monitoring CADCHF, which is currently trading around 0.588. The pair has been in a strong downtrend, reflecting the broader weakness in the Canadian dollar against the Swiss franc. Technical indicators, including moving averages and momentum oscillators, suggest continued bearish momentum.
Fundamentally, the Canadian dollar is under pressure due to declining oil prices and a cautious stance from the Bank of Canada regarding interest rate hikes. In contrast, the Swiss franc benefits from its safe-haven status amid global economic uncertainties. The Swiss National Bank's relatively stable monetary policy further supports the franc's strength.
Key support levels to watch are at 0.57 and 0.58, while resistance levels are at 0.6050 and 0.6100. A break below the support could signal further downside potential, whereas a move above the resistance might indicate a reversal. Traders should remain cautious and consider macroeconomic developments when making trading decisions.
In conclusion, CAD/CHF presents a bearish outlook in the near term, influenced by both technical and fundamental factors. Monitoring economic indicators and central bank policies will be crucial for identifying potential trading opportunities in this pair.
WHY EURUSD IS STILL BULLISH DETAILED ANALYSIS We closely monitoring EUR/USD, which is currently trading around 1.0430. The pair has shown resilience after rebounding from the 1.0220 support level, forming a bullish engulfing pattern on the 3-day chart. This pattern suggests potential for a bullish reversal, especially as the Relative Strength Index (RSI) recovers from oversold conditions. The price action aligns with the lower boundary of a long-term descending channel, indicating a possible shift in trend.
Fundamentally, the euro is under pressure due to the European Central Bank's (ECB) recent rate cut to 2.25%, marking the seventh reduction since mid-2024. This move aims to counteract the economic slowdown exacerbated by U.S. tariffs on EU imports. In contrast, the U.S. dollar faces its challenges, with political tensions arising from President Trump's criticism of Federal Reserve Chair Jerome Powell for not cutting rates swiftly. These dynamics have led to increased volatility and a weakened dollar, influencing EUR/USD movements.
Technically, the ascending triangle pattern observed on the 4-hour chart supports a bullish outlook. A decisive break above the 1.0625 resistance could pave the way for targets at 1.0760 and subsequently 1.0850. However, traders should remain cautious, as a drop below the 1.0220 support might signal a continuation of the bearish trend, potentially testing parity levels.
In the current market environment, it's crucial to stay updated with economic indicators and geopolitical developments. Key events, such as U.S. Non-Farm Payrolls and Eurozone inflation data, will provide further insights into the pair's direction. Employing sound risk management strategies and staying informed will be essential for navigating the EUR/USD landscape effectively.

(BTC) bitcoin "signs"the blue/green line is crossing the purple dotted line. This is a sign representing a transitional phase between moving averages where the short line begins to cross over the patterns of longer time frames. I was looking at this today and though any indicator is never 100% accurate it is always better to see positive signs rather than no signs at all. Could this be the summer of crypto? A positive crypto summer unlike so many previous years? I'm well aware the second quarter just started and summer is not close by 3 months time.

BTC Breaks Key Resistance –Pullback Your Last Chance to Enter!?To start today's analysis, it's best to look at the Bitcoin ( BINANCE:BTCUSDT ) analysis I shared with you on April 10 , which can give us good insight and has performed well so far .👇
Bitcoin seems to have finally managed to break through Important Resistance lines as well as the Resistance zone ($86,500-$85,150) . The break volume is also high and could be a good sign for the continuation of the upward trend .
According to Elliott Wave theory , with the breaking of important resistance lines , we should wait for the next 5 impulsive waves , which I will try to analyze step by step in this idea and future ideas.
I expect Bitcoin to attack the Heavy Resistance zone ($95,000-$88,500) for the first time after the pullback to the broken Resistance zone ($86,500-$85,150) (it is better to enter a long position on the pullback ). Basically, assets can NOT break such heavy zones for the first time . ( With very good news, it may break for the first time ).
Cumulative Long Liquidation Leverage: $86,022-$85,539
Cumulative Short Liquidation Leverage: $89,340-$88,000 = Important
Do you think the main uptrend has resumed or will Bitcoin correct again?
Note: The pullback is likely to start from the third point of contact with the Resistance lines.
Note: If Bitcoin falls below $85,100, it seems we should expect further declines.
Please respect each other's ideas and express them politely if you agree or disagree.
Bitcoin Analyze (BTCUSDT), 1-hour time frame.
Be sure to follow the updated ideas.
Do not forget to put a Stop loss for your positions (For every position you want to open).
Please follow your strategy and updates; this is just my Idea, and I will gladly see your ideas in this post.
Please do not forget the ✅' like '✅ button 🙏😊 & Share it with your friends; thanks, and Trade safe.

Failed Breakout + Rising Wedge = Bearish Signal for Bitcoin!?Bitcoin ( BINANCE:BTCUSDT ) attacked the Resistance zone ($87,520-$85,840) and the important Resistance line as I expected in yesterday's idea , but it seems that it failed to break .
Bitcoin is moving between two Support and Resistance zones .
From a Classic Technical Analysis , Bitcoin appears to have formed a Rising Wedge Pattern .
From an Elliott Wave theory , Bitcoin appears to have completed a main wave 5 on the 1-hour time frame .
Also, we can see the Regular Divergence(RD-) between Consecutive Peaks .
If we look at the Bitcoin chart in the 4-hour timeframe , a Shooting Star Candlestick Pattern with high volume is clearly visible near the Resistance zone ($87,520-$85,840 ), which could signal a reversal and decline in Bitcoin .
I expect Bitcoin to start declining again after an upward correction and break the lower line of the rising wedge pattern , and reach the targets I have indicated on the chart.
Cumulative Short Liquidation Leverage: $87,708-$86,487
Cumulative Long Liquidation Leverage: $84,520-$83,687
Do you think Bitcoin can finally break the important resistance line? I would like to hear your thoughts.
Note: If Bitcoin breaks above the Resistance zone ($87,520-$85,840), we can expect a pump.
Note: If Bitcoin falls below $81,000, we can expect further declines.
Please respect each other's ideas and express them politely if you agree or disagree.
Bitcoin Analyze (BTCUSDT), 1-hour time frame.
Be sure to follow the updated ideas.
Do not forget to put a Stop loss for your positions (For every position you want to open).
Please follow your strategy and updates; this is just my Idea, and I will gladly see your ideas in this post.
Please do not forget the ✅' like '✅ button 🙏😊 & Share it with your friends; thanks, and Trade safe.

BTCUSD: Heavily supported, targeting $160k.Bitcoin is neutral on its 1W technical outlook (RSI = 51.863, MACD = 1668.900, ADX = 41.878), running a bullish steak of 3 green 1W candles in a row. Supported heavily by the 1W MA50, this looks like all previous HL bottoms since late 2022. Those kickstated bullish waves that have reached at least the 2.0 Fibonacci extension. The medium term trade here is long, TP = 160,000.
## If you like our free content follow our profile to get more daily ideas. ##
## Comments and likes are greatly appreciated. ##

Bitcoin Laguerre Weekly Setup – Road to $110K or Breakdown Risk?📈 Idea:
Bitcoin continues to hold above key weekly support, consolidating after its recent move up. Using the Laguerre system as confirmation, we’re now watching a high-stakes setup with two clear paths:
🔸 Bullish Scenario:
A breakout from the current wedge structure could ignite momentum toward the $110,000 target zone, aligning with Laguerre mid-band strength and upper Bollinger expansion. That orange line is the roadmap — breakout, retest, push.
🔻 Bearish Risk:
If price fails to hold the ~$80K region, the structure breaks down — risk increases sharply. The 50-week EMA and Laguerre zone below offer possible support, but the setup weakens significantly.
🧠 Why It Matters:
Laguerre momentum curling up from key zones
Clean trend structure with well-defined risk
Weekly compression often leads to expansion
🎯 Target: $110,000
🛑 Risk Line: $80,000
📅 Timeframe: Weekly
🔍 System: Laguerre + Trend Structure
Drop your thoughts 👇
Are we gearing up for the next leg or prepping for a flush?
#Bitcoin #BTC #Crypto #Laguerre #TradingView #WeeklySetup #JTraderEdge

Bitcoin Bearish Dead Cat BounceI am not a financial advisor. This is not meant to be and does not constitute financial, investment, trading, or any other types of advice or recommendation.

Bitcoin 240k next 10k on bear marketOn chart I see good support level created on Covid times and good liquidity compression which must be grabed well. Alternative scenario we must see very good move upside to 500k+ but I don't believe in it.
