Bitcoin, Trump Crypto conference today what to expect?Bitcoin, Trump Crypto conference today what to expect?
i think with bigger chance trap will happens
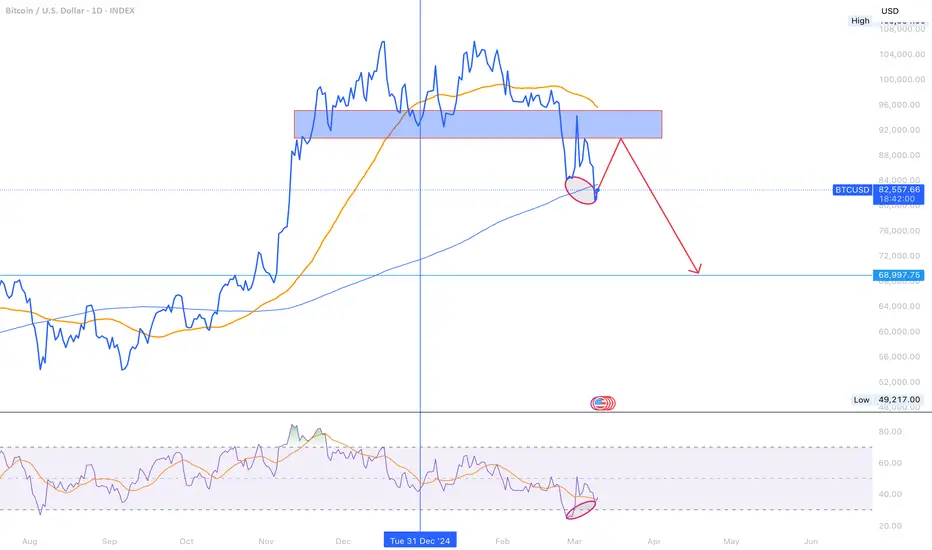
trend is down
better to follow it until it breaks
Btc-bitcoin

Bitcoin - Short after pullbackBitcoin - Short after pullback
price took swing low
at this moment better to creat a pullback and after look for a new short

Bitcoin Forecast by NEoWaveIn the previous analysis, I said that we seem to be in wave-(e) of D. We considered wave-D as a diametric, which seems to have ended with the drop in Bitcoin price and we should consider the diametric to be over and change the labeling a little. Currently, considering what happened, we have two scenarios:
Scenario 1
In this scenario, if the Bitcoin price is maintained above $70,000, there is a possibility of a double combination pattern, the second pattern will probably be a Diametric or Neutral Triangle or a Reverse Contracting Triangle, and wave-D (higher degree wave) will continue. In this case, the price could touch $150,000.
Scenario 2
In this scenario, if the price goes below the key level of $70,000, we should consider wave-D to be over and the price could decline to the range of $49,000-43.00 and wave-E will be completed.

BTC - the path to $72k This trade continues. And started months ago.
BTC is in a deep bear market.
And has more room to run.
$68,600 is now really looking like the 1st stabilization point. There will be rallies in between, but there is a lot of slow grinding pain ahead. Elliot Wave, Murrey Math and Kumar wave being used for the forecasts. Comments always welcomed. Happy Trading.

Best time to Buy BitcoinBitcoin is forming a correction and has scared retailers out of the market, so this could be the perfect momentum to catch before it makes a bigger movement to the upside.

Bitcoin falls amid disappointment with Trump’s crypto policy
Bitcoin fell as investor hopes for a US strategic reserve plan were let down. Rather than accumulating cryptocurrencies, the US government held only its previously seized assets, triggering a price decline. However, large investors viewed the dip as a buying opportunity. Data reveals that whale and shark wallets acquired 5,000 Bitcoin during the downturn, reflecting confidence in the market despite the drop.
BTCUSD tested the 77,500 support level after failing to reclaim the EMA21. The widening bearish EMAs suggest a potential continuation of the downtrend. A sustained recovery and a close above 80,000 could lead to a retest of the next resistance at 82,500. On the other hand, if BTCUSD fails to hold above 77,500, a further drop toward 75,000 may follow.

Bottom Still Not in, Drop could hit low 70kBTC is falling due to markets and investor fear. The Bottom still hasn't travelled the length of the the FVG on the Weekly Chart that will be attractive to smart money and institutional investors
When looking at the Historical Data it shows that the price had a pullback and found resistance at the Weekly 21 day RMA .
Currently that looks like a point where Resistance once again will be established when combined with the FVG on the Weekly, Price will likely fall below and recover to hold the 21d RMA

btc 2017-2025Ignore the noise and donte be shaken, the CRYPTOCAP:BTC run will continue to be as epic and violent as the 2017 run!

Double Top Breakdown & Key Support Level📊 $BTC/USDT Market Update – Double Top Breakdown & Key Support Level
Welcome to today’s analysis! Let’s break down the Bitcoin ( CRYPTOCAP:BTC ) chart, focusing on the double top pattern and key levels.
⸻
🌐 Overview: Double Top Formation & Breakdown
📉 CRYPTOCAP:BTC has formed a double top pattern and has broken the neckline (yellow level).
🔄 Current Scenario:
• The double top pattern suggests a bearish move, with a projected target at the green support level.
• The green support zone aligns with the previous ATH from the last bull run, making it a key area for potential price stabilization.
• If buyers step in at this support, we could see a bounce and possible bullish reversal.
⸻
🔑 Key Levels to Watch
🟡 Neckline (Broken Support): Confirmed breakdown, acting as new resistance.
🟢 Support Zone: Green Level (Previous ATH, potential stabilization area).
⸻
🛠️ Trade Scenarios
📌 Bullish Scenario (Support Holds & Price Bounces Up)
• If CRYPTOCAP:BTC stabilizes at the green support, buyers may step in, leading to a potential recovery move.
• Confirmation of bullish strength could come from a higher low formation at this level.
📌 Bearish Scenario (Break Below Green Support)
• If CRYPTOCAP:BTC fails to hold the green support zone, further downside could occur, potentially testing lower support areas.
• A confirmed breakdown below this level would signal continued bearish momentum.
⸻
📌 Conclusion
CRYPTOCAP:BTC has broken the neckline of a double top pattern, and its projected target aligns with the green support zone (previous ATH level). This area is critical for potential price stabilization—if buyers defend it, we could see a rebound and bullish continuation. However, if it breaks down, further losses may follow.

BTC Time to FLY.As of now according to weekly chart i can see that the Market is on that resistance level of its channel, so what i think here is that the Market will goes according to its history, probability is market will retest 50 MA and will show the new high, after that it will move towards channel's support level.
So According to me, its the best time to be Bullish, or have some spot in portfolio.

BTC Warning Time .As of now according to weekly chart i can see that the Market is on that resistance level of its channel, so what i think here is that the Market will goes according to its history, probability is market will retest 50 MA and will show the new high, after that it will move towards channel's support level.
So According to me, its the best time to be Bullish, or have some spot in portfolio.

BTC HALVING APRIL 2024! 479497$As we approach the impending halving event in 2024, slated to commence in a month, speculation arises regarding its potential outcomes. Historical data provides insights into recurring patterns, yet uncertainty looms regarding whether past scenarios will manifest once again.
We invite your insights:
Do you foresee growth or a departure from traditional trends towards decline?
Your perspectives are welcomed and valued.

Powell’s Speech & Bitcoin’s Decline: Is More Downside Ahead? Today, Fed Chair Jerome Powell is set to speak, and traders should brace for potential market volatility! Given the recent economic data , his tone is likely to be balanced but leaning hawkish .
Why a More Hawkish Powell?
1- Strong Job Market :
Unemployment Rate : 4.1% (Still low)
Non-Farm Payrolls (NFP) : 151K (Decent, but lower than before)
Average Hourly Earnings : 0.3% (Steady wage growth)
This suggests that the labor market remains resilient, which might discourage the Fed from cutting rates too soon.
2- Inflation Still a Concern :
Wage growth and inflationary pressures persist, which means Powell may emphasize keeping rates steady longer to combat inflation.
3- Markets Are Too Optimistic on Rate Cuts :
Investors are heavily betting on rate cuts in 2024, but Powell may push back against these expectations to prevent excessive risk-taking.
Powell will likely maintain a cautious yet hawkish stance to manage expectations. Big price swings are expected across forex, crypto, and commodities—so stay alert! (Of course, this is just a personal analysis).
In addition to Donald Trump , Signs Executive Order to Create Bitcoin Strategic Reserve
Of course, today, we didn't see any strange movement in Bitcoin, and probably, the proverb " buy the rumor, sell the news " was fulfilled.
----------------------------------------------------------
Now let's take a look at the Bitcoin chart on the 1-hour time frame and also take help from technical analysis tools .
Bitcoin ( BINANCE:BTCUSDT ) is in a Heavy Resistance zone($93,300_$89,250) and has started to decline from Potential Reversal Zone(PRZ) .
From a Classic Technical Analysis , Bitcoin appears to move in a Symmetrical Triangle .
According to Elliott Wave theory , Bitcoin has completed the Double Three Correction(WXY) , and we should wait for the next bearish wave .
I expect Bitcoin to attack 200_SMA(Daily) again after breaking the lower line of the Symmetrical Triangle .
Note: Bitcoin is likely to pump more if the symmetrical triangle's upper line breaks.
Please respect each other's ideas and express them politely if you agree or disagree.
Bitcoin Analyze (BTCUSDT), 1-hour time frame.
Be sure to follow the updated ideas.
Do not forget to put a Stop loss for your positions (For every position you want to open).
Please follow your strategy and updates; this is just my Idea, and I will gladly see your ideas in this post.
Please do not forget the ✅' like '✅ button 🙏😊 & Share it with your friends; thanks, and Trade safe.

BTC - Get Ready!🚨 CRYPTOCAP:BTC is dipping hard! 🚨
📉 Get ready for a massive entry at $72,000—here’s why:
It aligns with:
1️⃣ Lower bound of the blue wedge pattern
2️⃣ Previous resistance turned support
3️⃣ Key demand zone
4️⃣ -34% correction phase
📊 This level could be a game-changer! Are you buying?

BTC Bull Div then entering the bear market I think it's not just me but BTC has a obvious bull divergence on the daily time frame, so i think it should go up to the previous resistance level and then continuing the downward movement.
No Mans Land for ETHWe are in the middle of the ranger here.
A weekly close above $2,150 and I will be optimistic for Bulls.
However, a weekly close below $1,950 and I think the Bears will be dining some beef.

#Bitcoin $BTC OutlookCRYPTO:BTCUSD is testing a 2 years old uptrend channel lower wedge extending since 2023 where #BTC price was ~$25k. The wedge is ranging between ~$80k : ~$70k.
Key levels:
~$79k: kind of imminent today.
~$73.5k: The first and the nearest core demand, smart money is concentrated at this level "A bounce is anticipated from here"
~$70k: Is the last bulls haven, breakingdown will unlock the ~$60k mark.
Check my previous BTC analysis, I've been calling for the ~$80k : ~$70k since ATHs.
#AhmedMesbah

Two key scenarios for BTC - Q2 mostly sideays/down!Two scenarios at this point:
We have a new range, but it could break quickly since there’s an active downtrend expiring on the 20th.
That means I can’t blindly bid into the low $80Ks like before—it’s getting trickier, and we’ll need to rely on proper triggers.
If it breaks down and continues lower, I’d like to see the GETTEX:59K -$62K zone get tested.
The **uptrend remains intact**, and I think we can all agree that **Bitcoin could be higher later this year**. I don’t see it going above **$200K**, but at the very least, I expect it to challenge its current **ATHs**.
For now, I’m just focusing on **key levels** and patiently waiting for **triggers—if any**.
There are plenty of ways to play this:
- Another **mid-level retest** and **reclaim** → I'll go **long**.
- If it **bounces**, I’ll look to **short** into the **low $90Ks**.
- If **nothing happens** and it starts **breaking down**, then **$75K** is a key zone, and **$71K** becomes pivotal for both **longs and shorts**.
Just **keep your levels clear** and **wait** until they are breached.


Will $78.5K hold or spark a liquidation storm?Bitcoin is facing intense selling pressure within the critical $78,500 – $82,000 zone on the 4-hour timeframe. A large liquidation cluster in this range (over $800 million in leveraged longs) raises the risk of a sharp drop toward $77,800, a key institutional support level. However, oversold RSI (32) and slowing bearish momentum on the MACD suggest potential exhaustion in sellers, increasing the likelihood of a rebound if the zone holds. A decisive breakdown below $78,500 could accelerate corrective moves toward short-term lows.
A sustained hold above $78,500 followed by a breakout above $82,000 would open a bullish reversal scenario, targeting $86,000 (Fibonacci extension level) and $89,000. Such a move would likely trigger a short squeeze, fueled by liquidations of leveraged shorts and rising buy-side volume.

BTC ANALYSIS🔮 #BTC Analysis
💲💲 #BTC is trading in a Symmetrical Triangle Pattern. If the price of #BTC breaks and sustain the higher price then will see a pump. Also there is an instant strong support zone. We may see a retest towards the support zone first and then a reversal📈
⁉️ What to do?
- We have marked crucial levels in the chart . We can trade according to the chart and make some profits. 🚀
#BTC #Cryptocurrency #Support #Resistance #DYOR

$BTC Bearish Divergence on the Weekly !? NO!!!Someone on Twitter sent me a chart showing Bearish Divergence on the Weekly for BTC and asked me to analyze it.
(hopefully this link shows the chart)
pbs.twimg.com
My response is below.
---
This is a really good question!
Caught me off guard for a second and I had to really analyze it.
That chart assumes we’re at the end of the cycle, so its showing bearish divergence prematurely in Mar ’25.
But the fractal it’s being compared to shows divergence with the peak in Nov ’21.
Here’s the correct way to draw the trends.
If you draw from the bear market low to current date, you see we are just getting warmed up.
This cycle is mimicking 2017 as I’ve mentioned a lot over the past year.
I marked where we are so you can see the Feb - Mar ’21 dip in RSI.
Imagine tapping out right before the moonshot!
It’s easy to get caught off guard with that chart, as the fractals from ’21 and ’25 on the RSI do look strikingly familiar, but notice how the right shoulder on the RSI falls in Nov 21’ , but the right shoulder on the RSI in Dec ’24 is going higher, pointing to the RSI following the ’17 uptrend.
I wonder if the person who made that chart actually thought that was the correct way to analyze the chart, or if that’s just a troll bear-posting.
I could see someone like CredibleCrypto or an XRP-maxi posting that.

$BTC - Lower Timeframe OutlookCRYPTOCAP:BTC | m30
We failed to reclaim 90k-92k key level
Lose 86k, there’s a higher chance that 84k will act as an inducement, leading to a retest of 82k-80k
