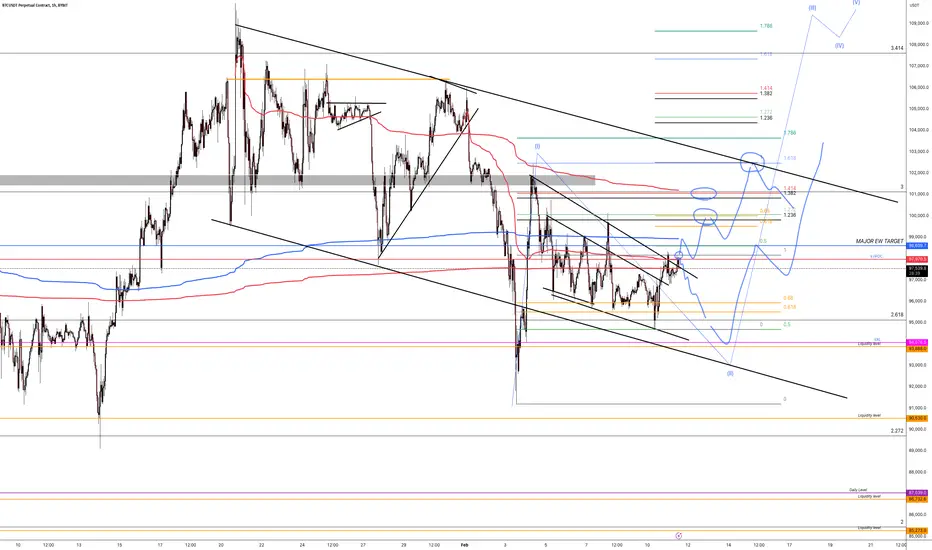
short 107900 with tp at 100500 sound legit target it will go here easily and i think much more or bit more
but for no risk i take this legit target after the rally he just done its amazing
i not make stop loss in this scenario coz if he go to 110 000 i will had 1 lot and keep my target
if he go 115 000 same...no leverage if u have small balance then apply your RR
Btc-bitcoin

ETH COOKING ATMLet him cook.
Can't help but notice the similarities in previous mark-up cycles.
Everything looks primed for major expansion to the upside.

BTC (Y25.P1.E1).A few setupsHi Traders,
Returned from a 6 week break and now my thoughts on BTC.
Some time back I stated I would not be surprised if BTC ranges for some time before making new highs.
I still feel that we are in this channel with a corrective pattern of some sort.
The vwap and some levels of significance with fibs tends to make me believe we will sill hit the lows with a potential rejection here (no trade entry). But the wedge structure could make it hit its target at teh 618 fib for a short entry (like a fake out) and then drop.
The blue and red a vwaps from different pivot points.
We look for the response with our 2 methods. SFP or FA.
We go into detail at the time, for a trade entry. At times we miss out because we are not online.
All the best,
S.SAri
.
Bitcoin is mimicking gold: Fractals are bullish!Bitcoin is following gold in its pattern formation. Fractal analysis of gold and Bitcoin reveals similarities in both charts. While gold is slightly ahead of Bitcoin, the same pattern is emerging on Bitcoin’s chart. If Bitcoin follows gold’s performance, it is likely to break out of this widening wedge pattern and reach new all-time highs, aligning with my previous analysis.

Bitcoin is hunting for liquidity, What's next?📊 After attempting to break $100K, Bitcoin faced another rejection.
What’s happening now?
The SMA shows that Bitcoin is still in a short-term downtrend, struggling to gain momentum.
Right now, it’s hovering around $96,400 – $96,500, trying to stabilize.
The key support to watch is $94,400 – $94,600—if it holds, we could see a bounce. If not, things might get shaky.
On the upside, Bitcoin needs to break $100K first before making a real move toward $103K and beyond.
For now, all eyes are on the $94K support.
Will BINANCE:BTCUSDT hold or dip lower? What do you think?


Bitcoin Macro Update: Echoes of 2015-2017 | Gold, M2, and CPI
In this macro update, I dive into Bitcoin’s price action and how it mirrors the 2015-2017 cycle. We analyze key macroeconomic indicators, including Gold, Global M2 money supply, and FRED data, to understand Bitcoin’s positioning in the broader financial landscape. With inflationary pressures and CPI trends shaping liquidity flows, is Bitcoin primed for another parabolic run? lets let the market decide.

bitcoin dreamsDon't stay in Bitcoin's short dream world, being exposed to long and massive dreams is reasonable to deal with throughout 2025!

Bitcoin’s Fake Breakouts—Bears Taking Control!?Bitcoin ( BINANCE:BTCUSDT ) failed to defeat Resistance zone($100,520-$97,200) , the 50_SMA(Daily) , and the Monthly Pivot Point for the umpteenth time and even created a Fake Break .
It also seems that Bitcoin has been unable to break the Resistance lines .
According to the theory of Elliott waves , it seems that Bitcoin has succeeded in completing the corrective wave so that the structure of the main wave C is the Expanding Ending Diagonal .
I expect Bitcoin to break the Support zone($96,520-$95,720) and touch $95,500 this time, I told you about the importance of this price in the previous post .
Note: If Bitcoin can break the Resistance zone($100,520-$97,200) , the 50_SMA(Daily) , and the Monthly Pivot Point , we should expect an increase to Cumulative Short Liquidation Leverage($103,210-$102,454) .
It doesn't seem reasonable for Bitcoin these days to provide a long-term or even mid-term analysis, and we need to stick to a series of resistance and support levels in order to determine the next targets. Do you agree with me?
Please respect each other's ideas and express them politely if you agree or disagree.
Bitcoin Analyze (BTCUSDT), 1-hour time frame.
Be sure to follow the updated ideas.
Do not forget to put Stop loss for your positions (For every position you want to open).
Please follow your strategy and updates; this is just my Idea, and I will gladly see your ideas in this post.
Please do not forget the ✅' like '✅ button 🙏😊 & Share it with your friends; thanks, and Trade safe.

Bitcoin Short - Let's ManiuplateI'm overall bullish, however kinda betting on some f*ckery before we potentially move further up.

Alt season could already be here, only is winter seasonThe Crypto Market at a Crossroads: What’s Could Next for Bitcoin and Altcoins?
The cryptocurrency market is at a critical juncture, and the narratives being pushed by crypto influencers might not be telling the full story. Over the next weeks and months, the altcoin landscape could undergo significant changes, and there are signals emerging that few are discussing. In this post, I’ll analyze Bitcoin, altcoins, and Bitcoin dominance and what I expect in the coming months.
Bitcoin’s Current Position: Are We Near the Top?
When analyzing Bitcoin, it’s crucial to zoom out and assess the bigger picture. On a weekly chart, Bitcoin’s price action suggests that we might be nearing a top. While some argue that the peak has already occurred, the current structure indicates that Bitcoin could enter a sideways/ downward movement like we saw last year.
If Bitcoin continues to move sideways, altcoins are likely to follow suit. However, during these phases, some altcoins may experience brief runs, especially if Bitcoin dominance starts to decline.
But here’s the catch: Bitcoin dominance has been steadily rising since Bitcoin’s bottom, which is unusual. Typically, during the late stages of a cycle, Bitcoin dominance drops as altcoins surge. This time, however, the landscape seems different.
Altcoin Season: A Muted Rally?
The idea of a massive altcoin season, where all altcoins surge simultaneously, might be a thing of the past. While some coins like BINANCE:SOLUSDT have already seen significant runs (from nearly $80 to $300 top in one year), the broader altcoin market has not experienced the same explosive growth. Instead, only a select few altcoins made significant moves.
This doesn’t mean that altcoins are dead. There will still be opportunities, but they will likely be more selective. Coins that have already made substantial gains, like Solana, may have already topped out.
Going forward the key should be to focus on coins that show strong volume breakouts and price action, rather than holding onto underperforming assets.
Bitcoin Dominance and the Changing Landscape
Bitcoin dominance has been on an upward trajectory, which is unusual for this stage of the cycle. Historically, Bitcoin dominance falls as altcoins begin to rally.
However, this time, the dominance chart suggests that the market dynamics are shifting. While a drop in Bitcoin dominance is still possible, it may not be as pronounced as in previous cycles.
This changing landscape could be due to the sheer number of altcoins in the market. With thousands of coins vying for attention, there simply isn’t enough liquidity to pump all of them. This dilution effect means that only a handful of coins will likely see significant gains, while the majority will continue to underperform.
The Role of Meme Coins and Newer Projects
One of the standout trends in this cycle has been the rise of meme coins and newer projects. Coins like BINANCE:SUIUSDT , which launched during this cycle, have already broken their all-time highs. However, even these newer coins may be entering a bear market phase.
The market is saturated, and without a significant influx of liquidity, it’s unlikely that we’ll see another massive altcoin season.
Meme coins, in particular, have been a double-edged sword. While they’ve provided some of the most explosive gains, they’ve also drained liquidity from the broader market.
This extraction of value has made it harder for other altcoins to gain traction, further complicating the market dynamics.
The Bigger Picture: A Potential Bear Market
Looking at the broader market, there’s a growing possibility that we could be entering a bear market.
The sheer number of coins in the market, combined with the lack of liquidity, suggests that the crypto space is due for a significant shakeout.
Coins like BINANCE:DOTUSD , CAPITALCOM:FILUSD and even BINANCE:ADAUSDT , which have been in a bear market since 2021, are a prime example of this trend.
Many altcoins are already down 80-90% from their all-time highs, and the chances of them recovering are slim.
This is why it’s crucial to focus on coins that have already established a bull trend and are hovering around their support zones, as they have a higher probability of breaking out and continuing their upward trajectory.
Key Takeaways and What to Watch For
1. Bitcoin’s Sideways Movement: Bitcoin is likely to move sideways or slightly downward in the coming weeks, which could create opportunities for select altcoins.
2. Selective Altcoin Runs: Not all altcoins will rally. Focus on coins with strong volume breakouts and price action.
3. Bitcoin Dominance: Keep an eye on Bitcoin dominance. A drop could signal a brief altcoin rally, but it may not be as significant as in previous cycles.
4. Meme Coins and Newer Projects: While meme coins and newer projects have seen gains, they may be entering a bear market phase. Be cautious with these assets.
5. Long-Term Bear Market : The crypto market could be entering a bear market. Focus on preserving capital and avoid holding onto underperforming assets.
Final Thoughts:
The crypto market is at a crossroads, and the next few months could be pivotal. While there will still be opportunities, they will likely be more selective and harder to come by.
By focusing on strong projects with solid fundamentals and avoiding the hype, you can navigate this changing landscape more effectively.
Remember, the key to success in crypto is not just about making money—it’s also about avoiding losses.
Best of Luck!
Mihai Iacob

$BTC x $GOLDCRYPTOCAP:BTC , the largest store of value after TVC:GOLD and NASDAQ:XAG , historically follows TVC:GOLD movements!
2025 looks set to be epic for #Bitcoin

Bitcoin Short - Increased Spot Outflows And Slow ETF InflowsAs the title states I'm short term bearish on BTC since I'm seeing lots of spot outflows while ETF inflows stay relatively low. Actually I'm even aiming for 86k area.

Trading opportunity for BTCUSDTBased on technical factors there is a Buy position in :
📊 BTCUSDT
🔵 Buy Now
🪫Stop loss 95300.00
🔋Target 105000.00
📏 R/R 2
💸RISK : 1%
We hope it is profitable for you ❤️
Please support our activity with your likes👍 and comments📝

BTC: This May Be Your Last Chance Before Exploding to Upside !!As you can see, the price is forming two bullish patterns on the daily timeframe, If my view is correct, btc will rise to 120k .
And if this pattern is correct and breaks, higher targets are possible.
Give me some energy !!
✨We spend hours finding potential opportunities and writing useful ideas, we would be happy if you support us.
Best regards CobraVanguard.💚
_ _ _ _ __ _ _ _ _ _ _ _ _ _ _ _ _ _ _ _ _ _ _ _ _ _ _ _ _ _ _ _
✅Thank you, and for more ideas, hit ❤️Like❤️ and 🌟Follow🌟!
⚠️Things can change...
The markets are always changing and even with all these signals, the market changes tend to be strong and fast!!

BITCOIN - Price can little correct and then bounce up to $102600Hi guys, this is my overview for BTCUSDT, feel free to check it and write your feedback in comments👊
A few moments ago price reached resistance area and then started to decline inside wedge, breaking $107000 level.
Price fell to support line of wedge and then traded near $94000 level until it bounced up from support line again.
BTC rose to resistance line of wedge and then dropped back to support line, after which started to grow.
After this, price rose to resistance area, breaking $94000 level and exiting from wedge, and starting to fall in reverse wedge.
In this pattern, BTC fell to support area, where it reached support line and then made an upward impulse.
Now price declining, so, I think Bitcoin can fall a little and start to grow to $102600 resistance line of reverse wedge.
If this post is useful to you, you can support me with like/boost and advice in comments❤️

Bitcoin (BTC) – Technical Analysis & Key LevelsCurrent Market Status:
Price: Trading near $97,000, below the $98,000–$100,000 resistance zone.
Weekend Movement: Recovered 10% of losses, but some gains have been retraced.
Directional Bias: Neutral, as BTC consolidates under key resistance.
Key Levels to Watch
Upside Targets (If BTC Reclaims $100K as Support)
$103,000–$108,000 → Next resistance zone, a breakout above this could trigger further upside.
$115,000+ → Potential medium-term target if bullish momentum strengthens.
Downside Support Levels (If BTC Fails to Hold 97K–$100K Zone)
$91,000–$95,000 → Immediate support range, likely to attract buyers.
$85,000–$87,500 → Stronger support in case of deeper correction.
Market Outlook & Trading Strategy
Bullish Scenario:
A confirmed breakout above $100,000 would shift momentum toward $103,000–$108,000.
Sustained price action above $100K would indicate strength, supporting further rally potential.
Bearish Scenario:
If BTC fails to hold current levels, expect a pullback to $91,000–$95,000.
A break below $91K could expose BTC to $85,000–$87,500 support levels.
Final Thoughts
BTC remains at a critical juncture, with $100K acting as a key decision point. Traders should monitor price action closely for confirmation of either a breakout (bullish) or a rejection leading to further downside (bearish) before positioning for the next major move.

Bitcoin Pullback or Trend Reversal? Key Levels to Watch!Bitcoin failed to Break the $107,000 Resistance as in the Previous post (the 7th attack failed ).
Bitcoin ( BINANCE:BTCUSDT )is moving in the Resistance zone($100,520-$97,200) , near the Support lines , the 50_SMA(Daily) , and Monthly Pivot Point .
This upward movement these few hours can be in the form of a pullback to 50_SMA(Daily) and Support lines (broken) . Of course, the worrisome point is the momentum of this upward movement .
According to the theory of Elliott waves , this increase of these few hours can be in the form of the main wave 4 . The main wave 4 structure so far is a Zigzag correction(ABC/5-3-5) .
I expect Bitcoin to once again attack the 100_SMA(Daily) and the Heavy Support zone($93,300-$90,500) .
Cumulative Short Liquidation Leverage: $102,926-$100,450
Cumulative Long Liquidation Leverage: $92,570-$91,249
Note: If Bitcoin goes below $97,000, we should have more confidence that this analysis is correct.
Note: If the CME Gap($102,580-$100,320) fills in this uptrend, we should expect another attack on the $107,000 resistance.
Do you think the correction of Bitcoin continues, or should we wait for Bitcoin re-pumps in the coming hours? Please share your ideas in the comments.
Please respect each other's ideas and express them politely if you agree or disagree.
Bitcoin Analyze (BTCUSDT), 1-hour time frame.
Be sure to follow the updated ideas.
Do not forget to put Stop loss for your positions (For every position you want to open).
Please follow your strategy and updates; this is just my Idea, and I will gladly see your ideas in this post.
Please do not forget the ✅' like '✅ button 🙏😊 & Share it with your friends; thanks, and Trade safe.

Gold XAUUSD Possible Move 06.02.2025Market Analysis: Incomplete Head and Shoulders Pattern with Breakout & Retest Strategy
Pattern Identified:
The chart presents an incomplete Head and Shoulders (H&S) pattern, which suggests a potential reversal or continuation depending on price action at key levels. The neckline of the pattern aligns with the green support zone.
Key Levels:
Resistance Zone (Red Area - ~2,872): Price has tested this zone multiple times, making it a key level for a breakout.
Support Zone (Green Areas - ~2,860 and ~2,844): These zones act as crucial demand areas, where price could either bounce or break lower.
Possible Trade Scenarios:
Bullish Breakout:
If price breaks above the red resistance (~2,872) and successfully retests it as support, this would confirm a bullish continuation.
Entry Signal: Buy after a confirmed retest with bullish momentum.
Target: Next resistance levels around 2,884 - 2,890.
Stop-Loss: Below the previous structure (~2,864).
Bearish Breakdown:
If price fails at resistance and breaks below the green support (~2,860), a bearish move is likely.
Entry Signal: Sell after a successful retest of the broken support (~2,860) as new resistance.
Target: Lower support zone around 2,844.
Stop-Loss: Above the broken level (~2,868).
Neutral Range-Bound Scenario:
If price remains trapped between 2,860 and 2,872, traders should wait for a breakout before entering trades.
Trade Signal (Based on Breakout Confirmation)
Buy Signal: If price breaks and retests above 2,872, enter long with a target of 2,884+.
Sell Signal: If price breaks and retests below 2,860, enter short with a target of 2,844.
This strategy ensures safe trading by waiting for confirmation before taking positions.
Kindly follow, comment, and like to show support.

Bitcoin. Eternal Channel.Bitcoin faces ambiguous resistance in the $100k region and there is a threat of deliberate price manipulation to create artificial importance at this level. Price is at a decision point. A supply crisis is coming.


BTCUSD H4 - Short SignalBTCUSD H4
Trying to play ball here on BTCUSD, we are still trading south of $100k which is important, similarly ETH is still trading south of $3000, which is equally as important.
There is scope to see some more selling pressure here on BTCUSD and ETH, which we would hope takes us down to GETTEX:92K again and then potential beyond to the next area of major support.
Lets see what unfolds! We are following along!

Shiro Neko $Shiro Big Move IncomingIf you missed the Shiba Inu run, Shiro Neko could be your next golden opportunity. The same team that propelled SHIB to mainstream adoption is behind this project, and its early performance has already caught the market's attention.
Shiro Neko hit an impressive SEED_TVCODER77_ETHBTCDATA:1B market cap on launch and, after a period of consolidation, is gearing up for its next move.
📊 Market Analysis & Potential Reversal
Strong community-driven momentum similar to early SHIB & DOGE.
High-volume accumulation zones suggest whales positioning before the next breakout.
Support forming in key price levels, indicating potential for a parabolic move.
Key Catalysts for Growth
✅ Previous ATH – $SHIRO already reached SEED_TVCODER77_ETHBTCDATA:1B market cap, and a retest could be imminent.
✅ Dev Team with Proven Success – The same minds behind SHIB’s legendary run.
✅ Expanding Ecosystem – New listings, partnerships, and real-world utility in development.
✅ Early-stage growth potential – Market cap still has significant room to expand.
BINANCE:ETHUSDT BINANCE:CHILLGUYUSDT.P BINANCE:SHIBUSDT
