Bitcoin’s Final Wave & Time Reversal Zone _ New ATH Loading?Today, I want to analyze Bitcoin ( BINANCE:BTCUSDT ) on the weekly time frame and answer these questions :
Can Bitcoin create a new All-time High(ATH) or not!?
At what price range can Bitcoin's uptrend end!?
When can we expect the uptrend to end!?
Please stay with me.
Bitcoin appears to have managed to break the Resistance lines , although we saw a fake break a few months ago , and it also appears to have a Hammer Candlestick Pattern in the previous weekly candle , which could signal the completion of Bitcoin's pullback to the Resistance lines(broken).
In terms of time , if we want to analyze the Bitcoin chart and look at Bitcoin's past, in general, the months of June(Average=-0.13%/Median=+2.20%) and especially July(Average=+7.56%/Median=+8.90%) have been among the most productive months for Bitcoin , and the months of August(Average=+1.75%/Median=-8.04%) and September(Average=-3.77%/Median=-4.35%) were the months when Bitcoin had a correction . Technical analysis tools show the end of the upward trend and the beginning of Bitcoin's correction at the Time Reversal Zone(TRZ=June 23 to August 4) .
In terms of Elliott Wave theory , Bitcoin appears to be completing the main wave 5 , as the main wave 3 was extended .
I expect Bitcoin to trend higher(+10%) in the coming weeks and create a new ATH . New ATH could be created in the Potential Reversal Zone(PRZ) and TRZ , and then we can wait for the start of the main correction .
What do you think about Bitcoin’s future movement? Can Bitcoin create a new ATH? When and at what price?
Note: If Bitcoin falls below $100,000, we should expect further declines.
Please respect each other's ideas and express them politely if you agree or disagree.
Bitcoin Analyze (BTCUSDT), weekly time frame.
Be sure to follow the updated ideas.
Do not forget to put a Stop loss for your positions (For every position you want to open).
Please follow your strategy and updates; this is just my Idea, and I will gladly see your ideas in this post.
Please do not forget the ✅' like '✅ button 🙏😊 & Share it with your friends; thanks, and Trade safe.
Btc-bitcoin

BTCUSD – continuing to buy as breakout confirms bullish setupBTCUSD is forming a classic “cup and handle” pattern, now breaking above key resistance. Price is holding within an upward channel, and if momentum stays strong, the next target could reach 160,000 and beyond.
It might seem hard to believe, but the structure points to continued bullish momentum. I’m not missing this opportunity and continue to build long positions as this breakout develops.

$BTC Extremely Bullish Daily Close - Parabola Underway?Hawt diggity dayumm 🥵
CRYPTOCAP:BTC really going for it following my original idea behind the parabola formation 🤯
Reclaiming ATH high at $112k will confirm the move 🤞

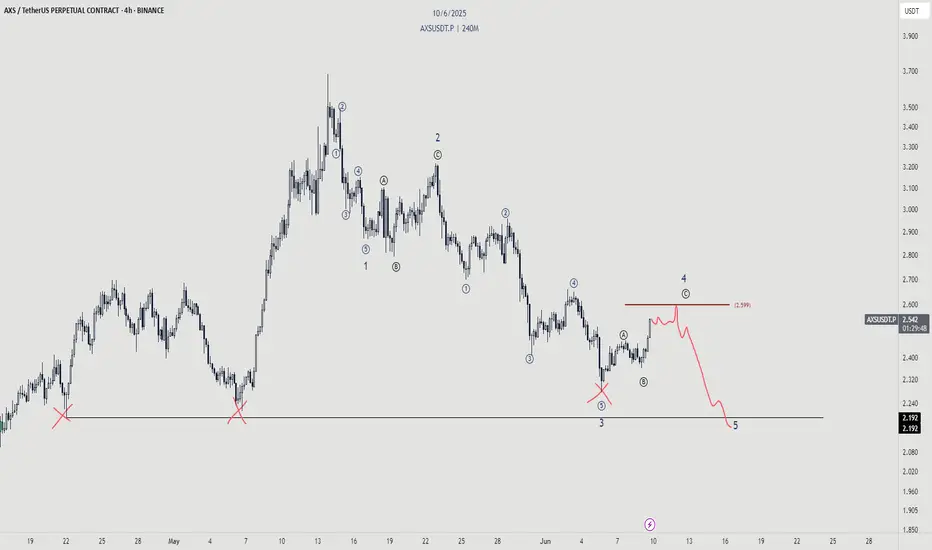
AXS - Dont be faked outWhile the bounce is nice, we should not forget about the real trend here.
We're still bearish overall and there is a shit ton of liquidity to be taken out. Don't be blinded
Bitcoin - Showing strength as it breaks key resistance levels!Bitcoin (BTC) recently demonstrated impressive strength by bouncing off a well-known confluence zone consisting of the golden pocket and a 4-hour fair value gap (FVG) around the $100,000 level. This technical area has historically acted as a reliable support and once again proved its significance, offering a solid foundation for the current rally.
Following this bounce, BTC surged to $108,000, decisively breaking above the 4-hour FVG near $107,000. With this breakout, the previously resistant zone is now expected to flip into support, adding further confidence to the bullish outlook. This type of price action is often seen in strong uptrends, where key resistance levels are reclaimed and converted into support, providing a base for further upside.
Importantly, BTC has also managed to push through the golden pocket resistance, a critical Fibonacci retracement area closely watched by traders. This breakout, in conjunction with the 4H FVG clearance, clears the path for a potential continuation toward Bitcoin’s all-time high.
Momentum is clearly building. Buying pressure is strong, and retracements have been shallow, indicating a market dominated by demand. While this is a bullish sign, a brief pullback or bounce off the newly formed support (the 4H FVG zone) would be healthy. Such a move would allow BTC to consolidate and build strength before potentially pushing toward new highs.
Overall, the technical landscape looks increasingly favorable for BTC. As long as it holds above the reclaimed support zones, the path to retesting, and possibly surpassing, the all-time high appears wide open.
Thanks for your support.
- Make sure to follow me so you don't miss out on the next analysis!
- Drop a like and leave a comment!

BTC (Y25.P2.E7). Bullish or Bearish setupHi traders,
Since we broke above the macro VAH, which could act like support, I'm expecting new highs, However If the 4 hour candle closes below the Anchored vWAP, then we look for Wave B in this recent move.
Difficult to call.
ABC to the upside and then a deeper correction like other ATH, with 12 to 14%.
I'm leaning to bullish and price to range sideways before making another bullish move to the upside.
We have 2 scenarios for sideways, mild or deep and broad.
Examples given below with the fractal of previous ATHs
Please give me a like and share,
Regards, S.SAri

HolderStat┆BTCUSD springs from 100k railAfter a week-long pullback, CRYPTOCAP:BTC ricochets off 100 k support, keeping the rising-channel narrative alive. Bitcoin price now squeezes beneath a descending trendline; a daily close over 109 k could unleash a breakout toward the 112-114 k resistance shelf.

H100 Group AB - Une bitcoin Treasury : 7.7 BTH100 Group AB is a company listed on Nasdaq First North (NGM Sweden), positioned as a Bitcoin Treasury Company. Formerly known as eBlitz Group, it recently underwent a major strategic pivot through a reverse merger with Healthy to 100 AS, a company focused on health, longevity, and sustainable technologies.
Since April 2025, H100 has started shifting to a hybrid model combining:
Bitcoin holdings as its primary treasury asset,
Investments in healthtech and wellness innovation,
An aggressive fundraising strategy through convertible loans to expand BTC acquisition and fund growth.
The company has recently accumulated 7.7 BTC in a “MicroStrategy-like” approach.
Trading volume has surged since May 2025.
The stock shows high volatility, often correlated with Bitcoin movements.
Active financing through convertibles (dilution risk to monitor).
Conclusion: H100 is a speculative play on Bitcoin performance, supported by a growth-oriented vision in the health and digital assets sectors.

Bitcoin summer of fun...If we are in a continuation pattern, and Bitcoin breaks the neckline soon.
We could be on the cusp of a very interesting and strong few months of price action.
Continuation upward sloping #inverseheadandshoudlers

ETHEREUM is repeating BITCOIN's 2018-2021 Cycle!Ethereum (ETHUSD) has found itself on a very strong rally since the April 07 bottom, which resembles the V-shaped recovery of Bitcoin on the March 09 2020 bottom. In fact BTC's whole 2018 - 2021 Bull Cycle resembles ETH's 2022 - 2025 Cycle so far.
So far ETH is struggling to break above its 1W MA50 (blue trend-line) but the most important Resistance of the Cycle is the ATH Lower Highs trend-line. When that broke for Bitcoin, a parabolic rally started. Do you think we will see such a break-out on ETH too by the end of the year?
-------------------------------------------------------------------------------
** Please LIKE 👍, FOLLOW ✅, SHARE 🙌 and COMMENT ✍ if you enjoy this idea! Also share your ideas and charts in the comments section below! This is best way to keep it relevant, support us, keep the content here free and allow the idea to reach as many people as possible. **
-------------------------------------------------------------------------------
💸💸💸💸💸💸
👇 👇 👇 👇 👇 👇

09/06/25 Weekly OutlookLast weeks high: $106,812.33
Last weeks low: $100,372.93
Midpoint: $103,592.63
Billionaire spats and V-shaped recoveries, the beginning of June starts off in an interesting way. As President Trump goes forward with "The big beautiful bill" Elon Musk lets his feelings be known publicly sending shockwaves throughout markets, but what does this mean for Bitcoin?
The bill could add $3-5T in US government spending which is great for risk-on assets as there is more money able to flow into markets. I believe this exact thought process is visible on the chart in the V-shaped recovery we can see on Thursday. A clear sell-off as Elon Musk's anti government spending views clash with the bill, the uncertainty causes a sell the news moment, just as BTC comes into $100,000 the dip is bought up on the realization this means greater inflows are on the way, dips are truly for buying at this stage in the cycle and to me, this proves it.
In a more bearish view of the chart I would say the clear resistance is now weekly high at ~$106,000. Anything above that meets huge selling pressure with price discovery on the other side the market just doesn't seem to have the fuel as of yet to make the next step. However I believe it is just a matter of time and as M2 global money supply grows we get closer and closer to seeing new significant highs.
For this week CPI & PPI take place on Wednesday and Friday respectively. With CPI set to grow from 2.3% to 2.5% according to forecasts it will be interesting to see how markets react, expect short term volatility. Key battlegrounds for me are weekly high and midpoint.
Good luck this week everybody!

Bitcoin’s Reversal from Supports — Is the Correction Over? Bitcoin ( BINANCE:BTCUSDT ) moved as I expected in the previous idea , and it also reversed the decline I intended and started to rise from the Support zone($102,000-$107,120) , Support lines , and 50_SMA(Daily) .
Bitcoin is trading near the Resistance zone($104,380-$103,670) , Cumulative Short Liquidation Leverage($105,500-$105,265) , and Resistance lines .
In terms of Elliott Wave theory , it seems that Bitcoin has managed to complete the main wave Y . The main corrective structure was the Double Three Correction(WXY) . If the Resistance lines are broken , we can confirm the end of the main wave Y .
I expect Bitcoin to start rising after a re-correction from Cumulative Long Liquidations Leverage and reach the targets I have specified on the chart.
Cumulative Long Liquidation Leverage: $102,883-$102,181
Cumulative Long Liquidation Leverage: $101,318-$100,748
Note: If Bitcoin falls below $100,200(Worst Stop Loss(SL)), we should expect further declines.
Note: $105,500 is an important price for Bitcoin, and if Bitcoin can close the 4-hour candle above it, we can expect a break of the Heavy Resistance zone($104,380-$103,670)
Please respect each other's ideas and express them politely if you agree or disagree.
Bitcoin Analyze (BTCUSDT), 1-hour time frame.
Be sure to follow the updated ideas.
Do not forget to put a Stop loss for your positions (For every position you want to open).
Please follow your strategy and updates; this is just my Idea, and I will gladly see your ideas in this post.
Please do not forget the ✅' like '✅ button 🙏😊 & Share it with your friends; thanks, and Trade safe.

BTC UPDATE - SIDEWAYS ACTION BTC had an impressive rally today that broke key resistance and changed the wave form to the short term trend back to up. From this elevated price level, the uptrend will not produce any significant gains from here tho. To capture this mini trend requires to be patient and buy on dips. Back to near $103,500 - $102,000 as seen in the chart could produce a few swings. However, when these swings are over, I currently still have the medium term trend as down. With $84k target. That could get update, but for now we do not have that data. I see all up movement capped at around $107,000. Prices above $107,000 have me moving back to the immediate $132,000 price target. But again, we are not there yet. Good luck.

$BTC Failed to Reclaim EMA9 - 200DMA in SightSo close, but so far away.
CRYPTOCAP:BTC held the 50DMA as support today but failed to break above the EMA9.
I suspect ₿itcoin now makes it way back down for the long awaited retest of the 200DMA ~$95k as I’ve been stating since the death cross.
If BTC can reclaim the EMA9 to close the week there may be a shot to continue the bullish uptrend, otherwise this correction will take a few weeks to play out.

Bitcoin's Structure Breaks — PRZ May Trigger a BounceBitcoin ( BINANCE:BTCUSDT ) has finally continued its downward trend , as I expected in my previous idea .
Do you think this downward trend will continue or not?
Bitcoin has now managed to break the Support zone($104,180-$103,670) and the lower line of the Ascending Broadening Wedge Pattern .
In terms of Elliott Wave theory , Bitcoin appears to be completing microwave C of the main wave Y of the Double Three Correction(WXY) .
I expect Bitcoin to continue to decline to the Support zone($102,000-$107,120) and the Potential Reversal Zone(PRZ) and then start to rise again.
I choose to label this idea as ''Long''.
Note: If Bitcoin falls below $100,200, we should expect further declines.
Please respect each other's ideas and express them politely if you agree or disagree.
Bitcoin Analyze (BTCUSDT), 1-hour time frame.
Be sure to follow the updated ideas.
Do not forget to put a Stop loss for your positions (For every position you want to open).
Please follow your strategy and updates; this is just my Idea, and I will gladly see your ideas in this post.
Please do not forget the ✅' like '✅ button 🙏😊 & Share it with your friends; thanks, and Trade safe.

BTC (Y25.P2.E6).Likely fractalHi Traders,
I'm looking at this level as a likely scenario.
Why?
Its happened x2 in the past when we made ATH.
A 12 and 14% retracement.
The liquidity is there, the incentive is there and a low like this will make people sell as to think the bull run is over.
We have our levels to trade for shorts and longs but ultimately, I think it will make its way down to here.
As per my post, this current level was a long entry and I'm in a long, however its not the response I was hoping for.
So its likely a scalp trade and hence I will be looking for a short as well.
All the best.
S.SAri
Y24, March ATH
Y21 ATH
current support, AvWap

Bitcoin – Entering a distribution phase after a bull trap?Since the second week of May, Bitcoin (BTC) has exhibited a textbook accumulation phase, with a well-defined trading range forming just below the previous all-time high. Beginning around May 12, price action became increasingly compressed, marked by a series of higher lows and relatively flat resistance, indicating growing demand and waning selling pressure. This consolidation structure persisted for more than a week, suggesting that larger players were accumulating positions in anticipation of a breakout. Now it could be making the Power of 3. Accumulation, manipulation and distribution.
Accumulation, manipulation and distribution
Eventually, this coiled energy resolved to the upside. BTC broke through the upper boundary of the accumulation zone with increasing volume and momentum, triggering a sharp rally and leading to the formation of a new all-time high. At that point, market sentiment turned decidedly bullish, with breakout traders entering the market, expecting continuation. However, the price failed to sustain above the previous ATH for long. Despite the breakout’s initial strength, Bitcoin was unable to establish a solid foothold above the critical psychological and technical level, which has now proven to be a key inflection point.
Soon after setting a new high, BTC began to reverse, shedding gains and retracing back below the former resistance level, which had temporarily acted as support. The breakdown below the $106,000 mark, previously the ceiling of the accumulation range, signaled a notable shift in market structure. What was initially viewed as a healthy continuation pattern evolved into what now appears to be a classic bull trap. This type of failed breakout often leaves market participants vulnerable, as late buyers are caught in drawdowns and early longs may be incentivized to exit positions.
Given this context, the recent price action carries the hallmarks of a Power of 3, where market makers and institutions may be offloading positions to less informed participants. This phase is often mistaken for continued accumulation by retail traders due to its structural similarity; however, the key difference lies in the failure to maintain new highs and the emergence of lower highs on any attempted bounce. The rejection above the ATH and the subsequent breakdown below $106K has introduced significant overhead supply, which may act as resistance in the near term.
Target levels
As BTC continues to trade below this critical level, the likelihood of a further retracement grows. The market appears to be transitioning into a phase of redistribution or distribution proper, where price is likely to be capped on rallies and pressured lower over time. It is reasonable to expect that Bitcoin could revisit $100.000 to mid-$90,000s, an area that may serve as a magnet for liquidity and a potential staging ground for the next major move. This region could represent a "Last Point of Supply" (LPSY) within the Wyckoff framework, typically the final area where smart money distributes before initiating a more decisive markdown phase.
Nevertheless, this potential pullback should not be viewed solely as a sign of weakness. In many bull cycles, such corrections and shakeouts serve to flush out over-leveraged positions and reset sentiment, ultimately laying the groundwork for renewed upward momentum. Should BTC find stability and demand re-emerge in the $95K–$100K range, it could mark the beginning of a new re-accumulation phase, leading to a healthier and more sustainable advance.
Conclusion
In summary, the recent breakout above ATH followed by a sharp reversal and loss of key support paints a cautionary picture in the short term. Bitcoin may currently be navigating a distribution zone, with downside pressure likely to persist as the market digests recent gains. However, such corrections are typical in broader uptrends and often present opportunities for strategic entries once the next accumulation structure becomes clear. Patience and disciplined observation will be essential as the market defines its next directional bias.
Thanks for your support.
- Make sure to follow me so you don't miss out on the next analysis!
- Drop a like and leave a comment!

BTC falling ... thanks orange swanBTC dumping through the volume gap. Oversold conditions will give you the best opportunities.
Full TA: Link in the BIO

HolderStat┆BTCUSD pennant pauseCRYPTOCAP:BTC cools under 106 k inside a narrowing pennant pinned to its long-term rising rail. Successive ascending consolidation triangles hint at continuation, projecting a thrust toward the 111 k resistance shelf. Holding the pattern’s base keeps breakout odds tilted north.

BTC PredictionWXY
It's unfolding exactly as I mentioned before.
Wave X has been completed,
and now the downward Y wave has begun.
First, a 5-wave decline will take place as the initial move.
It's short time!

2/2 Bitcoin looks similar to 2021Post 2 of 2
#Bitcoin is trading similarly to 2021.
Major difference? The move is more ORGANIZED today.
Volume is substantially more.
Did #BTC top, like really top?
We want to say no, but things can change!
Current:
$ Flow is much weaker vs December 24 top.
RSI is lower as well.
It looks like CRYPTOCAP:BTC will likely break 100k again, 95k IMO.
80k = IMPORTANT AREA!

THE END OF BTC!🚨 SOMETHING BIG IS COMING TO THE CRYPTO MARKET 🚨
Two massive bearish divergences flashing on the HIGHER TIMEFRAMES:
🟥 WEEKLY
🟥 MONTHLY
This is NOT just noise. These divergences don’t show up for fun — they often precede violent corrections.
We might be standing right in front of a major crash.
Maybe not from today, but August could be the breaking point.
Risk is growing.
Liquidity is thinning.
Smart money is already adjusting.
If you think the bull run will last forever — think again.
I’m watching this setup VERY closely.
🚩 Stay sharp. Stay protected.

1/2 Bitcoin call was good, so far, short term top in placeNot long after our post May 20th we began to sell some CRYPTOCAP:BTC ETF's. It was a good call, still have some, & we believe #Bitcoin still has consolidation in order.
We're waiting to see how the #BTC RSI reacts & wow it reacts to the Green Moving Avg.
Selling volume is light & this means that there is a LACK of BUYERS, at least for now.
#crypto
Please see our profile for more info on posts.
