Bitcoin’s Rally Fades Below Resistances — Bearish Wave Setup!Bitcoin ( BINANCE:BTCUSDT ) started to fall as I expected in the previous idea , but failed to break the Heavy Resistance zone($110,000-$105,820) .
Bitcoin is trading near the Resistance zone($107,520-$105,940) , Cumulative Short Liquidation Leverage($106,720-$105,948) , and the Resistance lines .
From the perspective of Elliott Wave theory , Bitcoin appears to have completed a main wave 4 near the Resistance lines. The structure of the main wave 4 was a Double Three Correction(WXY) . One of the signs of the completion of the main wave 4 could be the Evening Star Candlestick Pattern .
I expect Bitcoin to decline to at least Cumulative Long Liquidation Leverage($103,666-$102,800) AFTER breaking the Support line , and the next target is the Support zone($102,000-$107,120) .
Note: Rising tensions between Russia and Ukraine could help drive down Bitcoin.
Note: If Bitcoin touches $107,600, we can expect more pumps.
Please respect each other's ideas and express them politely if you agree or disagree.
Bitcoin Analyze (BTCUSDT), 1-hour time frame.
Be sure to follow the updated ideas.
Do not forget to put a Stop loss for your positions (For every position you want to open).
Please follow your strategy and updates; this is just my Idea, and I will gladly see your ideas in this post.
Please do not forget the ✅' like '✅ button 🙏😊 & Share it with your friends; thanks, and Trade safe.
Btc-bitcoin

AUDCHF BULLISH OR BEARISH DETAILED ANALYSISAUDCHF is currently breaking out of a textbook falling wedge pattern on the 4H chart, signaling a potential shift in momentum from bearish to bullish. Price action has been consolidating within this structure for several weeks, creating lower highs and lower lows, but with clear bullish divergence beginning to show up in recent sessions. The breakout around the 0.53300 zone marks a significant technical confirmation that bulls are taking control, with eyes now on the 0.54400 target.
From a fundamental standpoint, the Australian dollar is gaining strength backed by hawkish sentiment from the RBA. Despite global uncertainties, the RBA’s firm stance on managing inflation is keeping the Aussie resilient. On the flip side, the Swiss franc has been showing signs of relative weakness due to softer inflation readings and safe-haven outflows as global risk sentiment improves. This macro backdrop is creating favorable conditions for AUDCHF to rally.
Technically, this breakout aligns with strong market structure and volume support, making this a high-conviction bullish setup. The breakout candle is closing above resistance with momentum, and as long as price holds above the 0.53250–0.53000 zone, bulls are likely to maintain control. With the falling wedge breakout and favorable risk-reward setup, the upside move toward 0.54400 looks increasingly probable.
This is a clean price action play with fundamental alignment. The breakout not only confirms the end of the previous downtrend, but also opens up space for a bullish wave to unfold. Momentum traders and swing traders will want to watch this closely as AUDCHF transitions from accumulation to a potential bullish expansion phase.

BTC - UPDATE - $84,500 target BTC appears to reluctantly be topping, with a while probability of having already topped at $112,000. My best estimate of the next on boarding price for BTC is in the $84,500 area. Prices above $108,632 indicate I was wrong. Pros could consider shorting to the same number. This is just conversation. And not trading advice. Murrey Math, Elliot Wave , Kumar Wave being employed. See past charts for how we got to here.

Bitcoin Global m2While the Global Liquidity Index is on the verge of a parabolic run like the 2011\2013 2016\2017 and 2020\2021 processes, a bear season for #Bitcoin cannot be mentioned

Bitcoin Brewing - A large move is coming!Bitcoin has been under pressure over the last few trading sessions.
Despite the equity markets going higher this asset is stuck in a holding pattern.
We are currently forming a wedge pattern that has given us a directional bias to trade.
Price action is at a 50/50 in terms of falling lower or rallying higher.
Being the fact that the bulls have been forming higher lows & higher highs, we have to give them due respect.
However understand this BTC is showing some distribution signs and is likely going to have a decent selloff within the next 15-45days. We may have 1 more spike higher but we may not.
1 note of interest is the 7day & 20 day moving average just signaled a bearish crossover which is something you need to monitor closely.
I do think the upside is limited to about 115K if we have 1 more move higher.

BTC - Will BTC fill the 4H inbalance at $107.400Bitcoin (BTC) is currently exhibiting a clear downtrend on the 4-hour timeframe. During the most recent downward move, it left behind an imbalance, specifically, a 4-hour Fair Value Gap (FVG), which the price is now retracing toward. This area represents a potential zone of interest for entering a short position, given the prevailing bearish structure.
At the same time, BTC is approaching the golden pocket of the Fibonacci retracement, a level often watched by traders for potential reversals. This zone coincides with a former support level that provided multiple bounces in the past, but has now flipped into a potential resistance. The confluence of these factors could add significant selling pressure.
It’s important to note that BTC does not necessarily need to reach the imbalance zone to resume its downward movement. However, the presence of that FVG remains a relevant detail to monitor in case price action does continue higher before reversing.
Thanks for your support.
- Make sure to follow me so you don't miss out on the next analysis!
- Drop a like and leave a comment!

HolderStat┆BTCUSD stairway to athCRYPTOCAP:BTC marched out of strong consolidation, sliced a falling wedge, then keeps stacking bull-flag consolidations on an ascending trendline. Uptrend channel, breakout energy and 100 k support line up for an assault on the 112 k ATH level — bullish momentum in full swing.

BTCUSDT – Ready for the next downward move🚀 Trade Setup Details:
🕯 #BTC/USDT 🔽 Sell | Short 🔽
⌛️ TimeFrame: 15m
--------------------
🛡 Risk Management:
🛡 If Your Account Balance: $1000
🛡 If Your Loss-Limit: 1%
🛡 Then Your Signal Margin: $1369.86
--------------------
☄️ En1: 104838.38 (Amount: $136.99)
☄️ En2: 105096.3 (Amount: $479.45)
☄️ En3: 105280.29 (Amount: $616.44)
☄️ En4: 105464.61 (Amount: $136.99)
--------------------
☄️ If All Entries Are Activated, Then:
☄️ Average.En: 105190.14 ($1369.86)
--------------------
☑️ TP1: 104215.87 (+0.93%) (RR:1.27)
☑️ TP2: 103752.49 (+1.37%) (RR:1.88)
☑️ TP3: 103166.5 (+1.92%) (RR:2.63)
☑️ TP4: 102425.86 (+2.63%) (RR:3.6)
☑️ TP5: 101614.34 (+3.4%) (RR:4.66)
--------------------
❌ SL: 105957.69 (-0.73%) (-$10)
--------------------
💯 Maximum.Lev: 75X
⌛️ Trading Type: Swing Trading
‼️ Signal Risk: ⚠️ High-Risk! ⚠️
🔎 Technical Analysis Breakdown:
This technical analysis is based on Price Action, Elliott waves, SMC (Smart Money Concepts), and ICT (Inner Circle Trader) concepts. All entry points, Target Points, and Stop Losses are calculated using professional mathematical formulas. As a result, you can have an optimal trade setup based on great risk management.
⚠️ Disclaimer:
Trading involves significant risk, and past performance does not guarantee future results. This analysis is for informational purposes only and should not be considered financial advice. Always conduct your research and trade responsibly.
💡 Stay Updated:
Like this technical analysis? Follow me for more in-depth insights, technical setups, and market updates. Let's trade smarter together!

BTC Scalping / Intraday Signal – Entry, Stop & Target Ready!🕒 Timeframe: 15min / 5min
⚠️ Note: Manage your risk — intraday volatility is high.
This is a short-term opportunity, not a long hold.
Disclaimer: This is our personal analysis and not financial advice. Always do your own research before making any investment decisions.
💬 What’s your take on this? Drop your thoughts in the comments and feel free to share this with your friends! ❤️

BTCUSD: Neutral but long term still intact.Bitcoin has turned neutral on its 1D technical outlook (RSI = 50.968, MACD = 1795.700, ADX = 23.670) a direct consequence of last week's correction. That correction is though just a pullback on the 1W timeframe, which is more bullish than ever as it's coming off a May 1W MACD Bullish Cross. Since the 1W MA50 supported April's bottom and produced the current rebound (even ATH has been made) that also respected the powerful P1 trendline, this is a bullish wave similar to all prior since the late 2022 Bear Cycle bottom. As all 3 rallied by +100%, we can stay bullish aiming for 150,000 towards the end of the year.
## If you like our free content follow our profile to get more daily ideas. ##
## Comments and likes are greatly appreciated. ##

BTC eliot wave prediction
106,600$ → 100,300$ → 116,000$
The third extended wave of Bitcoin has completed, and it is now going through a correction phase.
Wave 4 corrections often retrace to the 0.382 Fibonacci level.
Therefore, a price drop to that level is expected — around $106,600.
This correction is unfolding as a W–X–Y pattern.
In wave W, the internal ABC subwaves completed with wave C reaching 1.618 times the length of wave A.
Currently, Bitcoin is in the rising phase of wave X.
No one knows how high wave X will go,
but what’s important is that after wave X finishes,
one more lower low is expected — again around $106,600.
At that price level, I plan to open a $2 billion long position with 10x leverage.

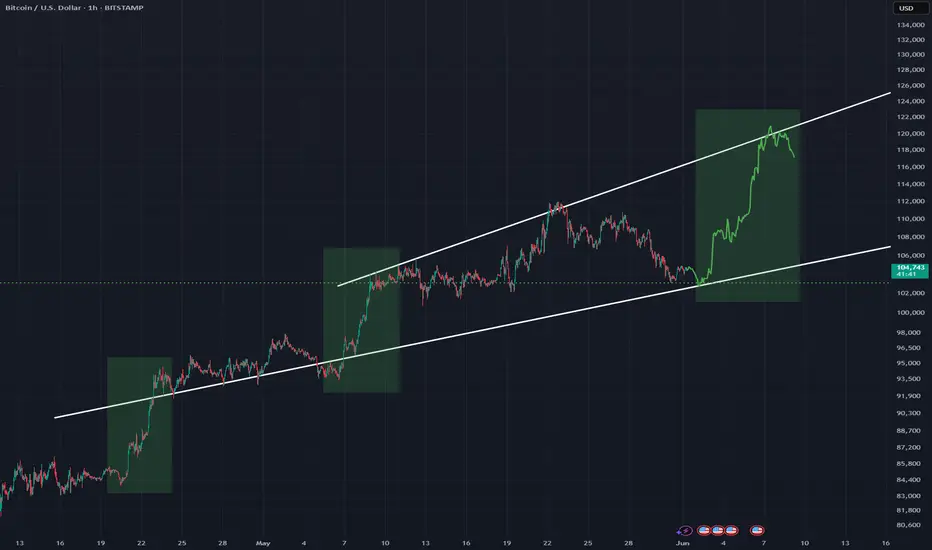
BTCUSD - Bear Double Top ScenarioBitcoin is still above the ascending trend line in green however price is looking to form a next high reaching new ATH's
This could lead to resistance at the next top creating a double top, pushing price back down to the ascending trend line. From there if this strong trend line in green breaks it could turn very bearish below that line.
4Hr chart

Bullish View #BTC Looking for a third strong wave up within this expanding pattern as price hits support in white
Moves up in green rectangles are similar
Hourly timeframe with the horizontal dotted line as a strong support line
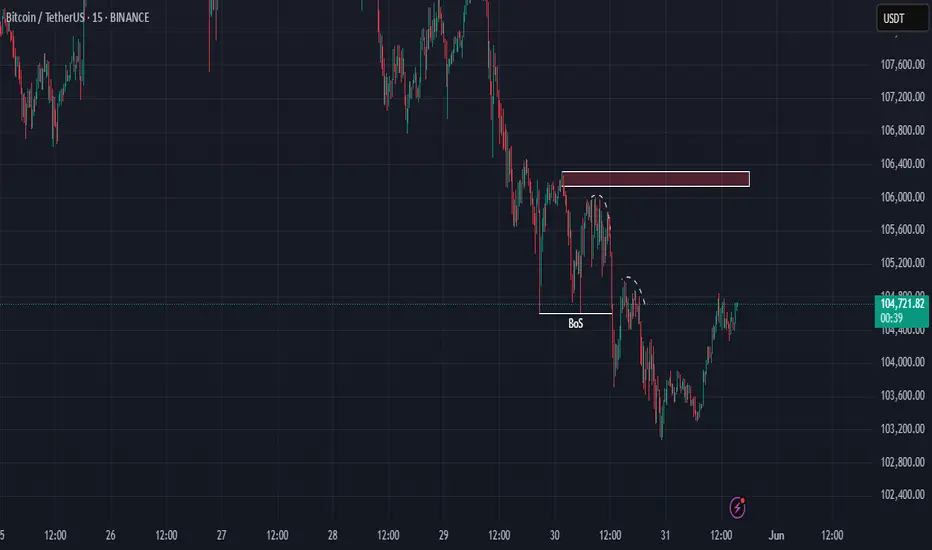
BTC/USDT: Correction to H1 Demand Zone? Multi-Timeframe Strategy🔹 H1 Context (Bullish):
- Demand zone (green) below Fib 0.5: Key support.
- Breakout (BOS) suggests bullish continuation *after possible correction*.
🔹 M5/M15 Situation (Short-Term):
- Price rejecting red zones (immediate resistance).
- Scenario 1 (Bearish):
→ If price respects red zones: Correction toward H1 demand ($103K).
→ Action: Short trades in M5/M15 targeting green zone.
- Scenario 2 (Bullish):
→ If red zones break: Confirmation of strength (new highs target).
🔹 Risk Management:
- Short entries: Rejection at M5/M15 red zones + M1 confirmation.
- TP: M15 lows ($103.5K) or H1 demand zone ($103K).
- SL: Close above red zones.
🔹 Technical Key:
- H2 Order Block as dynamic support: If respected, prevents drop to H1.
- Confluence: H1 demand + Fib 0.5 = High-probability area.
#BTC #Bitcoin #Trading #Crypto #H1 #M15 #TechnicalAnalysis #Fibonacci
Maybe your biggest risk is your biggest chance !!!The price is currently forming the second corrective wave, and a slight price drop to reach higher levels is normal.
Give me some energy !!
✨We spend hours finding potential opportunities and writing useful ideas, we would be happy if you support us.
Best regards CobraVanguard.💚
_ _ _ _ __ _ _ _ _ _ _ _ _ _ _ _ _ _ _ _ _ _ _ _ _ _ _ _ _ _ _ _
✅Thank you, and for more ideas, hit ❤️Like❤️ and 🌟Follow🌟!
⚠️Things can change...
The markets are always changing and even with all these signals, the market changes tend to be strong and fast!!

Market3I haven’t been posting much lately simply because there’s nothing particularly interesting to say, the market has been a bit dull.
2025 should be a strong year for altcoins, as they’ve been consistently suppressed. With BTC dominance reaching 64%, which is quite significant, all attention remains on Bitcoin.
On this chart, you can see that $1.17 trillion acted as a rejection level for the crypto market (excluding BTC and ETH). Time will tell, but I anticipate a $4 trillion altcoin bull market before the end of 2025.
Remember, Fibonacci plays a crucial role in long-term market predictions.
Invest wisely and at the right time.
Happy Tr4Ding !

Altcoins The Moon AwaitsLike always, everything is clearly outlined on the charts :
- As a trader, it's crucial to follow logic and technical analysis. If you get caught up in the news and listen to everyone on Twitter, you won't last long.
- The first major altcoin rally was in 2018, pushing the market to $300 billion. This level later acted as a key support throughout the 2022–2023 bear market.
- The last all-time high for the crypto market (excluding Bitcoin and Ethereum) reached $1.15 trillion in 2021. ( blue doted vertical line )
- This all-time high was retested in December 2024, with this ATH acting as strong resistance. ( second blue doted vertical line )
- The next move could be a breakout above this resistance. According to Fibonacci projections, the altcoin market has the potential to reach $4 trillion.
While the spotlight remains on Bitcoin and ETFs, altcoins could catch up with a sudden and powerful surge, so make sure you’re not left behind.
Hodl!
Happy Tr4Ding !

$BTC.D Dominance forecast: update May 2025📉 BTC Dominance (%BTC.D) Update – At Resistance, Altseason in the Balance
Back on April 5th, I published a forecast highlighting the critical 65% resistance level on BTC Dominance. That analysis still holds: BTC.D reached 65% and got rejected, pulling back to 62% as of now.
⚔️ What’s Happening?
Bitcoin dominance is compressing, and we're approaching a make-or-break moment:
🔹 Resistance confirmed at 65%
🔹 We bounced down to 62% — not up
🔹 Market is hesitating, and the next move will shape the short-term direction for alts
🔍 The Bigger Picture
Bitcoin pumped hard recently, mostly due to:
MACD reversal on the weekly
Oversold conditions now turning bullish
Renewed institutional interest in risk-on assets
But let’s be clear:
🚫 We’re not in a full altseason yet.
What we’re seeing is cautious altcoin rotation, not a blow-off alt rally.
📊 Tech Indicators
MACD: Overheated
RSI: Still has room to move up
So technically, BTC.D could still break out above 65% — but it hasn’t yet.
⚠️ What to Watch:
If BTC.D breaks out above 65%, expect:
➡️ Altcoin bloodbath
➡️ BTC.D could head toward 70%, crushing the mini-altseason
But if BTC.D continues to drop from here?
➡️ Altseason starts to heat up
🔮 Outlook
A true altseason might not arrive until September/October. For now, the market is stuck in a range of uncertainty.
Keep your eyes on:
BTC.D reaction at 62%–65%
TradFi stress (bond markets, macro fears)
Bitcoin strength and ETH/BTC ratio
🧠 Take profits when you can. Protect your capital.
📌 Follow me for future updates—and don’t forget to DYOR.
📎 Original forecast:

SUSDT - 1WThe previous bullish analysis failed and I currently expect a correction to the range of 0.3 to 0.33 cents...

Bitcoin is bearish | stay cautious (1H)This analysis is an update of the analysis you see in the "Related publications" section
We have been warning about a potential Bitcoin correction for some time. It appears that wave G has ended, and key levels have been lost. If the price reaches the red box, it is expected to be rejected downward.
The green zone is a relatively strong support area for Bitcoin, and we should closely watch this level.
A daily candle closing above the invalidation level would invalidate this analysis.
For risk management, please don't forget stop loss and capital management
Comment if you have any questions
Thank You

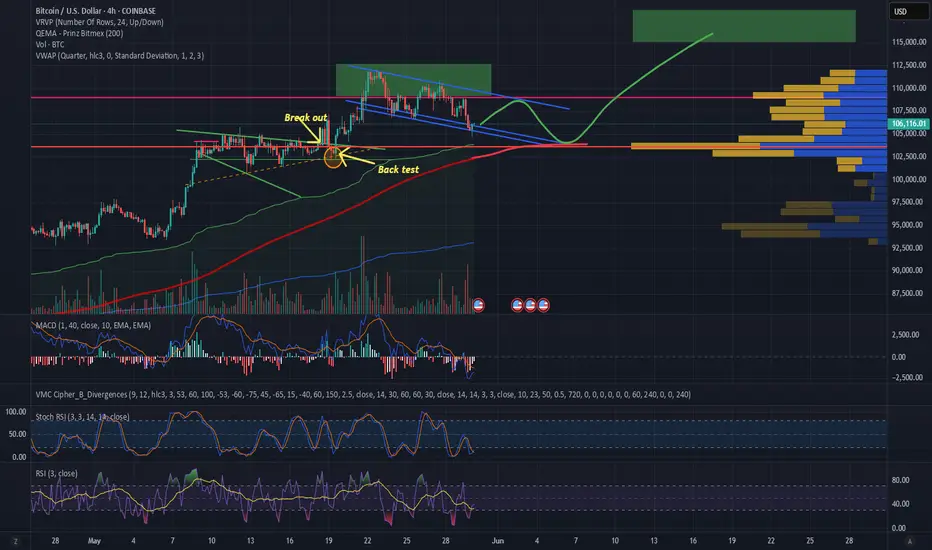
$BTC $104K TO $121K
Bitcoin's retreat to the $104k major support will be welcomed as a healthy bit correction, and I think the target will be $121k unless closures below this level are seen.

Bitcoin Sideways Then UpI think we will go sideways and then bounce off the 4hr 200ma as we run up to higher prices, thus continuing the pursuit of price discovery towards $115k-120K +/-. Not financial advice. DYOR.
$BTC Trend Broken - $102k NextThe trend has broken.
₿itcoin respects thy squigglets 🤓
$102k CRYPTOCAP:BTC here we come 🥸
If that doesn't hold, the 200DMA prophecy ~$95k will be fulfilled 🥲
