BTC shell fall!!!?This is how i am looking at market...
I can see a bearish triangle pattern in 4hr chart, which shows that btc may go 109,000-109,800 to complete third spike, then it might fall, main Support level will be 107,000-106,890, if market breaks it successfully then BTC may show 102,000 or if btc respect it's support level, then market may touch all time high 114,000!!!.
Btc-bitcoin

Bitcoin is correcting to support. Possible growth to 110.000Bitcoin failed to hold above 110000, but at the same time the price is forming a flat. The support has not been tested yet (the cascade of orders below the level has not been touched) and within the uptrend the area of 106700 plays an important role.
Based on bitcoin is inside the flat you can consider trading between its boundaries.
Scenario: Within the current movement, the price is likely to form a retest of the 106700 support with the aim of liquidation and accumulation inside the flat. False break of support may attract buyers and in this case bitcoin may test 110000 again.

BTC OUT OF STEAM - $84.5 K Updating the BTC coverage. Was hoping to push thru directly to $132k, that did not happen. It looks more likely BTC will drop back to $84,500 before a resumption of trend can continue. There is a chance she can hold at $95,600 but currently not the best odds for that. A full dip looks to be coming. Take profits on BTC now.

BTCUSD: 1M turned overbought and that's not alarming at all! Bitcoin has turned bullish even on its 1M technical outlook (RSI = 70.030, MACD = 16,156.720, ADX = 38.100) but that's not a reason to expect any strong corrections as this is the part were it technically rises more during Bull Cycles. The basic structure of the Cycle is an Ascending Triangle which breaks when the parabolic rallies begin. Based on the ratio of the last two Cycles, the new rally should be around +130% from the top of the Ascending Triandle. That gives a $160,000 fair estimate as far as the Cycle top is concerned.
## If you like our free content follow our profile to get more daily ideas. ##
## Comments and likes are greatly appreciated. ##

BTC Trap & Reverse: The Power of SFPs in ActionBTC continues to chop in a tight range near its previous all-time high. While price action may appear messy at first glance, traders using a combination of structure, Fibonacci levels, and order flow tools are spotting clean opportunities — especially through Swing Failure Patterns (SFPs).
🔍 What Just Happened?
Bitcoin recently rejected from the 0.786 Fibonacci retracement level — a classic reaction zone. What made this move powerful was the SFP that formed at that level. Price swept above a prior high, triggering breakout buys, only to reverse. This type of move traps late longs and offers an ideal short entry.
🧠 Educational Insight: Why SFPs Are One of the Best Setups
SFPs (Swing Failure Patterns) are some of the highest-probability trades you can take for a few key reasons:
1️⃣ Liquidity-driven: They form where stop losses cluster — above highs or below lows — creating a magnet for price.
2️⃣ Clean invalidation: The wick high/low gives a natural stop-loss level, keeping risk tight.
3️⃣ Fast reaction: Once trapped traders are forced to exit, price often reverses sharply — giving you strong follow-through.
4️⃣ Confirmable with order flow: Using tools like Exocharts, you can see aggressive longs/shorts piling in just before the reversal. This adds conviction to the setup.
📏 Current Confluence:
Rejection from the 0.786 Fib retracement
SFP confirmed on high volume
1:1 trend-based Fib extension sits at ~$105,410
That level also lines up with the 0.666 Fib retracement
Anchored VWAP around $105K
Liquidity pool right at that zone too — a likely magnet
🎯 Trade Idea:
Short triggered at the SFP wick, stop just above it. First target: the 1:1 extension near $105.4K. Risk-reward is excellent with high probability if price continues to unwind late longs.
✅ Key Takeaway:
In ranges like this, you don’t need to guess direction — you need to react to structure. SFPs give you that edge. When paired with real-time tools like Exocharts and anchored VWAPs, these trades become sniper entries rather than coin flips.
Let the market show its hand — and trade the reaction, not the prediction.
📌 Summary:
This is how you avoid overtrading in chop: wait for key levels, watch how price reacts, and let trapped traders create the move. If BTC revisits the $105K region, it’s a major area to watch for reaction — or to take partials if you’re in a short.
The best trades come from patience + precision.
_________________________________
If you found this helpful, leave a like and comment below! Got requests for the next technical analysis? Let me know.

Is the momentum in Bitcoin EXHAUSTED? Or not yet?In recent days, Bitcoin has been actively updating its ATH almost daily. Everyone is already predicting $150,000 by the end of the month.
🔥 But is everything really so rosy? Let's take a closer look!
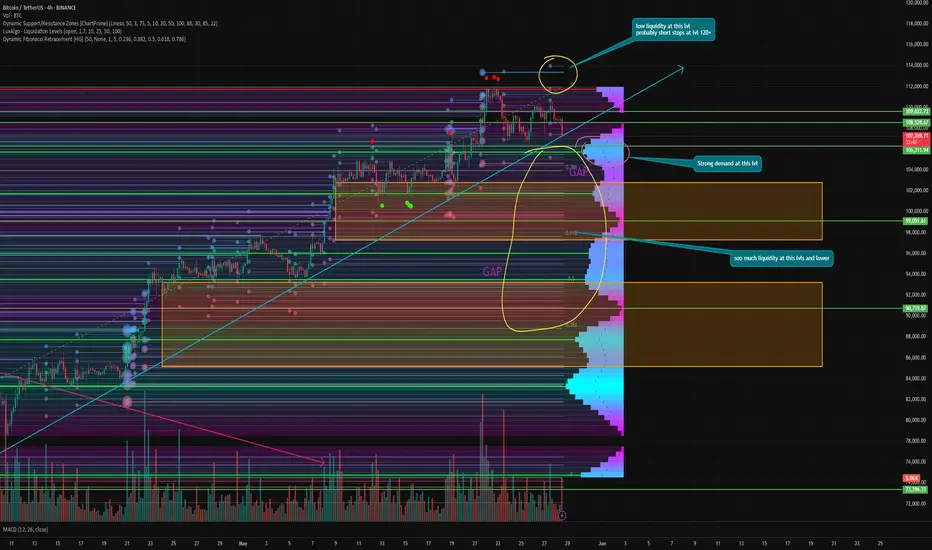
During the powerful growth over the past month, two gaps have formed below us. The first is at $97,368–102,867. The second is at $85,158–93,232. And as we know, in 99% of cases, gaps close sooner or later.
📊 Technical:
Liquidity zones - as we know, the price moves from liquidity to liquidity, which pushes it in one direction or another. Right now, there is practically no liquidity above us; it is all concentrated below. Only a move to $99,000 can now liquidate more than a billion dollars in longs.
I think short sellers' stops are much higher, at $120,000 and above. There is no point in placing them here when there is still no confirmation of a trend reversal.
⚙️ Metrics and indicators:
Volume - as I say in every review - is not a new growth impulse. It is a technical rebound. It has been moving at reduced volumes all along, which have only continued to decline.
MACD - has already given a bearish crossover , but this is certainly not the best indicator on such a TF. However, in combination with other indicators, it can predict a trend reversal at the right time.
DSRZ - shows the volume of interest at certain levels, and now we see that the first block of interest is concentrated in the $106,000–104,000 zone. These are the first support levels, from which I will expect the first rebound if the correction continues.
Liquidation Levels - as I said, all liquidity is now concentrated at the bottom. Bitcoin is very overheated and it's time to cool it down. Many think that it will be overheated when, as in the previous cycle, funding will be 0.2 and above.
But this is a different cycle, a different time, different traders, and different rules. This has already been proven more than once in this cycle.
📌 Conclusion:
I have said many times that we should not expect much from this momentum and that it is purely a technical rebound. And if something does not push us sharply upward now to bring in retail, we can definitely not expect it before the fall.
Summer is coming, investors and traders will close their positions and go on vacation. The market will be quiet.
So, personally, I am leaning back in my chair, expecting a price of at least $85,000, and watching what happens next. 🥃
NZDCHF BULLISH OR BEARISH DETAILED ANALYSIS ??NZDCHF is currently consolidating in a textbook bullish flag pattern after a sharp recovery from the recent lows near 0.4680. Price action is compressing just below a key supply zone around 0.4950–0.4980, signaling a potential breakout setup as momentum builds. This flag is forming after a clear impulse move, and with the structure respecting higher lows, I’m preparing for a bullish continuation toward the 0.5100–0.5150 target zone.
Fundamentally, the New Zealand dollar is gaining strength supported by the RBNZ's firm hold on tight monetary policy, as inflation remains sticky in services and housing. Governor Orr’s latest comments reaffirmed that the central bank is not ready to pivot until they see a clear disinflationary trend. On the other hand, the Swiss franc is showing signs of weakness, as the SNB remains one of the most dovish central banks in the G10 space, with real interest rates still negative and inflation pressures easing significantly.
Technically, we’re in a bullish structure with key demand holding strong at the 0.4840–0.4860 range. Price is now coiling just under resistance, and a clean breakout above the 0.4950 level could ignite the next impulsive leg toward 0.5100. If the breakout confirms with increased volume and market sentiment aligns, this setup presents a high probability long opportunity with a favorable R\:R.
NZDCHF remains on my radar as a breakout trade backed by both technical structure and macro fundamentals. With capital flows favoring the Kiwi and risk appetite rotating back into higher-yielding currencies, this pair offers a solid bullish continuation setup for the coming weeks. Stay patient, let the breakout confirm, and ride the momentum higher.

Btc october 2025 local top?#Bitcoin bull run is not over yet, there is a high probability that we will see a local top by October and also the possibility of the next local bottom in October 2026 is also in the plan.
CRYPTOCAP:BTC

Bitcoin - Waiting for a clear breakout!About an hour ago, Bitcoin (BTC) managed to fully fill the 1-hour Fair Value Gap (FVG). After touching the upper boundary of this gap, the price reacted sharply and quickly reversed, which resulted in the formation of a Swing Failure Pattern (SFP).
What is a SFP?
A Swing Failure Pattern, or SFP, occurs when the price briefly moves above a previous high but fails to sustain that move. In this scenario, the price only sweeps above the previous high with a wick, but the candle does not close above it. This often signals that buyers could not maintain control, and it can lead to a reversal or a loss of momentum.
Narrow range
Currently, BTC is trading within a narrow range between 106,600 and 110,600. Within this range, the price is moving up and down without breaking out in either direction. On the 1-hour chart, BTC respected the FVG a few hours ago, which suggests that bullish momentum might still have a chance to develop.
Bullish breakout
For a bullish breakout, we would want to see BTC break above 111,000 with strong buying momentum. If this happens, the price could turn the current resistance into new support and potentially make a move toward the all-time high (ATH).
Bearish breakout
On the other hand, a bearish breakout would require the price to close below 106,600 with significant volume. If BTC closes below this level, the support could turn into resistance, and a drop toward 100,000 would become a real possibility.
Conclusion
In my view, BTC showed strength by holding the 1-hour FVG, but after the latest move upward, it failed to break through resistance and instead formed a SFP. Because of this, I expect a pullback toward 108,000 or even 106,000. At this stage, it’s best to be patient and wait for a clear breakout in either direction before making any major trading decisions. If you want to protect your capital, it’s wise to wait for confirmation before entering a new position.
Thanks for your support.
- Make sure to follow me so you don't miss out on the next analysis!
- Drop a like and leave a comment!

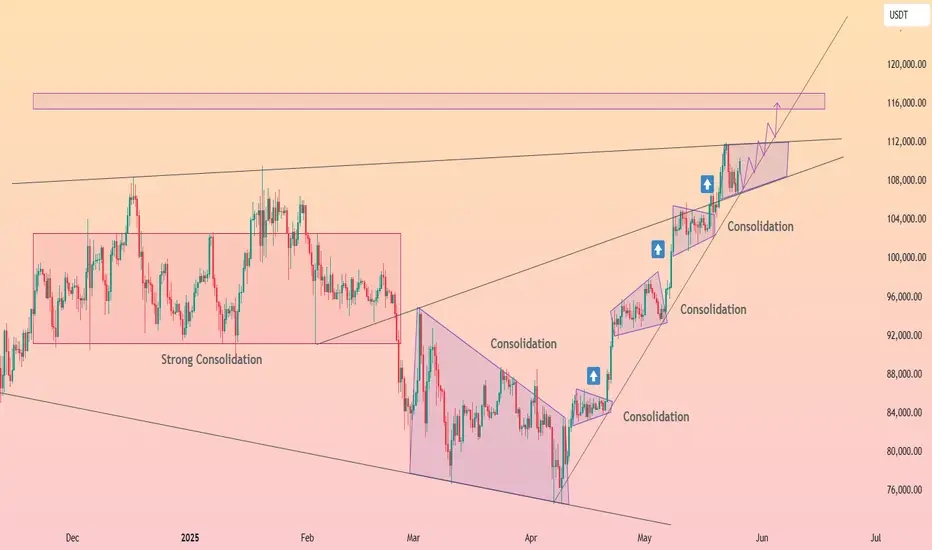
HolderStat┆BTCUSD stairway to New ATHCRYPTOCAP:BTC — Price action grinds up a steep ascending trendline, printing serial consolidation flags that keep bullish momentum intact. Holding 108-109 k support leaves room for a thrust toward the 115-118 k liquidity / new-ATH zone highlighted above. Breakout continuation, higher-highs narrative alive while the wedge floor protects the move.
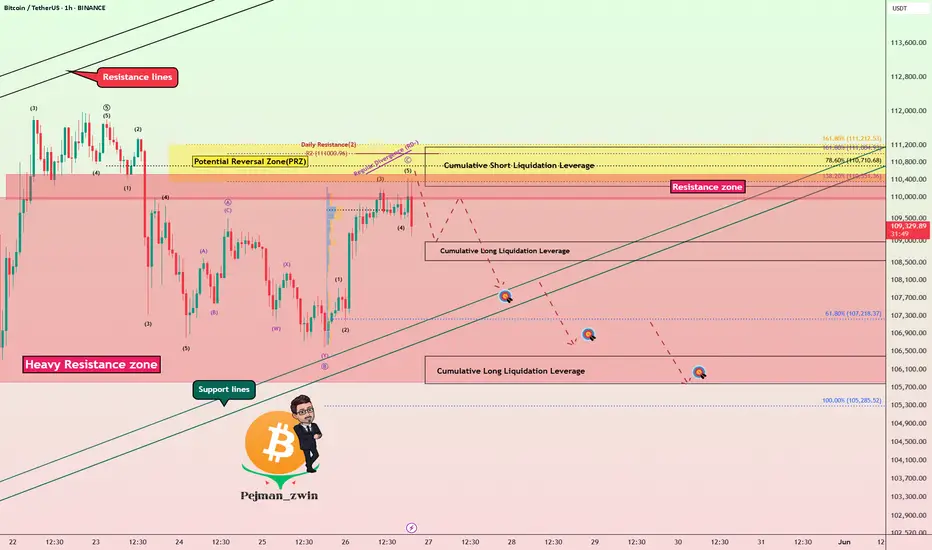
Bitcoin Bounce on Trump Tariff Delay – Short Setup Still Valid!Bitcoin ( BINANCE:BTCUSDT ) started to fall as I expected in the previous idea , and declined near the Support lines .
Bitcoin started pumping after the news that " US President Trump agreed to postpone 50% EU tariffs until July 9th ." Do you think this pumping of Bitcoin will continue?
Bitcoin is trading in a Heavy Resistance zone($110,000-$105,800) near the Potential Reversal Zone(PRZ) .
From the Elliott Wave theory perspective , Bitcoin appears to be in corrective waves , which is why I am labeling this idea as a ''Short''. The corrective waves structure is of the Expanding Flat(ABC/3-3-5) type.
I expect Bitcoin to attack the Support lines once again, and if these lines are broken, it will decline to the Targets I have indicated on the chart.
Notes :
MicroStrategy bought another 4,020 Bitcoins, but it didn't have much of an impact on the market.
If the Bitcoin price falls back below $109,000, about $185 million in long Bitcoin positions will be liquidated . = Attractive for exchanges
Bitcoin 2025 Conference to be Held in Las Vegas, Tuesday-Thursday = Could Cause Market Excitement .
Note: If Bitcoin touches $112,080, we should expect more pumping.
Please respect each other's ideas and express them politely if you agree or disagree.
Bitcoin Analyze (BTCUSDT), 1-hour time frame.
Be sure to follow the updated ideas.
Do not forget to put a Stop loss for your positions (For every position you want to open).
Please follow your strategy and updates; this is just my Idea, and I will gladly see your ideas in this post.
Please do not forget the ✅' like '✅ button 🙏😊 & Share it with your friends; thanks, and Trade safe.
GBPUSD BULLISH OR BEARISH DETAILED ANALYSISGBPUSD has played out exactly as forecasted, completing a clean bullish leg from the Fibonacci confluence zones and breaking through the key 1.3430 resistance level. The structure remains strongly bullish, and after this minor retest, I’m anticipating another impulsive wave to the upside, with the next target sitting firmly at the 1.3900 level. The pair continues to respect both structure and momentum, showing consistent demand on dips.
Fundamentally, the British pound continues to gain strength backed by sticky inflation data and hawkish tone from the Bank of England. With UK CPI remaining elevated and core services inflation running hot, the BoE is being forced to hold its tightening bias. This contrasts sharply with the Federal Reserve, where recent data shows signs of softening labor markets and cooling price pressure, bringing rate cut expectations back on the table for the second half of 2025.
Technically, GBPUSD has cleanly respected all key fib levels from the previous correction. The breakout above 1.3430 has flipped structure into bullish continuation, and the market has already begun forming higher highs and higher lows on both daily and 4H timeframes. As long as price holds above the 1.3430–1.3450 retest zone, the bullish outlook remains intact with high-probability momentum toward 1.3900.
In current market sentiment, GBPUSD remains one of the strongest trending pairs, with institutions adding to long exposure as the dollar index weakens. As a professional trader, I remain long-biased and look to scale in on lower timeframe retracements. This is a textbook continuation play backed by both technicals and macro momentum. Let the trend work—bulls remain in full control.

BTC Crypto Futures Trade Plan 2025-05-26BTC Crypto Analysis Summary (2025-05-26)
Comprehensive Summary of Each Model
Grok/xAI Report
BTC at $109,553, trading above all major MAs (20/50/200 SMAs, 9/21 EMAs) → strong bullish trend RSI 67.02 (approaching overbought), MACD positive but slight bearish divergence Volume declining → possible consolidation or reduced buying interest Funding rate low (0.0002%) → not overleveraged long Trade suggested: long at $110,000, SL $107,000, TP1 $113,000, TP2 $115,000, size 1% equity, confidence 80%
Claude/Anthropic Report
Confirms price above all key MAs, RSI approaching overbought, MACD divergence Price near upper Bollinger Band → resistance Concludes short-term momentum weakening → moderately bearish bias Recommends no trade (confidence 72%), waits for break above $111,800 or below $105,000
Llama/Meta Report
Bullish MA alignment, RSI slightly overbought, price near upper BB Funding rate neutral, sentiment generally positive Trade suggested: long on pullback to SMA20 at $105,295.59, SL $103,000, TP $110,000, size = 2–3% equity, confidence 80%
Gemini/Google Report
Strong bullish trend (EMA9 > EMA21 > SMA20 > SMA50 > SMA200), RSI 67, BB upper ~$111,724 MACD bearish crossover → potential short-term pullback Recommends long at ~$109,550, SL $107,700, TP $113,100, size 1 BTC, confidence 75%
DeepSeek Report
Price near upper Bollinger Band, MACD bearish crossover, RSI divergence Countertrend short trade: entry $109,553, SL $111,725, TP $105,295, size 1 BTC, confidence 75% Areas of Agreement and Disagreement
Agreement
BTC is in a strong uptrend, trading above all major moving averages RSI ~67 suggests rising momentum but nearing overbought MACD shows a bearish divergence or crossover, warning of short-term momentum loss Price is close to the upper Bollinger Band → stretched conditions
Disagreement
Directional bias: Grok, Llama, and Gemini bullish; Claude is cautious/no-trade; DeepSeek bearish countertrend Entry levels: ranges from pullbacks to 105k (Llama) to market price ~109.55k (Gemini/Grok) Risk appetite: varying leverage and position-sizing recommendations Trade/no-trade: Claude advises holding; others recommend active positions Conclusion and Trade Recommendation
Overall Market Direction Consensus
Moderately Bullish: the dominant trend is up, supported by MA structure and recent performance, despite short-term momentum warnings.
Recommended Trade
Direction: Long BTC futures Entry Range: Near current market (109,500–109,600) or immediate retest of EMA9 (~109,550) Stop Loss: 107,700 (below EMA9 and minor support) Take Profit: 113,100 (just above recent swing highs/upper BB) Position Size: 1 BTC (adjust per account to risk ~1–2%) Confidence Level: 78%
Key Risks and Considerations
Momentum Divergence: MACD bearish crossover and RSI near overbought may trigger a pullback Volatility Spikes: leverage can amplify slippage and liquidation risk Broader Crypto Moves: altcoin correlation or market-wide news can quickly shift prices Funding Rate Shifts: a sudden spike could accelerate long-side liquidations
TRADE_DETAILS (JSON Format) { "instrument": "BTC", "direction": "long", "entry_price": 109550.0, "stop_loss": 107700.0, "take_profit": 113100.0, "size": 1, "confidence": 0.78, "entry_timing": "market_open" }
📊 TRADE DETAILS 📊 🎯 Instrument: BTC 📈 Direction: LONG 💰 Entry Price: 109550.0 🛑 Stop Loss: 107700.0 🎯 Take Profit: 113100.0 📊 Size: 1 💪 Confidence: 78% ⏰ Entry Timing: market_open
Disclaimer: This newsletter is not trading or investment advice but for general informational purposes only. This newsletter represents my personal opinions based on proprietary research which I am sharing publicly as my personal blog. Futures, stocks, and options trading of any kind involves a lot of risk. No guarantee of any profit whatsoever is made. In fact, you may lose everything you have. So be very careful. I guarantee no profit whatsoever, You assume the entire cost and risk of any trading or investing activities you choose to undertake. You are solely responsible for making your own investment decisions. Owners/authors of this newsletter, its representatives, its principals, its moderators, and its members, are NOT registered as securities broker-dealers or investment advisors either with the U.S. Securities and Exchange Commission, CFTC, or with any other securities/regulatory authority. Consult with a registered investment advisor, broker-dealer, and/or financial advisor. By reading and using this newsletter or any of my publications, you are agreeing to these terms. Any screenshots used here are courtesy of TradingView. I am just an end user with no affiliations with them. Information and quotes shared in this blog can be 100% wrong. Markets are risky and can go to 0 at any time. Furthermore, you will not share or copy any content in this blog as it is the authors' IP. By reading this blog, you accept these terms of conditions and acknowledge I am sharing this blog as my personal trading journal, nothing more.

Bitcoin's Market Cycles — Are We Nearing the Top?Bitcoin is approaching a critical moment and the signs are everywhere.
After more than 900 days of steady bull market growth, BTC now flirts with all-time highs (ATH) while momentum stalls, liquidity thins, and emotions run hot. You might be asking:
Are we nearing the cycle top?
Is now the time to de-risk or double down?
What comes next?
This isn’t just a question of price. It’s about timing, structure, and psychology.
In this analysis, we’ll break down Bitcoin’s historical cycles, the current macro structure, the hidden signals from Fibonacci time extensions, and how to think like a professional when the crowd is chasing FOMO.
Let’s dive in.
📚 Educational Insight: Understanding Bitcoin Cycles
Bitcoin doesn’t move in straight lines, it moves in cycles.
Bull markets grow slowly, then explode. Bear markets fall fast, then grind sideways. These rhythms are driven by halving events, liquidity expansions, and most importantly: human emotion.
Here’s what history tells us:
Historical Bull Markets:
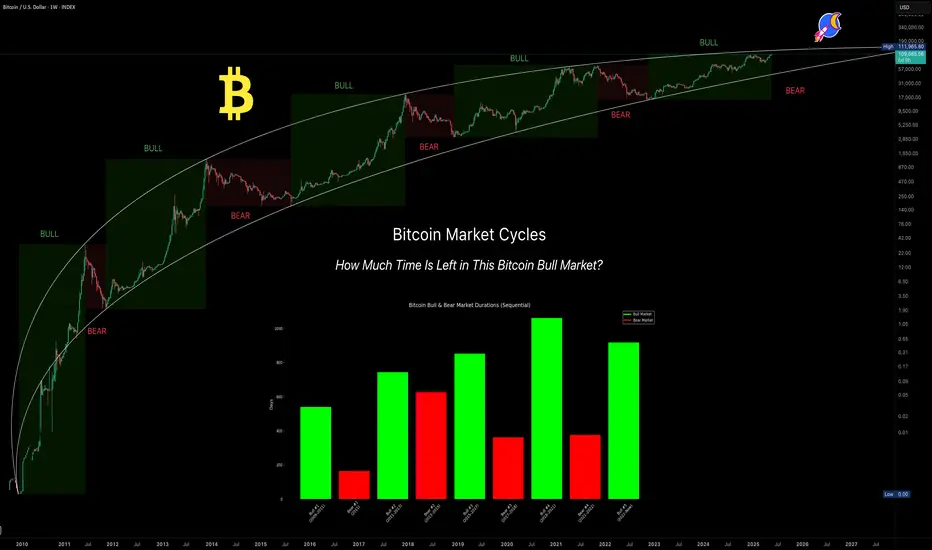
2009–2011: 540 days (+5,189,598%)
2011–2013: 743 days (+62,086%)
2015–2017: 852 days (+12,125%)
2018–2021: 1061 days (+2,108%)
2022–Present: 917 days so far (+623%)
Bear Market Durations:
2011: 164 days (-93.73%)
2013–2015: 627 days (-86.96%)
2017–2018: 362 days (-84.22%)
2021–2022: 376 days (-77.57%)
💡 What does this tell us?
Bull markets are growing longer, while bear markets have remained consistently brutal. The current cycle has already surpassed the average bull run length of 885 days (cycles #2–#4) and is quickly approaching the 957-day average of the two most recent cycles (#3 and #4). That makes this the second-longest bull market in Bitcoin’s history.
⏳ 1:1 Fibonacci Time Extension — The Hidden Timing Signal
In time-based Fibonacci analysis, the 1.0 (1:1) extension means one simple thing: this cycle has now lasted the same amount of time as previous cycles — a perfect time symmetry.
Here’s how I measured it:
Average bull market length #2–#4(2011–2021): 885 days
Average bull market length #3–#4(2015–2021): 957 days
Today’s date: May 27, 2025 = Day 917
✅ Result: We are well inside the time window where Bitcoin historically tops out.
You don’t need to be a fortune teller to see that this is a zone of caution. Markets peak on euphoria, not logic and this timing confluence is a red flag worth watching.
🗓️ "Sell in May and Go Away" — Not Just a Meme
One of the oldest market adages is showing its teeth again.
Risk assets — including Bitcoin — tend to underperform in the summer months. Why?
Lower liquidity
Institutional rebalancing
Exhaustion from prior run-ups
Vacations and reduced trading volumes
And here we are:
Bitcoin is hovering near ATH
It's been in an uptrend for 917 days
We just entered the time-extension top zone
Liquidity is thinning across the board
You don’t need to panic. But you do need to think like a professional: secure profits, reduce exposure, and wait for structure.
😬 FOMO Is a Portfolio Killer
This is where most traders make their worst decisions.
FOMO (Fear of Missing Out) isn’t just a meme — it’s the reason so many people buy tops and sell bottoms.
Before entering any trade right now, ask yourself:
Where were you at $20K?
Did you have a plan?
Or are you reacting to headlines?
📌 Clear mind > urgent clicks
📌 Patience > chasing green candles
📌 Strategy > emotion
Let the herd FOMO in. You protect your capital.
Will This Bear Market Be Different?
Every past cycle saw BTC retrace between 77%–94%. That was then. But this time feels… different.
Here’s why:
Institutions are here — ETF flows, sovereign wealth funds, and major asset managers
Regulation is clearer — and risk capital feels safer deploying in crypto
Supply is tighter — much of BTC is now held off exchanges and in cold storage
While a massive crash like -80% is less likely, that doesn’t mean a correction isn’t coming. Even a 30%–40% drop from here would wreak havoc on overleveraged traders.
And that brings us to…
🚨 Altseason? Or Alt-bloodbath?
Here’s the hard truth:
If BTC corrects, altcoins will crash — not rally.
Most altcoins have already seen strong rallies from their cycle lows. But if BTC drops 30%, many alts could tumble 50–80%.
Altseason only happens when BTC cools off and ranges — not when it dumps. Don’t get caught holding the bag. Be tactical. Be disciplined.
So Where’s the Next Big Level?
You may be wondering: “If this is the top… where do we fall to?”
Let’s just say there’s a very important Fibonacci confluence aligning with several other key indicators. I’ll reveal it in my next analysis, so stay tuned.
🧭 What Should You Do Right Now? (Not Financial Advice)
✅ Up big? — Take some profits
✅ On the sidelines? — Wait for real setups
✅ Emotional? — Unplug, reassess
✅ Are you new to Trading? — study, learn (how to day trade) and prepare for the next cycle
The best trades come to the calm, not the impulsive.
💡 Final Words of Wisdom
Bitcoin rewards discipline. It punishes emotion.
Right now is not about catching the last 10% of upside — it’s about:
Watching structure for potential trend change
Measuring risk
Avoiding overexposure
Protecting what you’ve earned
📌 The edge isn’t in indicators. It’s in mindset. Stay prepared, stay sharp because in this market…
🔔 Remember: The market will always be there. Your capital won’t — unless you protect it.
The next big opportunity doesn’t go to the loudest.
It goes to the most ready.
_________________________________
Thanks for reading and following along! 🙏
Now the big question remains: Is a bear market just lurking around the corner?
What are your thoughts? Let me know in the comments. I’d love to hear your perspective.
_________________________________
If you found this helpful, leave a like and comment below! Got requests for the next technical analysis? Let me know.
26/05/25 Weekly OutlookLast weeks high: $111,965.73
Last weeks low: $101,994.78
Midpoint: $106,980.26
New BTC ATHs! Well done to those who capitalized on the move and continue to believe in this Bitcoin.
For the last two weekly outlooks I have talked about the pattern of consolidation for 1 week --> expansion the next. Last week We got our expansion week right on queue and this time around BTC made a new ATH hitting just shy of $112,000.
Should the pattern continue this week will be a week of consolidation/chop, however this week is different now that we're at ATH levels. My gut says a pullback is coming after such an aggressive move up with almost no pullbacks at all.
Should BTCs price drop below the Midpoint I think there will be a big struggle to continue this rally in the short term. Initially target would be weekly low and main HTF target would be $97,000 IMO. That would be a healthy pullback to continue the rally.
For the bulls you don't want momentum to stop in the short term, flipping $110,450 and weekly high would put BTC back into price discovery, once any asset is in price discovery it's very difficult to tell where the sell pressure will come from and so shorting becomes very risky.

BITCOIN $119k coming shortlyBitcoin (BTCUSD) has been trading within a 6-week Channel Up and Friday's tariff threats led pull-back was its latest Bearish Leg. That pull-back hit the 4H MA50 (blue trend-line) yesterday and rebounded. As long as the 4H MA100 (green trend-line) which is directly below the Channel Up holds, the current rebound is technically the pattern's new Bullish Leg.
All 4 previous Bullish Legs have ended on fairly similar % rises but the weakest has been +11.41%. With the 4H MACD just now completing a Bullish Cross (which has always been a strong buy signal), a repeat of the +11.41% minimum, gives us an immediate $119000 Target.
Do you think that's coming shortly before the beginning of June? Feel free to let us know in the comments section below!
-------------------------------------------------------------------------------
** Please LIKE 👍, FOLLOW ✅, SHARE 🙌 and COMMENT ✍ if you enjoy this idea! Also share your ideas and charts in the comments section below! This is best way to keep it relevant, support us, keep the content here free and allow the idea to reach as many people as possible. **
-------------------------------------------------------------------------------
💸💸💸💸💸💸
👇 👇 👇 👇 👇 👇

BTC (Y25. P2.E3).AB=CD scenarioHi traders,
In the past, ATH's have made consistent pullbacks soon after with 14%.
This time round I do expect the same, to shake out before we do new highs.
Macro wise, I still have the Cup and Handle targets.
Short term, this aligns well with my support levels.
For now, the VAL or neckline is likely to be resistance.
We had a obvious descending wedge breakout, its hit its target. and now we should range, consolidate here before price makes a decision.
For more updates, come to our forum.
All the best,
S.SAri

ETHUSDT at 2511: Breakout or Breakdown at 2550?Ethereum (ETHUSDT) is currently trading at 2511 on the 4-hour timeframe, sitting in a consolidation phase after a recent uptrend. Over the past few days, the price has shown resilience, bouncing off a key support level around 2400 and now testing a critical resistance at 2550. This 2550 level is a make-or-break point: a clean break above it could spark a bullish move toward 2700, while rejection here might send the price back to retest 2400. The broader market vibe is cautiously positive, with Ethereum’s upcoming upgrades generating some buzz, though regulatory uncertainties could weigh things down if negative headlines hit. Volume has been tapering off during this consolidation, which is normal, but keep an eye out, a breakout with strong volume will carry more weight.
From a technical standpoint, the 50-period moving average (MA) sits at 2450, and the 200-period MA is at 2300, with the price comfortably above both. That’s a solid bullish sign for now, but the 50-period MA is starting to flatten out, hinting that the upward steam might be cooling off. The Relative Strength Index (RSI) is at 60, right in the neutral zone, not overbought or oversold, so there’s room for the price to swing either way. Over on the MACD, the line is above the signal line, showing bullish momentum, but the histogram bars are shrinking, which could mean that momentum is losing some juice. Traders should watch for a breakout or a MACD crossover to get a clearer sense of what’s next.
There’s also a potential pattern taking shape: an ascending triangle, with the flat resistance at 2550 and a rising support line from 2400. This setup is typically bullish, but it’s not a done deal until we see a confirmed break above 2550. If that happens, especially with a volume spike, it’s a green light for bulls. On the flip side, if the price slips below 2400, it could signal a short-term bearish shift. For now, 2550 is the level to watch, it’s where the action will heat up. Whether you’re trading the breakout or the rejection, this is a spot to plan your moves carefully!

ETH cheaper than $1,500 already this SUMMER? Hi! While many are already predicting an alt-season and hundreds of X's, let's see if it's really so? 🤔
While bitcoin is updating ATH day by day. ETH is still trading almost 40% cheaper than its peak in this cycle . And on the low time frame it is already forming a double top pattern, signaling a downside risk in the near future.
With the current growth we have closed a small GAP at the level of 2,250 - 2,650. But there is still a GAP above us in the zone of 2,800 - 3,250. In addition, below us there is now a GAP formed in the range of 1,850 - 2,450. And as we know, 99% of GAPs tend to close sooner or later.
❓ But here's the question - which one will close sooner? Let's get to the bottom of it!
⚙️ Indicators and metrics:
MACD - has already given a bearish section, signaling a potential trend change.
Volume - since February 3, all further declines, the volume of ETH purchases has only declined, signaling a decline in interest in the asset. Even at 1400 and below, buying volumes were still disastrously low . Showing the lack of interest in the asset even at such prices.
VRVP - shows buying and selling volumes at price levels in relation to each other. It is noticeable that at the levels of 2,400 - 2,750 the trading volumes increase significantly , and in both directions. Showing that this level is still a strong resistance , and the mood in ETH is extremely speculative and few people are interested in it at 1,400, but at 2,500 it is good choice! 😁
📌 Conclusion:
In my opinion, this was a purely technical rebound for ETH after a long decline . As well as for the altcoin market as a whole. Those altcoins that were simply declining more rapidly than others are the ones that are growing fastest now.
Besides, I remind you that summer is coming soon and there will be less liquidity on the market. So unless the current market conditions push ETH to 3,000 and above . We can definitely not expect it in summer and the most probable scenario in my opinion is blue. I don't think we will see ETH at 1,500 and below (unless Trump does something weird), but it is possible to close GAP and go to 1,800.

Is BTC Poised for a Pullback or Continuation? Key Levels on 3D We’ve got a strong resistance level formed by the double top from Dec 14, 2024, and Jan 19, 2025.
✅ Price is above the 200MA, 50MA, and Bollinger Bands.
✅ MLR > SMA confirms the bullish momentum.
I don’t see any immediate reasons to panic. A pullback to the Bollinger Bands or even the 50MA could be in play, but the price action will depend heavily on macro conditions. 🌎
⚠️ If you're highly leveraged, consider risk management. Keep an eye on price action and stay cautious.
📈 Keep close, follow me for more insights, and thank you for reading! Stay safe. 🙏

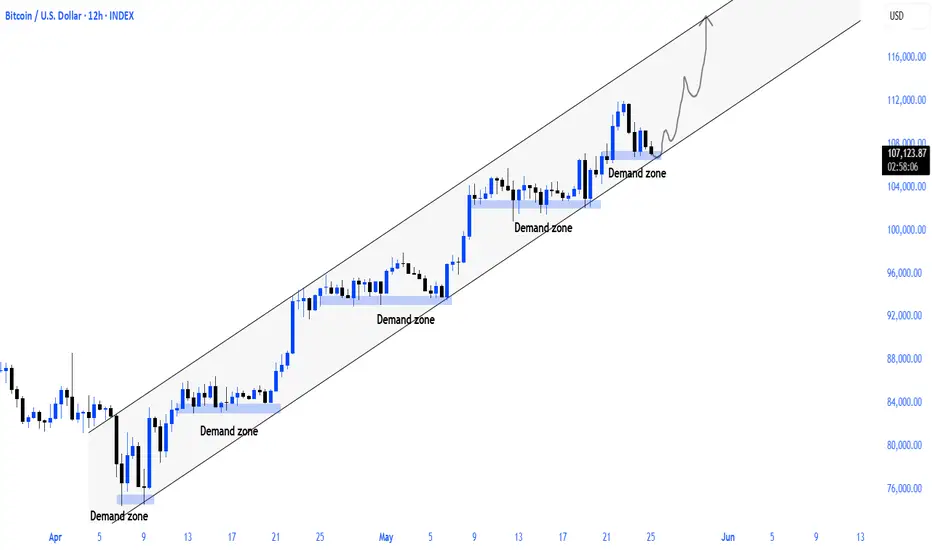
btc 12hbitcoin continues to maintain its rising trend support starting with 74k. i think it will start to move upward from the trend support equivalent to the current demand zone
Bitcoin Be Setting Bull Trap?_Breakout Without High VolumeBitcoin ( BINANCE:BTCUSDT ) started to fall yesterday after forming a new All-Time High(ATH) with high volume , but started to rise again. One of the reasons for Bitcoin’s sudden drop yesterday was the sharp drop in the S&P 500 ( SP:SPX ) index .
First of all, I must say that Bitcoin’s situation is a bit complicated and difficult to analyze , so pay more attention to money management. Be prepared for any scenario.
Bitcoin is trading above the Resistance zone($109,588-$105,820) and near the Resistance lines and Cumulative Short Liquidation Leverage($113,020-$111,833) . What is worrying is that the break of the Resistance zone($109,588-$105,820) was NOT accompanied by high volume , suggesting a bull trap is possible .
I see a correction to at least Cumulative Long Liquidation Leverage($109,972-$108,609) given the low breakout volume for Bitcoin and the large sell orders in the upper prices for Bitcoin .
--------------------------------------------
Today, the Flash PMI data from the U.S . came in stronger than expected:
Flash Manufacturing PMI: 52.3 (vs. forecast 49.9, previous 50.2)
Flash Services PMI: 52.3 (vs. forecast 51.0, previous 50.8)
Analysis :
Both numbers exceeded expectations, signaling stronger economic activity in the U.S. This is bullish for the USD( TVC:DXY ) and could put short-term downward pressure on Bitcoin, as it lowers the chances of near-term Fed rate cuts.
--------------------------------------------
Do you think Bitcoin is completing a Bull Trap or should we expect Bitcoin to increase further?
Note: If Bitcoin breaks above $114,500 with high momentum, we can expect Bitcoin to rise to near $119,000.
Please respect each other's ideas and express them politely if you agree or disagree.
Bitcoin Analyze (BTCUSDT), 1-hour time frame.
Be sure to follow the updated ideas.
Do not forget to put a Stop loss for your positions (For every position you want to open).
Please follow your strategy and updates; this is just my Idea, and I will gladly see your ideas in this post.
Please do not forget the ✅' like '✅ button 🙏😊 & Share it with your friends; thanks, and Trade safe.

BTC BULLISH SETUPBTCUSDT is looking for a reversal and to take the bullish trend extended towards the FVG formed on top. Under the lower timeframes we have a valid reversal indication identified.
