BTC -MACD Triggered the Breakout Early, MACD MasteryYou didn’t need 20 indicators. Just one system that actually worked.
The MACD Liquidity Tracker Strategy flipped long on BTC just before the latest 4H breakout — catching an 11.39% move with perfect histogram and EMA alignment.
🔍 Here’s what happened:
– Histogram flipped positive on July 23
– EMA filter cleared — clean long trigger
– Histogram rose into a momentum peak
– Strategy closed just before consolidation
This is exactly what the Liquidity Tracker was built for:
✅ Spot clean trend shifts
✅ Confirm strength via momentum
✅ Filter out noise using EMAs
⚙️ Settings Used:
– MACD: 25 Fast / 60 Slow / 220 Signal
– EMA Filter: 50 / 9 / 3
– Entry Mode: Histogram + Crossover Combo
BTC-D

Watching for intraday BTC bounce firstMorning folks,
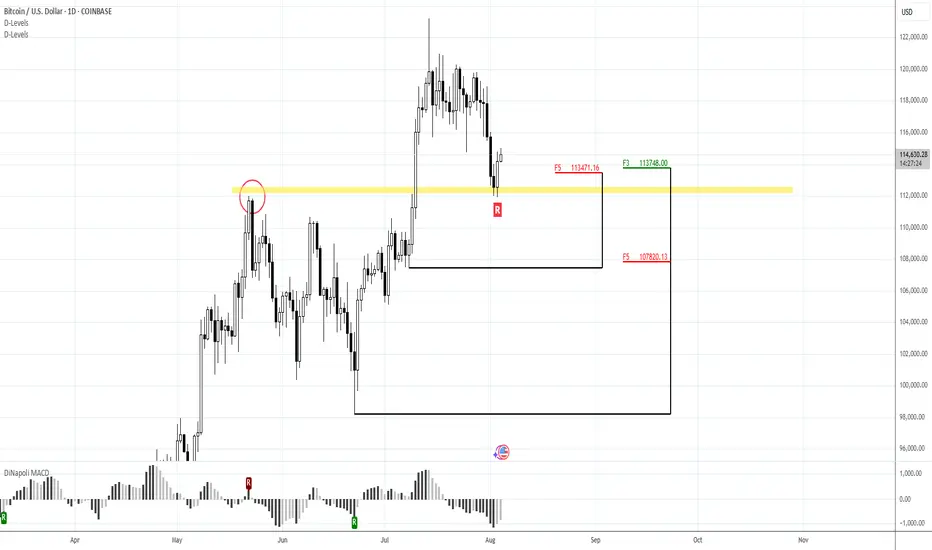
So, neither NFP data nor technical picture helped BTC to stay above 117. While US Treasury is started drain liquidity and borrow (they need 1 Trln this month), sending ~ 150 Bln to its TGA account with the Fed - BTC got hurt.
Now price stands at vital area - previous tops. If BTC will drop under 110K, collapse could start. Let's hope that this will not happen...
Meantime, we're at 112-113K support. We already talked about it before. Here we have reversal bar and bullish engulfing pattern, so maybe we could get a bit higher pullback on intraday chart. 113.8 and 113.1K support areas on 1H TF might be considered for long entry. Invalidation point for this plan is the low of engulfing pattern.
Bitcoin - Will Bitcoin reach its previous ATH?!Bitcoin is below the EMA50 and EMA200 on the four-hour timeframe and is in its short-term descending channel. In case of an upward correction, Bitcoin can be sold from the specified supply zone, which is also at the intersection of the ceiling of the descending channel.
It should be noted that there is a possibility of heavy fluctuations and shadows due to the movement of whales in the market and compliance with capital management in the cryptocurrency market will be more important. If the downward trend continues, we can buy in the demand range.
In recent days, Bitcoin has stabilized below the $120,000 mark, a development that reflects increasing structural maturity in the market and strong institutional capital inflows. Unlike in previous cycles, where price rallies were largely driven by retail hype, the current liquidity flows are channeled through regulated and professional instruments like ETFs. During the month of July alone, Bitcoin ETFs attracted over $6 billion in inflows, marking the third-highest monthly inflow in their history. Leading this trend were BlackRock’s IBIT and Fidelity’s FBTC, which together recorded more than $1.2 billion in net inflows within a single week. This signals a shift in trust from traditional investors toward crypto markets—within transparent, traceable, and regulated frameworks.
On-chain metrics further validate this shift. The MVRV ratio, which compares market value to realized value, is currently fluctuating between 2.2 and 2.34. These levels do not indicate profit-taking extremes nor fear of major corrections, but instead point to a healthy and rationally profitable market. Meanwhile, the supply of Bitcoin held in non-exchange wallets is rising, while exchange-held balances have dropped to their lowest levels in a decade, now accounting for just 1.25% of total supply. This trend implies reduced short-term selling pressure, as coins transition from liquid to long-term holdings.
Trader behavior is also evolving. Unlike previous bull runs, profit-taking remains controlled. The SOPR index, which measures realized profit relative to purchase price, has not yet reached saturation levels. This suggests that current holders are not satisfied with existing gains and are anticipating higher price levels. Furthermore, metrics like daily active addresses remain stable, indicating a lack of speculative retail influx. The network’s current dynamics resemble those of mature traditional markets, where investment decisions are guided by analysis, discipline, and long-term perspective.
Analysts at major financial institutions believe that if this trend continues, Bitcoin could reach targets of $180,000 to $200,000 by year-end. A more conservative scenario places the $95,000 to $100,000 range as a strong support zone—especially if political, regulatory, or macroeconomic pressures intensify. Overall, the convergence of institutional capital, rational trader behavior, stable on-chain conditions, and regulatory clarity has transformed Bitcoin into a more structured and dependable asset than ever before.
Ultimately, Bitcoin is no longer just a speculative tool. It has secured its role as a legitimate asset within the portfolios of global financial institutions. Even if the pace of capital inflow is slower than in previous cycles, the underlying structure is more robust and sustainable—offering a clearer path toward broader global adoption and higher valuation.
Nonetheless, recent data from CryptoQuant suggests that long-term Bitcoin holders (LTHs) have begun net selling near the $120,000 resistance zone—a psychologically significant level in Bitcoin’s price history. Analysts interpret this as a potential sign that veteran investors—those who entered during earlier market cycles—are now realizing profits as prices reach historic highs. If short-term holders follow suit, this shift could amplify selling pressure and trigger heightened price volatility.

BTC/USDTPossible AMD setup forming. Entry only after clear confirmation.
If validated, the target is a move toward new ATHs.
However, if downside pressure continues, we could see a correction below the $110K level.
Stay reactive — not predictive.

BTC rally starts / 241.000$Bitcoin is entering the last bullish rally before bear market. I want to see new phase of euphoria on crypto and altcoins also and overbought on RSI indicator

BTC/USD 1D Chart 🔼 Resistance:
• USD 123,263 - local peak, strong resistance (green line)
• USD 119,120 - level tested several times, recent reflection
• 116,224 USD - zone of previous consolidations
🔽 support:
• 110,945 USD - SMA #2 (movable average), tested in the past
• 107,804 USD - local hole
• USD 103,542 - strong support from the past (historical retention of declines)
⸻
📊 Technical indicators
📉 Trend:
• The yellow upward trend line has been broken - a potential bull weakness signal.
• The candle pierces the trend line from the bottom - it is possible to change the direction to a side or downward trend.
📈 Medium walking (SMA):
• The red SMA #1 line acted as dynamic resistance.
• The price is currently testing SMA #2 as support.
• SMA #5 (blue, approx. 98,600 USD) is very strong long -term support.
📉 Macd:
• The MacD line is below the signal line → Bear signal (Bearish).
• Red histogram - inheritance impetus is growing.
📉 RSI:
• RSI has fallen below the level of 50 → the advantage of supply.
• Currently, it is approaching the supply of supply overload (<30), which can herald the technical reflection.
⸻
🔮 Scenarios
✅ Scenario Bycza (Bullish):
• Maintenance of a price above 110.945 USD (SMA #2).
• Return above the trend line or testing USD 116,224 and piercing up.
❌ Bear scenario (Bearish):
• Loss of support to 110.945 USD → decrease to USD 107,800.
• If this does not keep the course, the next strong level is USD 103,500.
⸻
🧠 Applications:
• Short -term: the market looks weak, the candle breaks the upward trend.
• Medium -term: still in the game, but if it does not reflect from the current levels, a greater correction is possible.
• Commercial decisions: It is worth waiting for confirmation of the direction (reflection from support or continuation of declines).

BITCOIN LONG FROM SUPPORT|
✅BITCOIN has retested a key support level of 112k
And as the coin is already making a bullish rebound
A move up to retest the supply level above at 115k is likely
LONG🚀
✅Like and subscribe to never miss a new idea!✅
Disclosure: I am part of Trade Nation's Influencer program and receive a monthly fee for using their TradingView charts in my analysis.

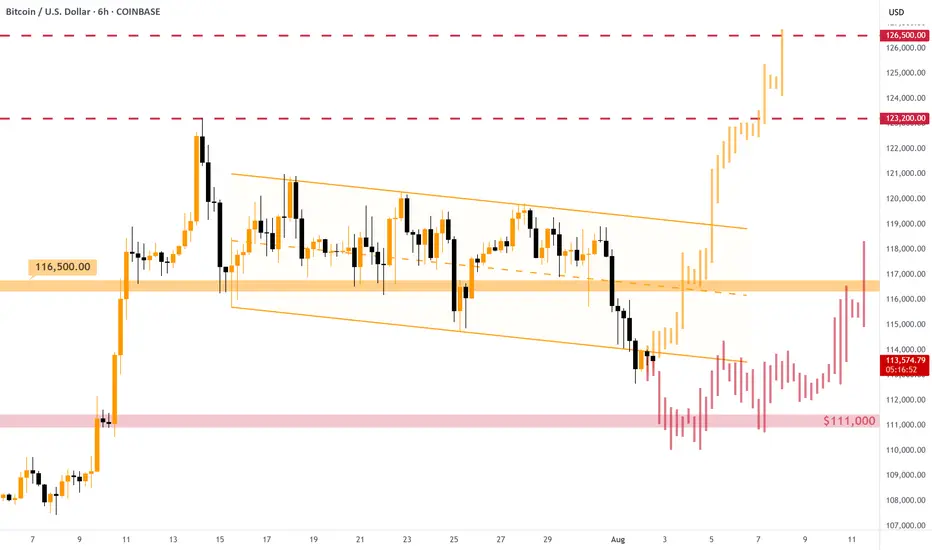
#BITCOIN - Short-Term Options [EXPLAINED]As expected, the price dumped below the descending channel , currently consolidating right below one's support level.
As expected, the price dumped below the descending channel , currently consolidating right below one's support level. On the chart I've described two possible options for the price movement: strictly positive and hmm.. okey.
Strictly positive: some consolidation below the support with, then quick retrace back inside the channel and new upward rally on the next working week. Entering LONG position will make sense after the breakout of the $116,500 resistance, not earlier.
Hmm.. okey: Bitcoin is not strong enough to come back inside the channel and dumps to $111,000 support level. Near this level we must see some consolidation to gather more power. Possible fakes down to $108,000. In some time (1 week+) we will have chances of going back up.
👉 Overall, the support of $111,000 is crucial right now. If we lose it, Bitcoin goes towards $100,000 and the current bullish phase might be considered as finished. For now we still have chances.
Could this be the end of Bitcoin’s trend?The Current State of Bitcoin’s Trend: Has the Uptrend Come to an End...?
Based on recent analyses, Bitcoin has exited its 4-hour channel over the past few days, and there is still a possibility for further correction. However, this does not mean that the uptrend for Bitcoin is over.
My targets for Bitcoin remain the same as before: 123,700 and 129,710. It’s even possible that we might see a wick above these prices.
For those with more capital who are looking to buy Bitcoin, there are two good entry levels:
110,880
109,770
Everything else is clearly shown on the chart. Please be cautious, as there will likely be high volatility once the market opens.
Be sure to open the analysis link and boost the analysis with your likes.

SOLANA $250 INCOMING? or $150 again?We can see a wedge is forming, price is at a major point, break above with a failed break below the resistance - we see high potential for $250.
Failed breakthroughs and a rejection? We see $150 once more.
Thoughts?

BTCUSDT 1D – Retesting Key Support, Will Bulls Hold the Line?Bitcoin is retesting a crucial structural support level around $112K after its recent local top near $120K. This zone previously acted as resistance and is now being tested as support — a textbook bullish continuation signal if it holds.
Historically, these flips (from resistance to support) have triggered strong upside momentum, as seen after the $78K breakout earlier this cycle. However, failure to hold this level could open the door for a deeper correction toward $100K or even the $90K region.
This chart outlines the major structural zones:
Long-term accumulation base near $70–78K
Resistance flip zone at $110–112K
Local resistance near $120K
📌 If bulls defend this zone and reclaim momentum, we could see another push toward cycle highs. If not, patience is key — the next high-conviction entry may come lower.
How are you positioning around this zone? Let me know in the comments 👇

BITCOIN: THE PERFECT STORM - MULTIPLE BREAKOUT PATTERNS ALIGNED⚠️ CRITICAL SUPPORT LEVELS
🛡️ Support 1: $115,000 (-3%) - Triangle support
🛡️ Support 2: $110,000 (-7%) - Channel support
🔴 DANGER ZONE: $105,000 (-11%) - Multiple pattern failure
So...
Strategy: Quick profits on pattern completion 🎨
Entry: $115k (Triangle breakout confirmation) 📊
Stop Loss: $114k below (Tight risk management) ❌
Target: $125k (+10%) ✅
Time Horizon: 2-3 weeks 📅
Risk/Reward: 1:6 🎯
________________ NOTE _____________
⚠️ This is not financial advice. Bitcoin is highly volatile and risky. Only invest what you can afford to lose completely. Always do your own research and manage risk appropriately 🚨
others \ btcOthers bitcoin pair has found support from the rising trend line since 2016 2017 and continues to recover

Bitcoin fixed above the $112k ┆ HolderStatOKX:BTCUSDT is recovering after touching the $111,940 zone, now confirmed as strong support. The price is reversing from the lower wedge boundary, suggesting renewed momentum. A clean push could retarget $122,250 in coming sessions.

Bear trap on its way - Bitcoin Weekly Update August 4-10thThis week brings a series of macroeconomic and geopolitical developments that may influence global risk sentiment and, consequently, Bitcoin’s price trajectory.
On Monday, the U.S. releases Factory Orders, a key indicator of industrial demand. Surprises in this data can affect risk assets broadly, as they reflect business investment activity. Weak numbers would likely increase expectations of monetary easing, which tends to support Bitcoin.
On Tuesday, the spotlight turns to the ISM Non-Manufacturing PMI, a leading indicator for the U.S. services sector, which accounts for roughly 70% of GDP. A significant deviation from expectations—especially a decline—could reinforce rate-cut expectations and provide tailwinds for speculative assets like Bitcoin.
Thursday is a critical day, with the Bank of England's interest rate decision in focus. While direct effects on crypto are limited, a hawkish stance could weigh on global risk appetite if inflation concerns resurface. Also on Thursday, the U.S. releases its weekly Initial Jobless Claims—a timely barometer of labor market strength. A rising trend here would suggest economic cooling, strengthening the case for looser policy and potentially benefiting crypto.
However, the most geopolitically sensitive event this week is the reintroduction of country-specific reciprocal tariffs by the United States, taking effect on August 7. Affected countries include Canada (35%), Mexico (30%), and Brazil (50%). These measures could re-escalate trade tensions and trigger short-term market volatility. Retaliatory responses from these countries would likely fuel risk-off sentiment, pressuring assets across the board.
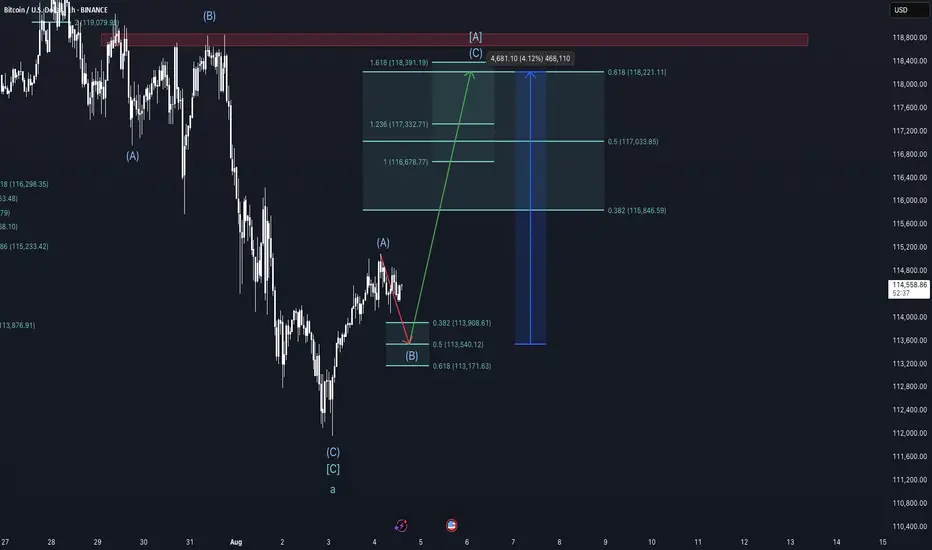
From a technical standpoint, Bitcoin remains within a multi-degree corrective structure according to the Elliott Wave framework. On the cycle degree, we are in a B-wave; on the primary degree, in an A-wave; on the intermediate degree, in a B-wave; and on the minor degree, in a C-wave. This implies that a short-term move lower is still expected, but once complete, a relief rally of approximately 4% could follow before the onset of a larger correction, likely Primary Wave B.
Chart structure suggests that Minor Wave C is in its late stages. Early signs of exhaustion, such as waning downside momentum or bullish reaction at key support zones, could offer clues of an approaching bottom. However, such a rebound should be viewed as temporary and not a trend reversal.
Taking a view between the lines on the on-chain data, the liquidity heatmap shows major liquidity around the red rectangle drawn into the chart, suggesting higher prices. Also, the rather low funding rate on futures suggest an exhausted downward trend and a trend reversal in the near future is likely.
Conclusion:
This week’s calendar offers several macroeconomic catalysts with the potential to move markets. U.S. economic data and tariff policy developments will likely shape near-term sentiment. Technically, Bitcoin remains in a corrective phase with limited downside left before a short-term recovery becomes more probable. Traders should stay alert for signs of a local bottom to position for a tactical bounce—but be cautious, as a larger correction likely looms beyond that.
This is no financial advice and for educational purposes only.
04/08/25 Weekly OutlookLast weeks high: $119,809.82
Last weeks low: $111,917.76
Midpoint: $115,863.79
First net outflow for BTC in seven weeks (-$643m) following the FOMC data release and also month end. Yet again no change by the FED but the chances of Septembers FOMC giving us a rate cut has drastically increased, currently at a 78.5% chance of a 25Bps cut.
Month end usually gives us a pullback/sell-off as larger institutions window dress which often includes de-risking somewhat. We saw this last Thursday combined with the weekends typical lower volume has resulted in quite a significant correction for BTC. Altcoins have down the same as many assets reject from HTF resistance areas, the correction has been on the cards and isn't too worrying on the face of it.
What I would say is August seasonality is generally not a bullish month and so expecting price to rebound and extend the rally would go against historical trends. I could see more of a ranging environment taking place for several weeks before any next leg up is possible.
This week I would like to see where altcoins find support and establish a trading range where some rotational setups tend to present themselves.

$BTC Breaking Down. Price bleeds, conviction doesn’t.Price bleeds, conviction doesn’t.
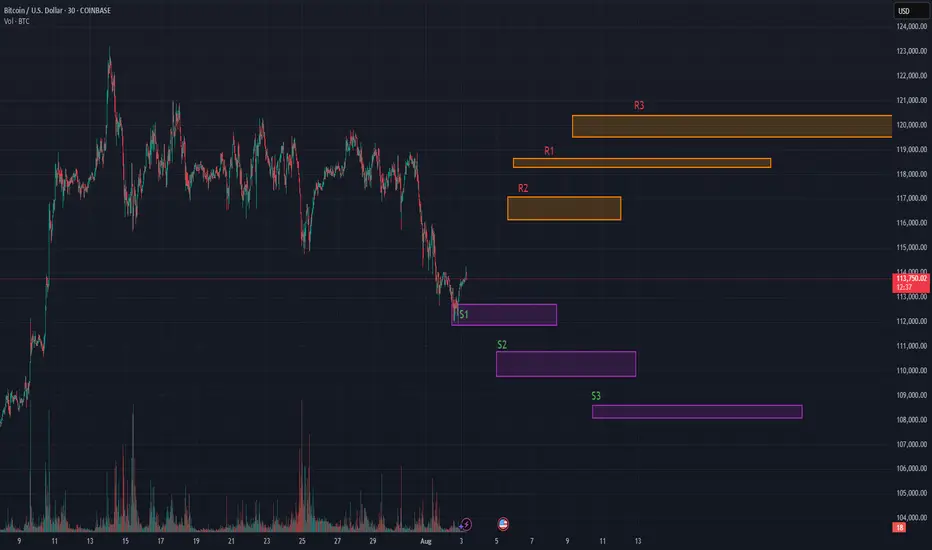
This was originally posted previously <24hrs but was hidden due to a link. Here is the pic of the original so you can see S1 bounced perfectly, lets see how much momentum we can get.
OG Thread continued..
Is this the dip worth buying?
BTC is retesting key quant support zones after a high-volume rejection near $116K. Despite the short-term dip, structure remains bullish from a mid-term lens.
• Quant Support Levels
• S1: $112,412
• S2: $110,935
• S3: $108,711
• Resistance Levels:
• R1: $116,113
• R2: $118,337
• R3: $119,814
On chain metrics:
• On-chain data confirms short-term holder capitulation into high-ownership clusters at $112K–$110K.
• Volatility contraction suggests a base-building phase, not a breakdown.
• Cup-and-handle formation remains valid on higher timeframes.
• Institutional Context:
• Accumulation increasing below $115K.
• Analysts projecting breakout potential to $129K–$133K if BTC can reclaim the $116.1K pivot.
Quant traders are eyeing this pullback as a healthy setup — not a breakdown.
I believe these are perfect accumulation levels anywhere in the blue square should be fine for a play to the upside.
Want Quant levels? Let me know!
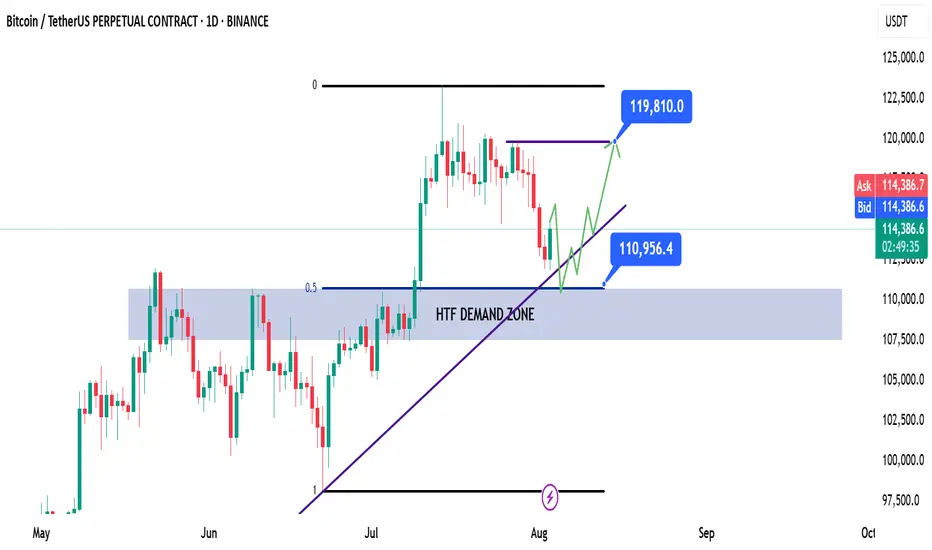
BTC | Bitcoin - Weekly Recap & Gameplan - 03/08/25📈 Market Context:
Traders are currently anticipating a potential 0.25% rate cut at the September FOMC meeting, which continues to support the broader bullish outlook.
While the market pulled back following weaker-than-expected Non-Farm Payroll data, overall sentiment remains optimistic.
Greed has cooled off into a more neutral stance. Historically, August often brings some consolidation or pullbacks — but the structural bias for Bitcoin remains bullish.
🧾 Weekly Recap:
• After printing new all-time highs, BTC began a healthy retracement.
• Price action closely mirrored the Nasdaq's (NQ) pullback during the week.
• We saw a small bounce mid-week, but no strong reversal confirmation yet.
📌 Technical Outlook & Game Plan:
→ I’m watching for price to revisit the long-term bullish trendline.
→ A slight deviation into the HTF demand zone would be ideal for long entries.
→ Bonus confluence: This area also aligns with the 0.5 Fibonacci retracement (Equilibrium level), providing a key discount zone.
🎯 Setup Trigger:
I’ll be watching for a confirmed bullish break of structure (BOS) on the 1H–4H timeframes to signal a reversal.
On confirmation, I’ll look to enter a swing long position.
📋 Trade Management:
• Stoploss: Below the 1H–4H demand swing low
• Take Profit:
→ I’ll trail stops and lock in profits aggressively
→ Main target: $119,820
💬 Like, follow, and comment if this breakdown supports your trading! More setups and market insights coming soon — stay connected!
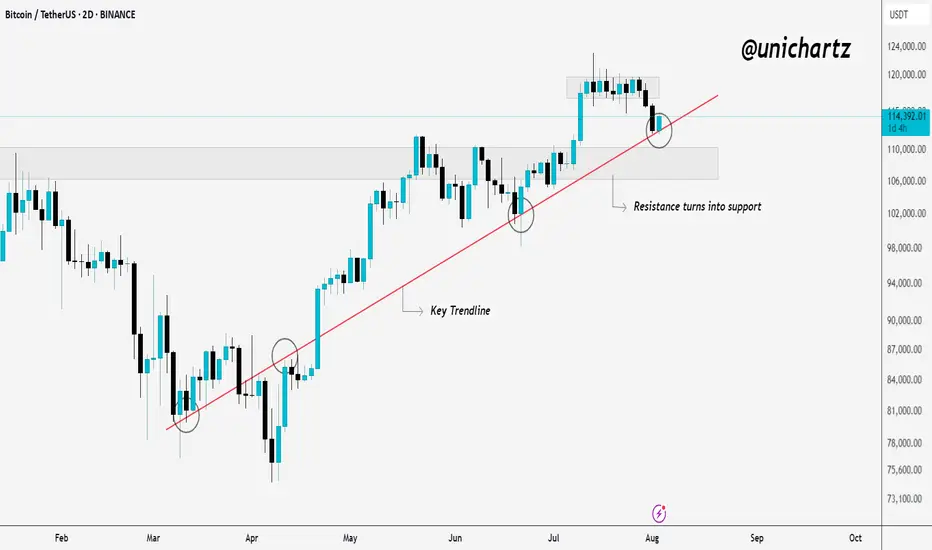
Smart Money Watching This Line — Are You?Bitcoin is holding strong above a key trendline that has acted as dynamic support since March. Every time price touched this line, buyers stepped in, and once again, it’s doing its job.
What was once resistance has now flipped into solid support. The recent pullback seems healthy, and the price is trying to bounce from the trendline area again.
As long as CRYPTOCAP:BTC respects this structure, the bullish momentum remains intact. If it holds, we could see another leg up from here.
DYOR, NFA
Thanks for reading!
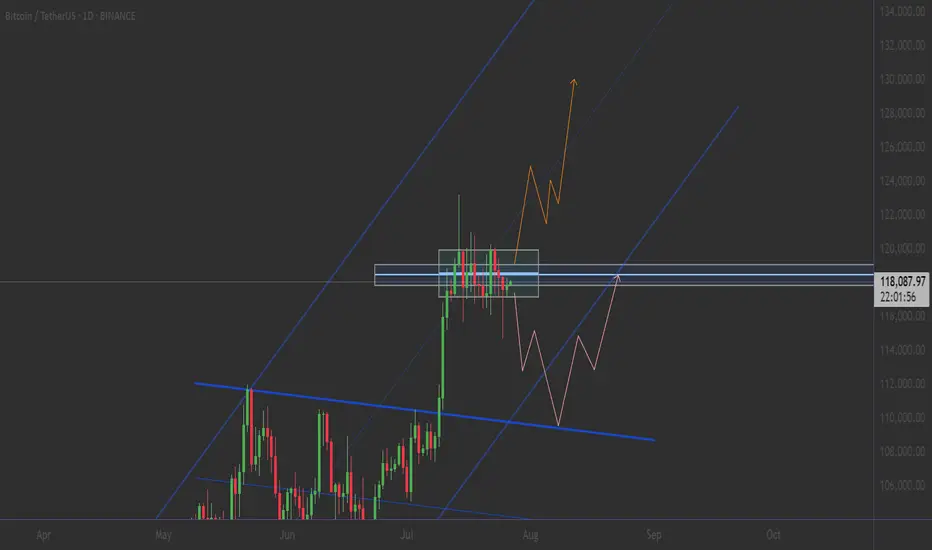
My bullish view on BTCIf we break upwards in this channel we will see 134k and/or 140k depending on the resistance on the trend lines!

Seven topics explaining why Ethereum might be heading towards atSeven topics explaining why Ethereum might be heading towards at least $4,500 after returning to its trend:
1. Market Sentiment and Bullish Reversal
When Ethereum breaks out of a consolidation phase or a downtrend, it often signals a shift in market psychology. A bullish reversal can be triggered by technical patterns such as ascending triangles, breakouts above key resistance levels, or bullish candlestick formations. Positive news (e.g., regulatory clarity, major partnerships, or favorable market reports) enhances investor confidence. Once traders recognize a trend reversal, it leads to increased buying momentum, further propelling ETH higher. This shift in sentiment often acts as a self-fulfilling prophecy, attracting more capital into the asset.
2. Institutional Adoption and Investment
Institutional investors, including hedge funds, asset managers, and pension funds, play a crucial role in cryptocurrency price dynamics. Large-scale investments, ETFs, or custodial solutions designed for institutional clients can generate significant buy pressure. Notable endorsements from major financial firms or integration of Ethereum-based products into mainstream financial platforms can serve as a validation, encouraging broader participation. This institutional involvement often brings stability and confidence, supporting sustained upward movement towards higher targets like $4,500.
3. DeFi and NFT Growth
Ethereum's ecosystem is the backbone of the decentralized finance (DeFi) sector and NFTs. The expanding adoption of DeFi applications (lending, borrowing, staking) and booming NFT markets increase demand for ETH, since it is essential for transaction fees and smart contract execution. As new projects and use cases emerge, the utility of ETH grows, directly impacting its value. Additionally, mainstream adoption of DeFi and NFTs draws more retail and institutional investors into the ecosystem, contributing to price appreciation.
4. Network Developments
Ethereum continues to undergo significant upgrades to address scalability, security, and sustainability. Ethereum 2.0, with features like proof-of-stake (PoS) consensus, shard chains, and Layer 2 scaling solutions (like Rollups), greatly enhance network efficiency. These upgrades improve user experience and reduce transaction costs, making Ethereum more attractive for developers and users. The improving technology infrastructure can result in increased transaction volume, user activity, and investor confidence, which collectively drive the price upward.
5. Macro and Cryptocurrency Market Factors
Broader macroeconomic conditions influence Ethereum’s price. A declining dollar, inflation concerns, or global economic uncertainty can push investors toward alternative assets like cryptocurrencies. Bitcoin’s market movement often correlates with ETH, and a bullish Bitcoin trend can lift ETH prices as well. Additionally, positive regulatory developments or a general rally in the crypto market can create a favorable environment, supporting Ethereum’s ascent to higher levels.
6. Technical Indicators
Traders rely heavily on technical analysis. Breakouts above significant resistance levels (e.g., previous highs around $3,500 or $4,000), increased trading volume, and bullish chart patterns such as flags or bullish divergence reinforce the upward trend. These technical signals attract momentum traders and institutional players, which accelerate the price increase. Consistent bullish technicals contribute to a self-sustaining upward trajectory toward the $4,500 target.
7. Supply Dynamics
Ethereum's supply mechanics significantly influence its price. The implementation of EIP-1559 introduced a fee-burning mechanism that reduces circulating supply over time, creating a deflationary pressure. When network activity is high, more ETH is burned, decreasing supply and potentially increasing scarcity. Furthermore, the transition to Ethereum 2.0's proof-of-stake reduces issuance, limiting new ETH supply entering the market. These supply-side dynamics, combined with growing demand, can lead to significant appreciation, moving ETH toward and beyond the $4,500 level.

ETH to + $4,5007 topics explaining why Ethereum might be heading towards at least $4,500 after returning to its trend:
1. Market Sentiment and Bullish Reversal
When Ethereum breaks out of a consolidation phase or a downtrend, it often signals a shift in market psychology. A bullish reversal can be triggered by technical patterns such as ascending triangles, breakouts above key resistance levels, or bullish candlestick formations. Positive news (e.g., regulatory clarity, major partnerships, or favorable market reports) enhances investor confidence. Once traders recognize a trend reversal, it leads to increased buying momentum, further propelling ETH higher. This shift in sentiment often acts as a self-fulfilling prophecy, attracting more capital into the asset.
2. Institutional Adoption and Investment
Institutional investors, including hedge funds, asset managers, and pension funds, play a crucial role in cryptocurrency price dynamics. Large-scale investments, ETFs, or custodial solutions designed for institutional clients can generate significant buy pressure. Notable endorsements from major financial firms or integration of Ethereum-based products into mainstream financial platforms can serve as a validation, encouraging broader participation. This institutional involvement often brings stability and confidence, supporting sustained upward movement towards higher targets like $4,500.
3. DeFi and NFT Growth
Ethereum's ecosystem is the backbone of the decentralized finance (DeFi) sector and NFTs. The expanding adoption of DeFi applications (lending, borrowing, staking) and booming NFT markets increase demand for ETH, since it is essential for transaction fees and smart contract execution. As new projects and use cases emerge, the utility of ETH grows, directly impacting its value. Additionally, mainstream adoption of DeFi and NFTs draws more retail and institutional investors into the ecosystem, contributing to price appreciation.
4. Network Developments
Ethereum continues to undergo significant upgrades to address scalability, security, and sustainability. Ethereum 2.0, with features like proof-of-stake (PoS) consensus, shard chains, and Layer 2 scaling solutions (like Rollups), greatly enhance network efficiency. These upgrades improve user experience and reduce transaction costs, making Ethereum more attractive for developers and users. The improving technology infrastructure can result in increased transaction volume, user activity, and investor confidence, which collectively drive the price upward.
5. Macro and Cryptocurrency Market Factors
Broader macroeconomic conditions influence Ethereum’s price. A declining dollar, inflation concerns, or global economic uncertainty can push investors toward alternative assets like cryptocurrencies. Bitcoin’s market movement often correlates with ETH, and a bullish Bitcoin trend can lift ETH prices as well. Additionally, positive regulatory developments or a general rally in the crypto market can create a favorable environment, supporting Ethereum’s ascent to higher levels.
6. Technical Indicators
Traders rely heavily on technical analysis. Breakouts above significant resistance levels (e.g., previous highs around $3,500 or $4,000), increased trading volume, and bullish chart patterns such as flags or bullish divergence reinforce the upward trend. These technical signals attract momentum traders and institutional players, which accelerate the price increase. Consistent bullish technicals contribute to a self-sustaining upward trajectory toward the $4,500 target.
7. Supply Dynamics
Ethereum's supply mechanics significantly influence its price. The implementation of EIP-1559 introduced a fee-burning mechanism that reduces circulating supply over time, creating a deflationary pressure. When network activity is high, more ETH is burned, decreasing supply and potentially increasing scarcity. Furthermore, the transition to Ethereum 2.0's proof-of-stake reduces issuance, limiting new ETH supply entering the market. These supply-side dynamics, combined with growing demand, can lead to significant appreciation, moving ETH toward and beyond the $4,500 level.

$BTC x $GOLDCRYPTOCAP:BTC , the largest store of value after TVC:GOLD and NASDAQ:XAG , historically follows TVC:GOLD movements!
2025 looks set to be epic for #Bitcoin
