Bitcoin - Showing strength as it breaks key resistance levels!Bitcoin (BTC) recently demonstrated impressive strength by bouncing off a well-known confluence zone consisting of the golden pocket and a 4-hour fair value gap (FVG) around the $100,000 level. This technical area has historically acted as a reliable support and once again proved its significance, offering a solid foundation for the current rally.
Following this bounce, BTC surged to $108,000, decisively breaking above the 4-hour FVG near $107,000. With this breakout, the previously resistant zone is now expected to flip into support, adding further confidence to the bullish outlook. This type of price action is often seen in strong uptrends, where key resistance levels are reclaimed and converted into support, providing a base for further upside.
Importantly, BTC has also managed to push through the golden pocket resistance, a critical Fibonacci retracement area closely watched by traders. This breakout, in conjunction with the 4H FVG clearance, clears the path for a potential continuation toward Bitcoin’s all-time high.
Momentum is clearly building. Buying pressure is strong, and retracements have been shallow, indicating a market dominated by demand. While this is a bullish sign, a brief pullback or bounce off the newly formed support (the 4H FVG zone) would be healthy. Such a move would allow BTC to consolidate and build strength before potentially pushing toward new highs.
Overall, the technical landscape looks increasingly favorable for BTC. As long as it holds above the reclaimed support zones, the path to retesting, and possibly surpassing, the all-time high appears wide open.
Thanks for your support.
- Make sure to follow me so you don't miss out on the next analysis!
- Drop a like and leave a comment!
BTC-D

#BTC - Post Weekly Close Update 👉#BTC has deviated from the RLs and has since seen a magnificent recovery into KL, which, if closed above on the daily, can result in higher prices, potentially even a new ATH. The weekly candle itself is a long-legged doji, which, as you know, is an indecisive candle with a very small body representing indecision, and rightly so, as we continue to range on HTF with no resolution above or below the SH and SL.
I also note that despite the recovery, we’ve closed below the weekly resistance at 106400 on HTF. A weekly close above it would be ideal to confirm higher prices
👉On LTF/MTF – We’ve seen a break above the TL as well as 4H & 12H closes above the PSH at 106766, which ought to be sufficient as a signal for an upward move. For better confirmation, I’d like to see a daily close above PSH, followed by a PB into KL, and we can then look for entries on BTC or alts.
If, however, we see a rejection from the CMP and get below ~103K, it suggests a retest of 100K and potentially even 98K. So keep that in mind, even though that’s an unlikely scenario given the strength of the PA atm.
💪I also note that we haven’t left any imbalances in the chart. Every imbalance has been filled by an LH, which suggests we might see a swift move up if it comes. Now we’re just waiting for the daily close to confirm the BO above PSH, which seems likely given the PA.
💪Also, all BVOLs charts are at support atm, suggesting a massive surge in volatility may follow.
bitcoin road map (4h)As I mentioned, the wedge has been broken, and this could push the price above $110,000.
previous analysis

BTCUSD: H&S neckline invalidated! Heavily bullish.Bitcoin turned bullish again on its 1D technical outlook today (RSI = 58.910, MACD = 1101.600, ADX = 21.447) as it crossed over the neckling of the Head and Shoulders pattern and invalidated the bearish sentiment. This now targets the 2.0 Fibonacci extension to the upside on the short term, TP = 123,500.
## If you like our free content follow our profile to get more daily ideas. ##
## Comments and likes are greatly appreciated. ##

BTC NEW UPDATE (4H)This analysis is an update of the analysis you see in the "Related publications" section
These days, Bitcoin's movement is mostly driven by liquidity hunting and is caught in complex and risky corrections.
The resistance zone currently in front of Bitcoin is marked in red. If the price is going to get rejected, it should happen from this zone. However, if this zone is broken and price stabilizes above it, Bitcoin could turn bullish again.
Considering today is Monday, volumes are still low, and the price is near a strong order block | you should be careful with your positions.
For risk management, please don't forget stop loss and capital management
Comment if you have any questions
Thank You

BTC (Y25.P2.E7). Bullish or Bearish setupHi traders,
Since we broke above the macro VAH, which could act like support, I'm expecting new highs, However If the 4 hour candle closes below the Anchored vWAP, then we look for Wave B in this recent move.
Difficult to call.
ABC to the upside and then a deeper correction like other ATH, with 12 to 14%.
I'm leaning to bullish and price to range sideways before making another bullish move to the upside.
We have 2 scenarios for sideways, mild or deep and broad.
Examples given below with the fractal of previous ATHs
Please give me a like and share,
Regards, S.SAri

BTC (Y25.P2.E4). Potential bullish fractal to take placeHi traders,
Price is bullish and its likely we will see more ATH to come.
Here, with a peak, followed by a troph, we found support like the macro Y21 BTC price action. Hence finding that support level makes sense to long.. To early to find a long but it could come soon.
Alternatively, we see a AB=CD move to 105k level, but this is looking less likely
The ABC target, is 1 to 1, which aligns to take the liquidity above this ATH level.
Or Its a wave 2 level and hence a bigger move of wave 3.
All the best,
S.SAri

BTC Testing Major Resistance >>> Rejection Likely?Hi guys!
Did you see my last analysis about Btc? Let's break it down more!
Bitcoin is now testing a major resistance zone around $106.8K, where a descending trendline has already pushed the price down several times.
This area could act as a reversal point again. If BTC fails to break above, we might see a move down toward $102.2K — a strong support level from earlier this month.
Right now, the market is showing signs of weakness near resistance, so this could be a good spot to watch for a short setup — unless bulls step in with strong volume and break out cleanly.
attention to these levels:
Resistance: $106.8K (trendline + supply zone)
Support target: $102.2K
Outlook: Bearish unless breakout confirmed

BTC Macro Cycle Outlook (Log Chart)Bitcoin continues to respect its logarithmic ascending channel that has defined every major bull and bear cycle since 2015. Each cycle top has historically aligned with the upper blue trendline, marked by sharp rejections (red arrows 🔴).
Currently, BTC is pushing within a steep short-term channel, mirroring previous parabolic phases. If the structure holds, we could see a final push toward the $300,000 zone, which aligns with the channel resistance — potentially marking the next cycle top.
📈 This chart captures the bigger picture — filtering out short-term noise and focusing on the rhythm of Bitcoin’s long-term cycles.
Do you think this cycle will end like the last two? Or are we in for something different?
All Strategies Are Good; If Managed Properly!
~Richard Nasr

HolderStat┆BTCUSD springs from 100k railAfter a week-long pullback, CRYPTOCAP:BTC ricochets off 100 k support, keeping the rising-channel narrative alive. Bitcoin price now squeezes beneath a descending trendline; a daily close over 109 k could unleash a breakout toward the 112-114 k resistance shelf.

H100 Group AB - Une bitcoin Treasury : 7.7 BTH100 Group AB is a company listed on Nasdaq First North (NGM Sweden), positioned as a Bitcoin Treasury Company. Formerly known as eBlitz Group, it recently underwent a major strategic pivot through a reverse merger with Healthy to 100 AS, a company focused on health, longevity, and sustainable technologies.
Since April 2025, H100 has started shifting to a hybrid model combining:
Bitcoin holdings as its primary treasury asset,
Investments in healthtech and wellness innovation,
An aggressive fundraising strategy through convertible loans to expand BTC acquisition and fund growth.
The company has recently accumulated 7.7 BTC in a “MicroStrategy-like” approach.
Trading volume has surged since May 2025.
The stock shows high volatility, often correlated with Bitcoin movements.
Active financing through convertibles (dilution risk to monitor).
Conclusion: H100 is a speculative play on Bitcoin performance, supported by a growth-oriented vision in the health and digital assets sectors.

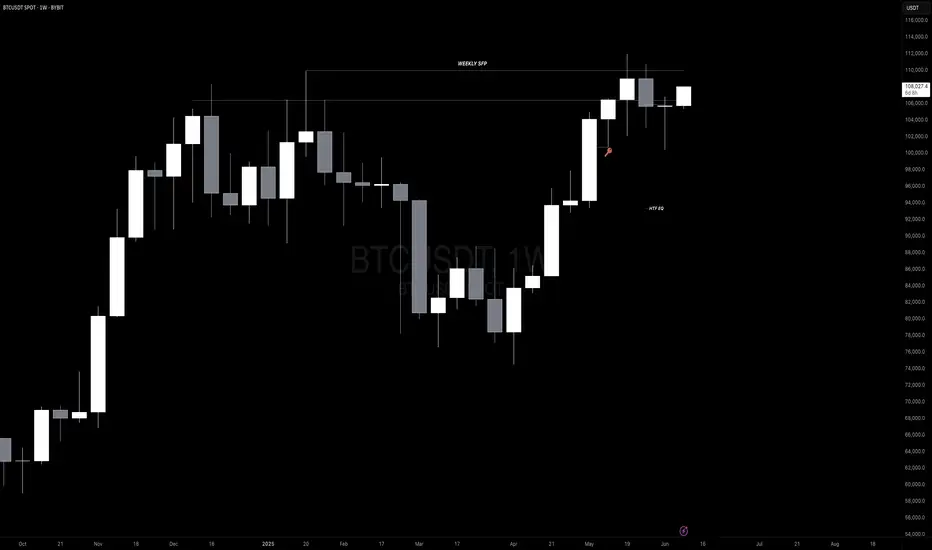
Bitcoin — Breakout or Bull Trap? SFP Setup ExplainedAfter a clean drop that nearly tagged the psychological $100K level, Bitcoin printed a Swing Failure Pattern (SFP) — sweeping the lows and snapping back with strength. That bounce wasn’t just a reaction — it was a liquidity reclaim.
Now, price structure is shaping into a potential Inverted Head & Shoulders — a classic reversal pattern often forming before a bullish continuation.
🔍 Key Level to Watch:
$106,694.63 — This recent key high was just taken out. If we see rejection here (SFP), it could set up a high-probability low-risk short opportunity.
🎯 Short Trade Idea (Only on SFP confirmation):
Entry: After price sweeps $106,694.63 and shows rejection
Stop-Loss: Above wick high (e.g., ~$107.4K)
TP Zones: $103.5K and $101.7K
R:R: ~1:7
✅ Cleaner setup with confluence from structure and liquidity — high probability if confirmed.
📚 Educational Insight: Why SFPs Work So Well
SFPs (Swing Failure Patterns) are some of the most powerful setups in trading because they:
Trap breakout traders
Sweep liquidity and reverse quickly
Offer clear invalidation (wick high/low)
Allow for tight stop-loss and high R:R setups
Using SFPs in conjunction with key highs/lows, volume, and structure dramatically increases your edge.
📈 Why Order Flow Is Crucial for SFPs
1. See the Trap Form in Real Time
SFPs are essentially traps — price sweeps a key level, sucks in breakout traders, and then reverses. Order flow tools let you see this happen:
A spike in market buys above resistance
Followed by a lack of follow-through (no new buyers)
And then an aggressive absorption or reversal (selling pressure hits)
Without order flow, this is all hidden in the candles.
2. Confirm Liquidity Sweeps with Delta & CVD
Watch for a delta spike or Cumulative Volume Delta (CVD) divergence — a clear sign that aggressive buyers are getting absorbed.
This gives you confirmation that the sweep failed, not just a random wick.
3. Tight Entries with Confidence
When you see actual trapped volume or liquidation clusters at the SFP level, you can enter tighter with conviction — because you're not guessing, you’re reacting to actual intent and failure in the market.
4. Early Warning System for Reversal or Continuation
If the SFP fails to trigger a reversal (e.g. buyers step back in with strength), you’ll see it early in the flow — and can quickly reassess.
🧠 Bottom Line:
Order flow lets you stop guessing and start seeing the actual fight between buyers and sellers. Combine it with SFPs, and you're not just trading price — you're trading intent. That edge is huge.
_________________________________
💬 If you found this helpful, drop a like and comment!
Want breakdowns of other charts? Leave your requests below.

Bitcoin - Bitcoin holds $100,000 support?!Bitcoin is above the EMA50 and EMA200 on the four-hour timeframe and has broken out of its short-term descending channel. We can look for Bitcoin short positions from the supply zone. If this corrective move occurs, we can also look for Bitcoin long positions in the demand zone.
It should be noted that there is a possibility of heavy fluctuations and shadows due to the movement of whales in the market and capital management in the cryptocurrency market will be more important. If the downward trend continues, we can buy in the demand range.
Bitcoin network transaction activity has dropped to its lowest level since October 2023. According to data from The Block, the seven-day moving average of Bitcoin transactions has recently declined to 317,000—marking the lowest point in the past 19 months. This decline comes at a time when Bitcoin’s price still hovers near its all-time highs.
Meanwhile, Bitcoin Core developers have recently stated that network nodes should not block the relay of low-fee or non-standard transactions if miners are willing to process them. This highlights a shift in Bitcoin’s policy direction and indicates a growing acceptance among some miners of lower-cost transactions.
In certain instances, miners’ appetite for transaction fees appears to have diminished. Mononaut, founder of the Mempool project, pointed out that a transaction with an almost-zero fee was recently included in a block. This could signal reduced network activity or a declining need among miners to prioritize high-fee transactions.
Currently, only 0.3% of American investors’ total assets are allocated to Bitcoin. Real estate dominates their portfolios, followed by bonds and stocks.This means that Bitcoin accounts for a very small portion of U.S. investor wealth. However, if even a small fraction of capital currently tied up in real estate, stocks, or bonds shifts into Bitcoin in the future, it could have a substantial market impact—an encouraging sign over the long term.
The United States has emerged as the dominant force in the Bitcoin ecosystem. A report by River outlines how this dominance has reached its peak. The U.S. holds nearly 40% of the total Bitcoin supply, and American companies account for a staggering 94.8% of public Bitcoin ownership. Additionally, 82% of development funding and approximately 79.2% of Bitcoin ETF ownership originate from the U.S. The country also commands about 36% of the global hash rate.
Since 2021, the total value of Bitcoin mined by American companies has reached $42.6 billion, accompanied by over $30 billion in investment into Bitcoin mining infrastructure. The U.S. now hosts more than 150 Bitcoin-related companies and 40 mining sites with capacities exceeding 10 megawatts.
Today, nearly two-thirds of all Bitcoin in circulation is held by individuals who rarely—or never—sell their coins. In just the last 30 days, roughly 180,000 Bitcoins have been moved to wallets with historically low selling activity. Meanwhile, whales continue to accumulate Bitcoin at price levels above $100,000.

ETHEREUM is repeating BITCOIN's 2018-2021 Cycle!Ethereum (ETHUSD) has found itself on a very strong rally since the April 07 bottom, which resembles the V-shaped recovery of Bitcoin on the March 09 2020 bottom. In fact BTC's whole 2018 - 2021 Bull Cycle resembles ETH's 2022 - 2025 Cycle so far.
So far ETH is struggling to break above its 1W MA50 (blue trend-line) but the most important Resistance of the Cycle is the ATH Lower Highs trend-line. When that broke for Bitcoin, a parabolic rally started. Do you think we will see such a break-out on ETH too by the end of the year?
-------------------------------------------------------------------------------
** Please LIKE 👍, FOLLOW ✅, SHARE 🙌 and COMMENT ✍ if you enjoy this idea! Also share your ideas and charts in the comments section below! This is best way to keep it relevant, support us, keep the content here free and allow the idea to reach as many people as possible. **
-------------------------------------------------------------------------------
💸💸💸💸💸💸
👇 👇 👇 👇 👇 👇

09/06/25 Weekly OutlookLast weeks high: $106,812.33
Last weeks low: $100,372.93
Midpoint: $103,592.63
Billionaire spats and V-shaped recoveries, the beginning of June starts off in an interesting way. As President Trump goes forward with "The big beautiful bill" Elon Musk lets his feelings be known publicly sending shockwaves throughout markets, but what does this mean for Bitcoin?
The bill could add $3-5T in US government spending which is great for risk-on assets as there is more money able to flow into markets. I believe this exact thought process is visible on the chart in the V-shaped recovery we can see on Thursday. A clear sell-off as Elon Musk's anti government spending views clash with the bill, the uncertainty causes a sell the news moment, just as BTC comes into $100,000 the dip is bought up on the realization this means greater inflows are on the way, dips are truly for buying at this stage in the cycle and to me, this proves it.
In a more bearish view of the chart I would say the clear resistance is now weekly high at ~$106,000. Anything above that meets huge selling pressure with price discovery on the other side the market just doesn't seem to have the fuel as of yet to make the next step. However I believe it is just a matter of time and as M2 global money supply grows we get closer and closer to seeing new significant highs.
For this week CPI & PPI take place on Wednesday and Friday respectively. With CPI set to grow from 2.3% to 2.5% according to forecasts it will be interesting to see how markets react, expect short term volatility. Key battlegrounds for me are weekly high and midpoint.
Good luck this week everybody!

BTC 1H Reverse H&S Morning folks,
So, drop is done due to Trump-Musk conflict, although we haven't called to trade it. Anyway, current picture is much better and doesn't need a lot of comments. We have reverse H&S in progress, with potential area for entry around 102.5-103K where we expect the right arm should appear. Invalidation point is ~100K (bottom of the head).

Bullish rise?The Bitcoin (BTC/USD) has bounced off the pivot and could rise to the 1st resistance.
Pivot: 101,052.23
1st Support: 94,702.53
1st Resistance: 110,959.87
Risk Warning:
Trading Forex and CFDs carries a high level of risk to your capital and you should only trade with money you can afford to lose. Trading Forex and CFDs may not be suitable for all investors, so please ensure that you fully understand the risks involved and seek independent advice if necessary.
Disclaimer:
The above opinions given constitute general market commentary, and do not constitute the opinion or advice of IC Markets or any form of personal or investment advice.
Any opinions, news, research, analyses, prices, other information, or links to third-party sites contained on this website are provided on an "as-is" basis, are intended only to be informative, is not an advice nor a recommendation, nor research, or a record of our trading prices, or an offer of, or solicitation for a transaction in any financial instrument and thus should not be treated as such. The information provided does not involve any specific investment objectives, financial situation and needs of any specific person who may receive it. Please be aware, that past performance is not a reliable indicator of future performance and/or results. Past Performance or Forward-looking scenarios based upon the reasonable beliefs of the third-party provider are not a guarantee of future performance. Actual results may differ materially from those anticipated in forward-looking or past performance statements. IC Markets makes no representation or warranty and assumes no liability as to the accuracy or completeness of the information provided, nor any loss arising from any investment based on a recommendation, forecast or any information supplied by any third-party.

BTC: Decision Time Ahead! A Quick Update!!Hey Traders!
If you’re finding value in this analysis, smash that 👍 and hit Follow for high-accuracy trade setups that actually deliver!
Bitcoin is once again testing the descending trendline resistance on the 4H chart.
We're currently at a make-or-break level:
A clear breakout above the trendline could trigger a bullish move toward $110K+
A rejection here might push BTC back to the $100K–$98K support zone
📍The green zone remains key — last time, it held as strong support.
But without a breakout above $106.5K, bulls are on the defensive.
Watch price action closely here — the next big move could start from this very point.
What’s your take? Bullish breakout or another dump loading?

$META Short Swing - Fractal Repeat Play - Sub $600 Target@everyone 🔻 META Short Swing – Fractal Repeat Play 🔁
Entry Trigger: Week of June 10, 2025
Ticker: NASDAQ:META
Current Price: $697.71
Target Price: $593.66
Estimated Duration: ~3–4 weeks
Conviction: ★★★★★
🧠 Thesis:
This is a nearly perfect fractal repeat of META’s July 2024 top:
Identical weekly candle structure: topping wick into fib + supply zone
Weekly gap fill target lines up exactly again — same 15.5% drop
Wick gap fill = $593.66 (same confluence from 2024)
Bearish fib roadmap from 0.786 → 0.618 → 0.382
Volume and momentum exhausted on the run into $702
📉 Trade Plan:
Entry Range: $690–702 rejection zone
Stop Loss: Weekly close above $705
Primary Target: $593.66
This level completes the wick gap fill and matches 2024’s exact structure
Secondary Target (optional): $580.84 (full fib gap + demand retest)
🛠️ Options to Consider:
6/28 $650P or $640P – standard swing
7/5 $620P – for deeper move toward 0.382 and beyond
🔍 Setup Snapshot:
July 2024: -15.56% in 28 days
June 2025: Targeting -15.53% in 28 days
Same gap, same wick rejection, same fade roadmap

SUSDTAnalysis is the same analysis, it just seems like the type of pattern is different... we have another low and then a high...

Bitcoin (BTCUSD) - Daily Price Consolidation Under ResistanceBitcoin (BTCUSD) price has been in a short-term downtrend since June 2025.
Price is currently consolidating under $106,000 resistance.
Watching to see if an evening star candle pattern prints on the daily chart, for a very-short-term pullback.
Support targets: $105,000, $104,000, $101,000, $100,000.
Resistance targets: $107,000, $109,000, $110,000, $112,000.
Bitcoin has been correlating with the USA stock market, tech stocks, consumer sentiment, and breaking news.

Bitcoin, Fast & Easy. $100,000 Support Holds +AltcoinsThe main support is not $100,000 but $102,000, so we make this a range. Yesterday, for the first time this range was tested and it holds easily... We are strongly bullish above $102,000 and Bitcoin is already trading above 103K.
This is really good news but we are not fully in the green yet. Bitcoin can continue sideways, consolidation, and only after closing above $106,000 we are looking for higher prices. Once $110,000 gets conquered, we can start talking about new all-time highs and sustained bullish growth. Meanwhile, the altcoins grow.
So we are not there yet but this is the best ever. For Cryptocurrency to thrive we need a strong Bitcoin and Bitcoin right now is very strong. Are you trading any altcoin? If you are, feel free to accumulate, load-up, buy and hold.
As for Bitcoin, here is a very easy trading approach:
While above $100,000, ALL-IN bullish confirmed.
If it goes below $100,000, stay out and wait to see what the market does. As soon as there is a support level created, we go LONG. If it goes below $100,000 just to recover the next day, we are again ALL-IN as soon as Bitcoin starts trading above 100K.
This process can be repeated many times but once Bitcoin takes off, buying below $110,000 is a major win because soon Bitcoin will be trading above $150,000. We have targets around $180,000 and even beyond $200,000 is possible this same year. Never forget the bigger picture.
The bigger picture is bullish for Bitcoin and the altcoins, the short-term can create confusion because the chart, market conditions, can change within hours.
But there can be a drop, a retrace or a market flush, but knowing that Bitcoin will be trading above $150,000 soon turns such an event into a non-event, it makes it into a simple hold.
The action on the side of the altcoins confirms that Bitcoin will continue to grow. Short, mid and long-term.
There is no retrace, there is no correction, only a small consolidation phase in anticipation of the next bullish wave. You already know this. If you didn't, now you know.
In 2025, Bitcoin will continue to grow. Just as it grew in 2023 and 2024.
We are entering bull market season. Bullish momentum will only start to gain force.
Namaste.

Bitcoin: Break Out Or Fake Out Can Be Long.Bitcoin has adhered to my previous week's anticipated scenario almost exactly. While this may be a coincidence, I have called similar scenarios like this numerous times just see my previous articles, I left the illustration on the chart. From here, there are two scenarios to consider, one offering greater probability than the other. Let me explain.
First consider that the Bitcoin trend has never changed. The broader tend is bullish and the previous weeks only saw a brief corrective structure which found support in the 102K AREA )see my previous article). A reversal developed and confirmed and now we are in the process of rallying back toward the highs.
Scenario 1 The Breakout: IF the high 106's are cleared, it is possible price can break out to potentially test the next resistance around the 110K area. Since this environment is typically a lower volume time of year, I believe there is a greater chance of fake out. How you manage the risk all depends on the time frame you operate on. Smaller time frames can pin point more accurate signs of follow through while maintaining tighter risk while taking the breakout on this time frame exposes you to more risk. If taking the breakout on this time frame, consider mitigating risk with smaller size or being prepared to exit IF a conflicting signal appears like a bearish pin bar.
Scenario 2 The Retrace: IF price rejects the 106K area (fake out possibility) then I will be watching for a retest of the 104K area minor support. This is the level where I would be looking for confirmation patterns like bullish pin bars etc. This would not only constitute a higher low but also establish a classic inverted head and shoulders pattern. I do not put a lot of emphasis on the broader pattern, but it can help foster a self fulfilling prophecy. This reversal offers a greater probability since it is coming from a pullback within a broader bullish trend. Also the profit objective is greater since the 110K resistance would still be the same.
How you mange this again depends on the type of strategies you employ. My analysis is meant to provide an overall roadmap of the possibilities that I anticipate and nothing more. If you are a day trader this information will not be used the same way compared to if you are a swing trader. The key is how you define the risk and the confirmations. If the market rejects both scenarios, then we simply have to readjust to the new information that becomes available.
Thank you for considering my analysis and perspective.
