BTC PATo me it seems that the BTC chart is printing a traditional head and shoulders pattern, which would indicate probable lows at least in the short term.
BTC-D

#BTC/USDT: Head & Shoulders Breakdown – $95K Incoming?Hey Traders!
If you’re finding value in this analysis, smash that 👍 and hit Follow for high-accuracy trade setups that actually deliver!
Bitcoin just broke below the neckline of a clear Head & Shoulders pattern on the 4H timeframe — a classic bearish signal.
As long as price stays below the neckline and fails to reclaim the $106.5K zone, we could be heading for a deeper correction toward the $95K–$98K support range.
Key Levels:
Breakdown Zone: ~$103.9K
Downside Target: $95K–$98K
Invalidation: Reclaim above $106.5K
Market is showing consistent weakness — small bounces are quickly sold off.
Let the pattern play out and manage your risk accordingly.
What do you think — short-term dip or deeper breakdown loading?

BTC USDTBitcoin is testing key support around $103K. A breakdown below this zone could open the door to sub-$100K levels. Watch closely!

LINK Long Setup – Retrace to Key Support After Strong RallyLINK saw a strong rally from April to mid-May, and is now undergoing a healthy retracement. Price is approaching the $13.00–$13.50 support zone, offering a potential long spot entry as the market cools.
📌 Trade Setup:
• Entry Zone: $13.00 – $13.50
• Take Profit Targets:
o 🥇 $15.00 – $16.00
o 🥈 $17.00 – $18.00
• Stop Loss: Daily close below $12.00

HolderStat┆BTCUSD pennant pauseCRYPTOCAP:BTC cools under 106 k inside a narrowing pennant pinned to its long-term rising rail. Successive ascending consolidation triangles hint at continuation, projecting a thrust toward the 111 k resistance shelf. Holding the pattern’s base keeps breakout odds tilted north.

BTCUSDT - UniverseMetta - Signal#BTCUSDT - UniverseMetta - Signal
H4 - Formation of a 3-wave structure + exit from the channel. It is better to reduce risks. Stop behind the maximum of the 1st wave.
Entry: 104023.59
TP: 100872.54 - 99472.07 - 97196.31 - 93409.75
Stop: 106977.70

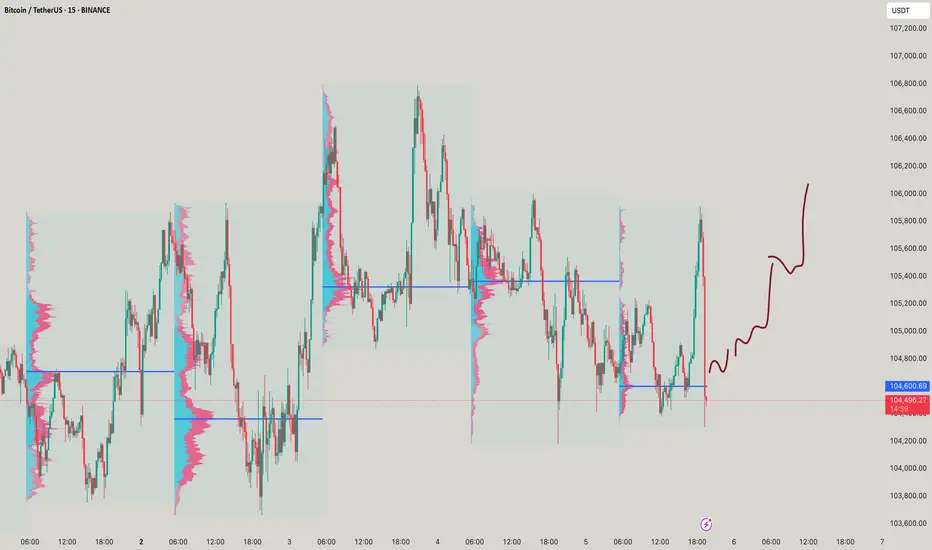
BTC _ Ultra mega quick scalpsAs said , quick scalps at cmp sl 104,000 targets of smooth 106,100 and 106,750! Enjoy it
Bitcoin may break resistance level and continue to move upHello traders, I want share with you my opinion about Bitcoin. If we look at the chart, we can see how the price entered an upward channel and declined to the support line. Then it started to grow and soon reached the 93500 support level, after which it broke this level and then some time traded near. After this, the price rebounded and continued to move up inside an upward channel, where it later reached a resistance level, which coincided with the seller zone. When BTC reached this level, it broke it too and even rose to the resistance line of the channel, but soon it turned around and dropped to the seller zone. In this area, the price long time traded and later tried to grow, but failed and continued to decline. Soon, BTC broke the 106500 level and fell below the resistance level. But recently, price turned around and grew to this level again, and now trades very close. In my opinion, Bitcoin can decline a little and then break the resistance level one more time. After this movement, I expect that the price will continue to move up inside the upward channel, so I set my TP at 112000 points. Please share this idea with your friends and click Boost 🚀

BITCOIN under brutal 4H squeeze. Buyers or sellers will prevail?Bitcoin (BTCUSD) is currently under the strongest squeeze we've seen this year as it's being compressed between the 4H MA50 (blue trend-line) and 4H MA200 (orange trend-line). Such tight price action usual precedes explosive moves.
Technically two patterns prevail: a long-term Channel Up and a short-term Head and Shoulders (H&S). Naturally, as long as the Channel Up holds (and is still valid), the pattern will attempt to push the price to he 2.0 Fibonacci extension at $121500 (and higher). If on the other hand it breaks (4H MA200 would be an early signal), the H&S may push the price to the -1.0 Fibonacci extension at $95000.
So what do you think? Which pattern will prevail? Feel free to let us know in the comments section below!
-------------------------------------------------------------------------------
** Please LIKE 👍, FOLLOW ✅, SHARE 🙌 and COMMENT ✍ if you enjoy this idea! Also share your ideas and charts in the comments section below! This is best way to keep it relevant, support us, keep the content here free and allow the idea to reach as many people as possible. **
-------------------------------------------------------------------------------
💸💸💸💸💸💸
👇 👇 👇 👇 👇 👇

$BTC 2025: The road to $444,000As predicted by @JoshMandell6 on X earlier this year, this chart is an entirely theoretical exercise (a pure hopium mind-burp if you will) to explore the remote possibility that a CRYPTOCAP:BTC price of $444K might even be achievable in any scenario. I simply drew a line from the Pi Cycle top in 2017/18, to the top in March 2021 and projected on to now (June 2025). I then marked off the $444K prediction made earlier this year by @JoshMandell6 (the yellow horizontal, dashed line). I then checked prior BTC cycles to see there are any examples where BTC was able to climb this distance within 2 monthly candles. Interestingly, if you take the last 2 monthly candles from the 2017/18 cycle (before and including the topping candle), it does line up pretty well. This suggests it is theoretically possible for BTC to reach $444k by August 1st 2025 - I know this is highly unlikely of course; but interesting all the same.
For additional context to this theory: the specific post I'm referring to was made by Josh Mandell (@JoshMandell6) on X (formerly Twitter) on November 5, 2024. In this post, Mandell presented a poetic prediction stating that Bitcoin would reach $84,000 on March 14, 2025, and subsequently surge to approximately $444,000. The prediction included symbolic phrases like “three four, times a thousand,” suggesting a target price of $444,000.
Mandell's forecast gained significant attention when Bitcoin indeed closed near $84,000 on March 14, 2025, aligning with his prediction. This accuracy bolstered his reputation, especially considering his background as a former trader at Salomon Brothers and Caxton Associates. He has also been transparent about his trading activities, publicly sharing his portfolio, which reportedly grew from $2.1 million to over $22 million by March 2025.
en.bitcoinsistemi.com
For a more in-depth understanding of Mandell's prediction and its implications, you might find this video insightful: youtu.be

Bitcoin's Roadmap: Price Structure, Fair Value & Market RhythmSince bottoming on November 21, 2022, Bitcoin has embarked on a remarkable bull run, rising +623.5% over 927 days and reaching a new all-time high (ATH) of ~112K.
When compared to the previous bull cycle, spanning 1061 days and producing a +2086% gain, this current rally shows signs of diminishing returns, a typical behaviour of maturing markets. Traders now face a critical question: has Bitcoin peaked for this cycle, or is another surge toward ~120K+ possible?
Historical Echoes: Elliott Wave Comparison
The 2018–2021 bull market formed a five-wave Elliott structure. That cycle ended with a -77.5% correction. The current cycle similarly traces out a completed five-wave advance from the $15.5K low, suggesting we may now be in a corrective phase.
Current hypothesis: Bitcoin is in Wave B of an ABC correction, with Wave C potentially targeting $64K–$70K.
Harmonic Confirmation: Cypher Sigma Pattern
A refined harmonic formation, I call it the Cypher Sigma Harmonic Pattern (CSHP) and it has proven highly effective in volatile assets like Bitcoin. It differs from the classic Cypher by:
BC projection: 1.07–1.136 of XA (vs. 1.272–1.414)
CD retracement: 0.786–0.886 of XC
BD extension: 1.272–1.618 of BC (not present in traditional Cypher but often targets 1.272-2.0)
In 2022, this pattern predicted the bottom near $16K. Currently, another Cypher Sigma is potentially forming, pointing to a possible correction to ~$64K. This target aligns with historical level (the 2021 ATH zone) and represents a possible -40% pullback.
Multi-Layered Technical Confluence
Pitchfork Resistance: Bitcoin rejected the upper resistance (Fib 1.0–1.136 zone)
Pitchfork Golden Pocket Support: ~$64K matches the golden pocket and high-liquidity area
Fibonacci Circles: Rejection precisely at the 1.618–1.65 circle arc (~$112K)
Speed Fan 0.618: Key structural support intersects projected retracement zone
Previous 2021 ATH
Together, these tools strongly support the hypothesis of a macro top forming.
Fair Value Trend Model (FVTM) – New Indicator
As part of ongoing research into Bitcoin’s long-term valuation, I developed the Fair Value Trend Model—a logarithmic regression-based indicator tailored for Bitcoin. Here is an example on the monthly timeframe.
Key Features:
Computes a log-log regression: ln(Price) vs ln(Days since inception)
Yields a power-law growth curve: F(t) = C · ^b
Includes dynamic channel bands at user-defined percentage offsets
Projects the trend forward in time with linear extrapolation
I have just freshly published this indicator for free on TradingView. Visit my profile, add it to your chart, and explore how Bitcoin consistently revisits its fair value in bear markets before launching new macro waves.
Use Cases:
Identify overextensions above the fair value channel
Spot mean-reversion setups near the lower channel band
Gauge long-term trend continuation via slope and forecast
The indicator is best used on daily, weekly and monthly charts, and it supports both all-time and rolling-window modes.
Educational Insight:
The Fair Value Trend Model isn’t just a tool! It's a lens to view the long-term rhythm of the Bitcoin market. By understanding where the fair value lies, you gain the clarity to separate short-term volatility from long-term opportunity.
Every great trader starts with a desire to understand. If you're learning, experimenting, and observing patiently—you’re on the right path. Let this model be your guide through the noise. Trust the math, respect the cycles, and never stop refining your edge.
Study day and swing trading, improve your technical and psychological skills, and wait patiently for high-probability trade setups, whether short-, medium-, or long-term. Being patient is key.
Psychological Insight: Mastery Over Impulse
The greatest returns favour the patient. Traders who ignored the noise in 2022 and accumulated around $16K were rewarded exponentially. As Bitcoin potentially enters a correction, the same principle applies: monitor, learn, and prepare—not panic.
Top-tier traders execute based on structure, not emotion. This cycle will reward those who:
-> Study multi-timeframe confluences
Outlook: Bearish Retracement, Bullish Opportunity
While a push to $120K+ is possible, the confluence of Elliott Wave, harmonic patterns, and macro tools suggest a potential 40% retracement into ~$64K by end of 2025/early 2026. This aligns with historical patterns and may offer a great buying opportunity.
This cycle isn’t about catching the exact top—it’s about navigating it intelligently. Use tools that reflect structural value, not just reactive price action. Combine the Fair Value Trend Model with other tools to gain clarity. Most importantly: remain curious, remain disciplined.
Happy trading.
Thanks for reading =) stay sharp, stay patient, and keep evolving 🚀
_________________________________
If you found this helpful, leave a like and comment below! Got requests for the next technical analysis? Let me know.

SNX/USDT Short-Term Trade | Entry at 0.627 with Clear TargetsMidterm/Intra-day Setup
This is an intra-day (midterm) trading setup.
Entry Price: 0.627
Take Profits (TPs): Refer to the marked levels on the screen for target points.
Stay disciplined and manage your risk accordingly.

Weak bearish contextMorning folks,
Not many changes since our last discussion. Yes BTC moved slightly lower, as we suggested, but you can see by yourself - action is very slow and lazy. Usually when bears control the market, action has to be stronger.
It means that overall context remains bearish but it is weak and not very attractive for trading, although it is not forbidden of course. We consider upside breakout of 107-108K area as a vital moment for this context. While downside target is around 97-98K.

$BTC UpdateCRYPTOCAP:BTC #BTC $104,987 support in effect, previous weekly closed with bearish engulfing, 4h closed with bullish engulfing - current 4H trying to follow thru. $107,461 support needed to push for $110,423 resistance, and then the new ATH. $103,093 current support, $99,361 key support from here. Watch given S/R

An example of a new way to interpret the OBV indicator
Hello, traders.
If you "follow", you can always get new information quickly.
Have a nice day today.
-------------------------------------
I think the reason why there are difficulties in using auxiliary indicators and why they say not to use indicators is because they do not properly reflect the price flow.
Therefore, I think many people use indicators added to the price part because they reflect the price flow.
However, I think auxiliary indicators are not used that much.
Among them, indicators related to trading volume are ambiguous to use and interpret.
To compensate for this, the OBV indicator has been modified and added.
-
The ambiguous part in interpreting the OBV indicator is that the price flow is not reflected.
Therefore, even if it performs its role well as an auxiliary indicator, it can be difficult to interpret.
To compensate for this, the High Line and Low Line of the OBV auxiliary indicator have been made to be displayed in the price section.
That is, High Line = OBV High, Low Line = OBV Low
-
Then, let's interpret the OBV at the current price position.
The OBV of the auxiliary indicator is currently located near the OBV EMA.
That is, the current OBV is located within the Low Line ~ High Line section.
However, if you look at the OBV High and OBV Low indicators displayed in the price section, you can see that it has fallen below the OBV Low indicator.
In other words, you can see that the price has fallen below the Low Line of the OBV indicator.
You can see that the OBV position of the auxiliary indicator and the OBV position displayed in the price section are different.
Therefore, in order to normally interpret the OBV of the auxiliary indicator, the price must have risen above the OBV Low indicator in the price section.
If not, you should consider that the interpretation of the OBV of the auxiliary indicator may be incorrect information.
In other words, if it fails to rise above the OBV Low indicator, you should interpret it as a high possibility of eventually falling and think about a countermeasure for that.
Since time frame charts below the 1D chart show too fast volatility, it is recommended to use it on a 1D chart or larger if possible.
-
It is not good to analyze a chart with just one indicator.
Therefore, you should comprehensively evaluate by adding different indicators or indicators that you understand.
The indicators that I use are mainly StochRSI indicator, OBV indicator, and MACD indicator.
I use these indicators to create and use M-Signal indicator, StochRSI(20, 50, 80) indicator, and OBV(High, Low) indicator.
DOM(60, -60) indicator is an indicator that comprehensively evaluates DMI, OBV, and Momentum indicators to display high and low points.
And, there are HA-Low, HA-High indicators, which are my basic trading strategy indicators that I created for trading on Heikin-Ashi charts.
Among these indicators, the most important indicators are HA-Low, HA-High indicators.
The remaining indicators are auxiliary indicators that are necessary when creating trading strategies or detailed response strategies from HA-Low, HA-High indicators.
-
Thank you for reading to the end.
I hope you have a successful trade.
--------------------------------------------------

Bitcoin & The FED June 2025 (Beyond $200,000 New All-Time High)Before a major bullish event, the market tends to go sideways or into a retrace. Since the event is bullish, prices grow. Preceding the event the market gives out everything that isn't what will happen after the event, like a detox.
Now, Bitcoin is a very strange monster, kind of like a virus but in the good sense of the word. It changes, mutates, evolves, upgrades outdated decaying systems. So it isn't likely to crash just because the market is about to turn ultra-bullish. It is the other way around, since everybody already knows, nobody is willing to sell. In reality, everybody is buying like there is no tomorrow.
So Bitcoin can go sideways or into retrace until the Fed announces that it is cutting whatever interest, you know these things. So when they do their thing, the market will be ultra-bullish and that's when Bitcoin will produce its bullish continuation. Right now there is a period of consolidation which is being used by the whales as accumulation.
Remember when I was saying you will look like a genius for buying below 80K?
It is the same situation all over again. When Bitcoin is trading at $150,000 or $200,000, you will look like a genius for buying below $110,000. That's the way it is.
So, slightly bearish before the event. There can be a market flush but these are going to be limited because Bitcoins can be lost forever. It is a fight between whales. So if some whales decide to manipulate the market trying to cause some panic, other whales will be happy to buy everything at the lows and prices recover.
This means that Bitcoin will be consolidating until the announcement, after the announcement; "We will cut rates certain numbers of points..." Then all heaven will break loose. It will be money-up good news.
Do what you do, just be good, know that Bitcoin and Crypto will grow there is no way to stop this wave we are all going up. Those that were hating are going to be hated by their own selves because nobody will know who they are. We are going to be party-rocking like a rockstar because not only Bitcoin but we are going on a global bull market. You can bet on it. And if you do, you will be glad you did and you will be extremely happy with the result.
There is no way to stop Bitcoin.
There is no way to stop this wave.
The entire Cryptocurrency market will do awesome in late 2025. Are you prepared?
Thank you for reading.
Namaste.
