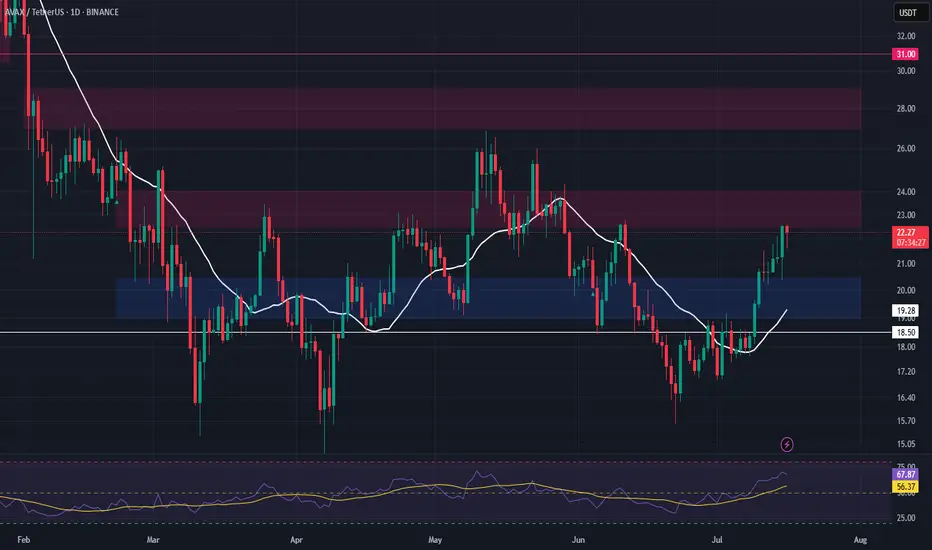
AVAX – Watching for Support Retest After Resistance TestAVAX is currently testing a major resistance level, and we’re anticipating a potential retrace into support. The $19.00–$20.45 zone offers a strong area to enter a long swing position on confirmation of the retest.
📌 Trade Setup:
• Entry Zone: $19.00 – $20.45
• Take Profit Targets:
o 🥇 $22.50 – $24.00
o 🥈 $27.00 – $30.00
• Stop Loss: Daily close below $18.50
Btc-e
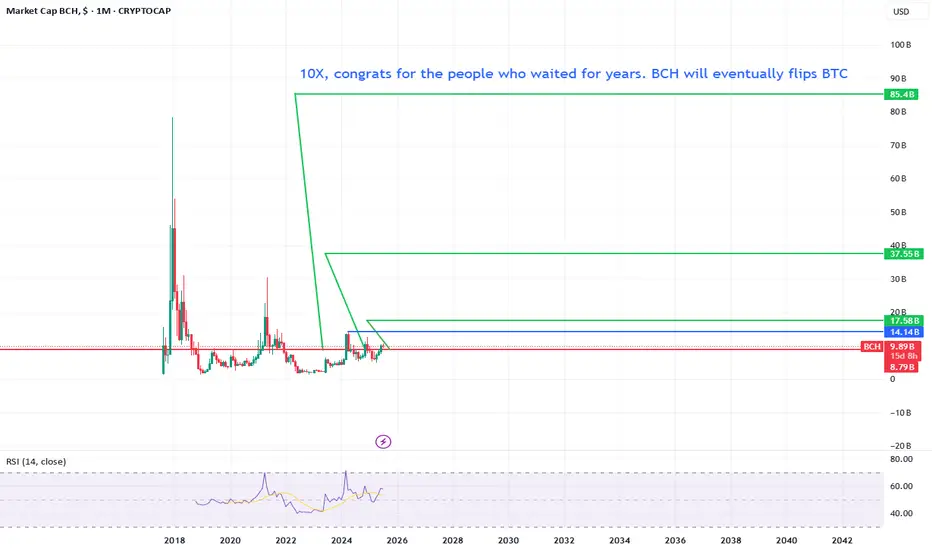
Bitcoin Cash will do a solid 10X For years bitcoin cash is been selling off.
But let me tell you this, we are just getting started.
If we pass the blue line we are officially triggered for a 85 billion marketcap.
Can still take some time but eventually it will happen. Make sure to fomo in when the party is starting!
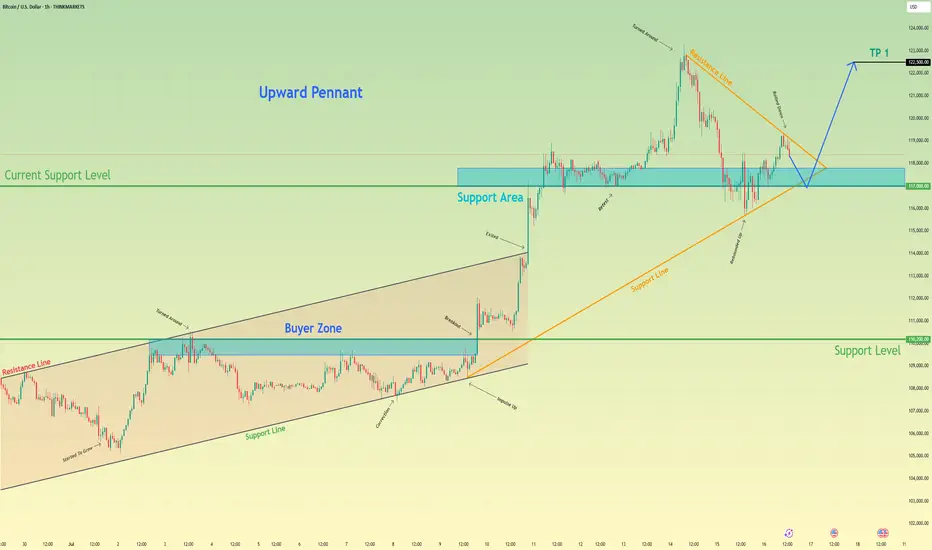
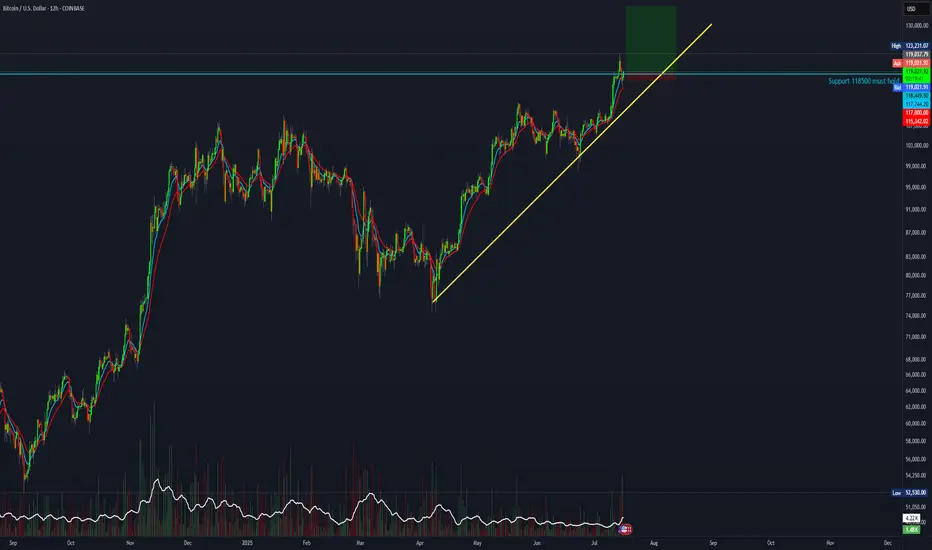
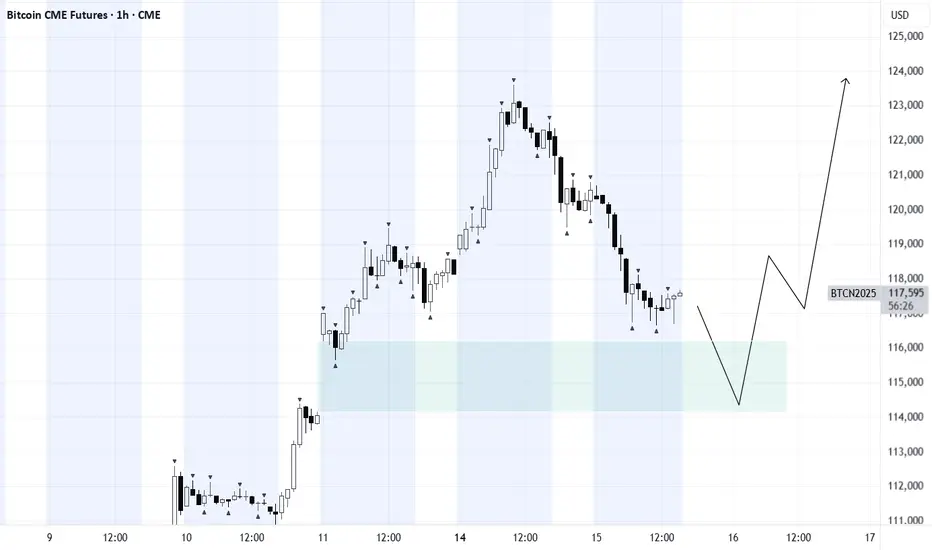
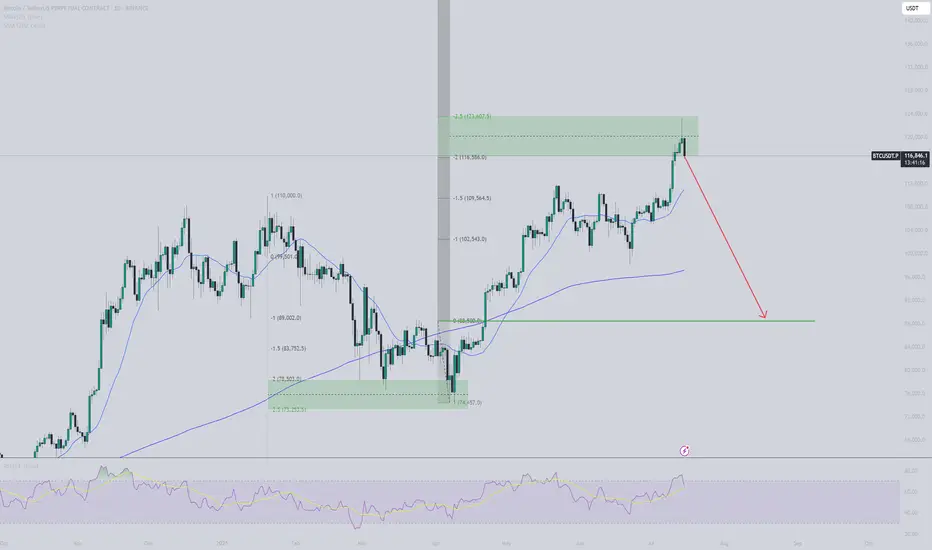
Bitcoin may exit of pennant and then rebound up of support areaHello traders, I want share with you my opinion about Bitcoin. Earlier, the price was moving inside an upward channel, respecting both the resistance and support boundaries. After reaching the buyer zone (110200–109500 points), BTC made a strong impulse up, breaking out of the channel and entering a new phase of growth. This breakout led to the formation of a bullish pennant, which often signals a continuation of the uptrend. Right now, the price is testing the support area between 117000 and 117800, which previously acted as a breakout zone and now serves as a current support level (117000). The structure shows that this level has already worked as a rebound zone multiple times. In my opinion, BTC may continue the correction toward this support area, potentially exiting the pennant to the downside for a short-term pull-back. After that, I expect a new upward movement, targeting the next local high. That’s why I set my TP at 122500 points, which is just below the recent ATH. Given the impulse move, strong support zone, breakout from the channel, and the bullish pennant pattern, I remain bullish and expect BTC to resume its upward trend soon. Please share this idea with your friends and click Boost 🚀
Disclaimer: As part of ThinkMarkets’ Influencer Program, I am sponsored to share and publish their charts in my analysis.
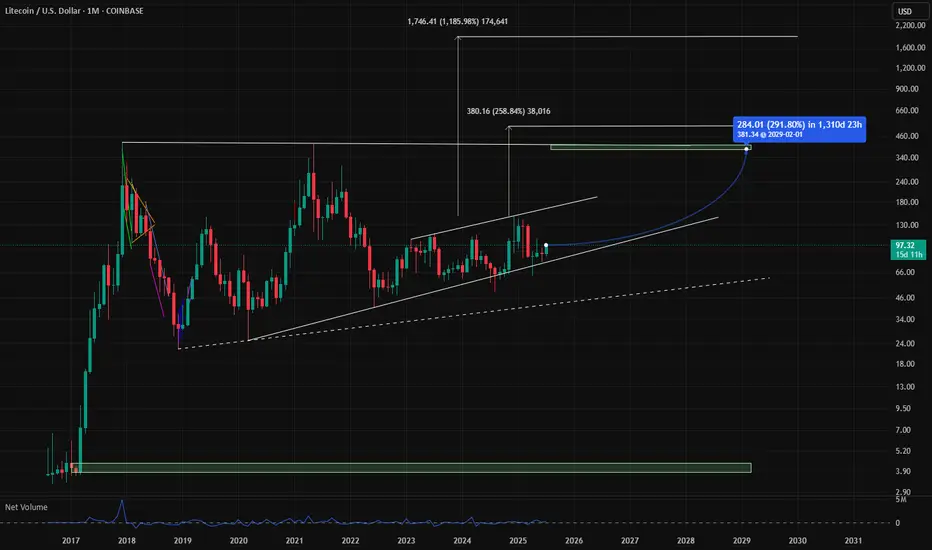
LTC Targets 400$ + 1900$ Litcoin LTC Targets for the next run are atm +290% is a realistic szenario. The addvanced targets at 1900$ are very impressiv but remember there are only 21 Mio. Coins too, like BTC because it is the fork and think about an alternative payment methode like btc, would be a reason for 1900$ pro LTC. So in Crypto is nothing unreal if you could imagine, but first of all approx. 400$ are a good direction. GM
Bitcoin Prediction that will blow your mind (warning for bulls) I am showing you that BTC made new ATH only in the USD pair and not in other pairs like EUR, and why, and what you can anticipate and what to watch out for from #Bitcoin next.

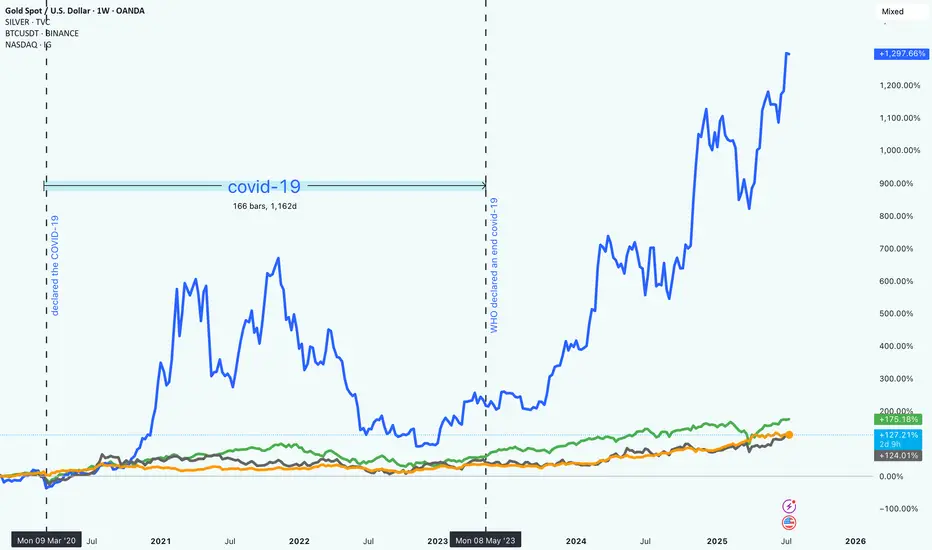
Market Trends from 2020 to 2025How Bitcoin, NASDAQ, Gold, and Silver Really Performed Since 2020
It’s been a wild few years in the markets. From early 2020 to mid-2025, investors have had to navigate uncertainty, changing interest rates, tech booms, and the rise of digital assets. Looking back, it’s clear that some assets took off while others just quietly held their ground.
So, what happened if you had invested in Bitcoin, the NASDAQ, gold, or silver five years ago?
Bitcoin (BTC): +1,297.87%
No surprise here. Bitcoin absolutely stole the show. Despite all the ups and downs (and there were plenty), BTC ended up with nearly 1,300% gains. It had a huge surge in late 2020 and 2021, crashed hard, and then climbed even higher starting in 2023.
This kind of return doesn’t come without risk. Bitcoin was by far the most volatile of the group. But for those who held on, the reward was massive. It also marked a big shift in how people think about money and investing.
"Crypto is no longer just a fringe idea."
NASDAQ: +175.26%
Tech stocks had a strong run, too. The NASDAQ gained around 175%, driven by innovation, digital expansion, and eventually, the AI boom. While there were some bumps along the way (especially when interest rates went up), the general trend was up and to the right.
Unlike Bitcoin, the NASDAQ was more predictable, less explosive.
Gold: +127.39%
Gold did what gold usually does. It held its value and slowly moved higher. Over five years, it returned about 127%, which is pretty solid for a “safe haven” asset. It didn’t grab headlines like crypto or tech stocks, but it stayed reliable through the chaos.
Silver: +124.50%
Silver had a similar story to gold, but with a bit more fluctuation. It benefited from both investor demand and industrial use, and it ended up with just over 124% in gains. Not bad for a metal that often gets overshadowed by its shinier cousin ;).
What It All Means
If you were in Bitcoin, you saw huge gains, but also had to stomach major volatility. Tech investors did well too, especially those who stayed in through the dips. Meanwhile, gold and silver offered steadier, more defensive returns.
One big takeaway: the investment landscape is changing. Traditional assets still matter, but new ones like crypto are reshaping what portfolios can look like.
In the end, it’s about balancing risk and reward!
and figuring out what kind of investor you are.
Do you think I'm joking ???As I said, Bitcoin broke the triangle, and now with a slight price correction, it could surge to $160,000, and you still think I'm joking!!
Previous analysis
Best regards CobraVanguard.💚

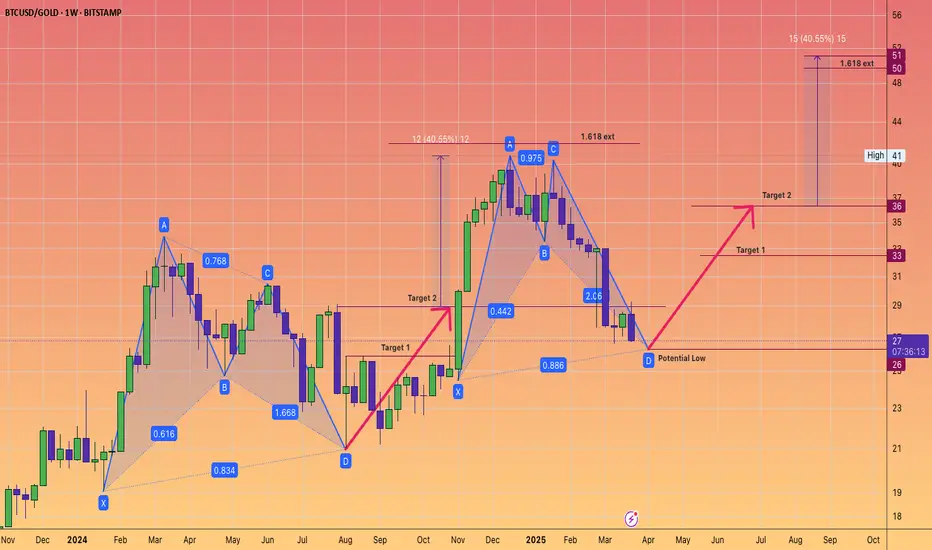
Bitcoin harmonic pattern. Back to back Gartley. BTCGOLD ratio.The BTC/GOLD ratio has experienced a significant correction, currently standing at 27 gold ounces per 1 Bitcoin, down from a peak of 41, representing a decline of 34%.
Gold, priced at $3,114 in US Federal Reserve notes, is in a sustained bull market.
It is reasonable to anticipate that the digital equivalent of gold will gain traction once gold stabilizes at a higher price point.
The Gartley pattern is recognized as the most prevalent harmonic chart pattern.
Harmonic patterns are based on the idea that Fibonacci sequences can be utilized to create geometric formations, which include price breakouts and retracements.
The Gartley pattern illustrated indicates an upward movement from point X to point A, followed by a price reversal at point A. According to Fibonacci ratios, the retracement from point X to point B is expected to be 61.8%.
At point B, the price reverses again towards point C, which should reflect a retracement of either 38.2% or 88.6% from point A.
From point C, the price then reverses to point D. At point D, the pattern is considered complete, generating buy signals with an upside target that aligns with points C and A, as well as a final price target of a 161.8% increase from point A.
Often, point 0 serves as a stop-loss level for the entire trade. While these Fibonacci levels do not have to be precise, greater proximity enhances the reliability of the pattern.
Will these consecutive Gartley patterns succeed in bolstering Bitcoin's strength? We will soon discover the answer.
BITCOIN Should we still trust the Stock to Flow model??It sure worked perfectly during Bitcoin's (BTCUSD) first Cycles, but the Stock-to-Flow model has greatly diverged from the current price action since March 2024.
Right now the model sits at around $750000, which is vastly above the current market price of $119000. It's been trading sideways actually since June 2024 and all of the times that it was ranging, Bitcoin eventually caught up and closed the gap.
It has always been a 'story' of divergence and convergence but it sure seems unrealistic to catch up this time, especially during if this Cycle continues to follow the 4-year model.
So what do you think? Should we still trust what seems more and more like an 'obsolete' model as mass adoption kicks in? Feel free to let us know in the comments section below!
-------------------------------------------------------------------------------
** Please LIKE 👍, FOLLOW ✅, SHARE 🙌 and COMMENT ✍ if you enjoy this idea! Also share your ideas and charts in the comments section below! This is best way to keep it relevant, support us, keep the content here free and allow the idea to reach as many people as possible. **
-------------------------------------------------------------------------------
💸💸💸💸💸💸
👇 👇 👇 👇 👇 👇

BTC Bottom & New ATH..... when ?!!! Hello Guys
There are some notes of BTC weekly Chart:
1. We have a new ATH every 4 years ( 1428-1477 ) days..
2. After the ATH we take about ( 52-59 ) weeks to make a new bottom then we go up a little ...
3. Every time we reach a new ATH we drop down in a same angle (-55) before the new bull run starting .... look at my chart ( Red angles and curves ):
****** We dropped from ATH 2013 to Bottom 2015 by an angle ( -55 ) .
****** We dropped from ATH 2017 to Bottom 2018 by an angle ( -55 ) .
****** Same (24 July 2019) we dropped from local top to the local bottom by Angle ( -56 ) .
****** Will we drop from ATH 2021 to Bottom (2022 - 2023) by the same angle ( -55 or -56 )??
4. In my opinion , I expect we will reach the final bottom between ( 26 December 2022 : 6 march 2023 ).
5. I don't care what will be the price of BTC then , but I care only for when will be the possible bottom !!.
But if we can try to expect the price it will be in a range of ( 11900 : 9000$) ...
Note:( 10K - 10500$) is very very strong demand area for BTC .
-------------------------------------------------------------------------------------------------------------------------------------------------------------------------------------------------------
Finally , I think the new ATH will not be before Nov 2025 ( 150k $ ).
It is not a financial advice , I am only share my thoughts with u :)
Thank u and good luck.

7:1 R:R setup for BTCIt looks like BTC has completed its pullback and is now continuing its uptrend. This trade setup offers a 7:1 R:R with a target of 135K
Entry: 118,900
Stop Loss: 117,000
Target: 135,000
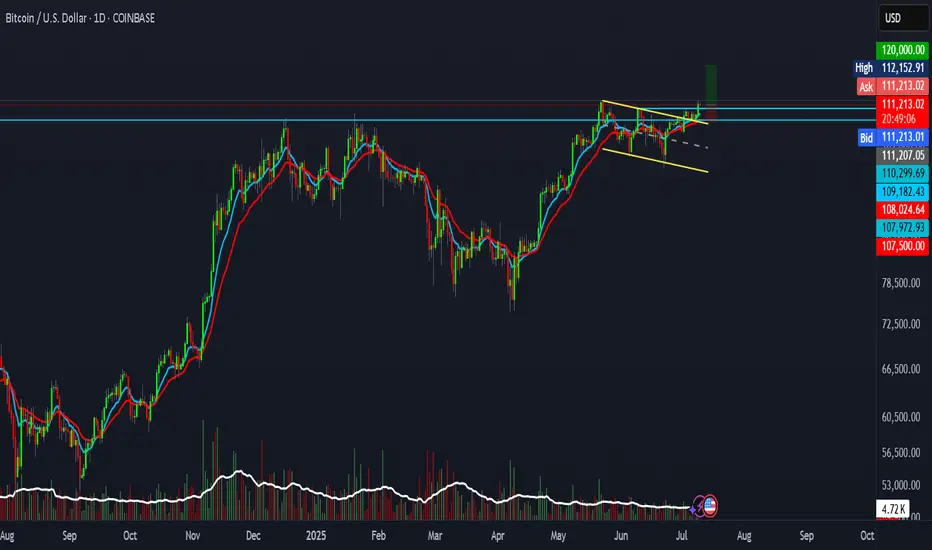
BTC setup with 2R R:R.BTC is showing signs of a real breakout.
This setup offers a 2:1 risk-reward ratio.
Entry: 111,207
Stop Loss: 107,500
Target: 120,000
Not financial advice.
BITCOIN NEXT TARGET 1205001. Professional & Direct:
BTC Long in Play – Eyes on 120,500 🔥
Momentum building strong. Stay in the trend — next target: 120.5K.
---
2. TradingView Style (Engaging):
Bitcoin Bulls Gaining Strength 🚀
Long position active. Targeting next major level at $120,500 — hold tight!
---
3. VIP Signal Tone:
BTC BUY Signal Active ✅
We’re riding the wave to $120,500. Strong confirmation on higher timeframes.

What Btc actually wants to sayThis trend line on daily chart shows sustain growth in BTC and it is rising day by day, Pure bullish in long run.
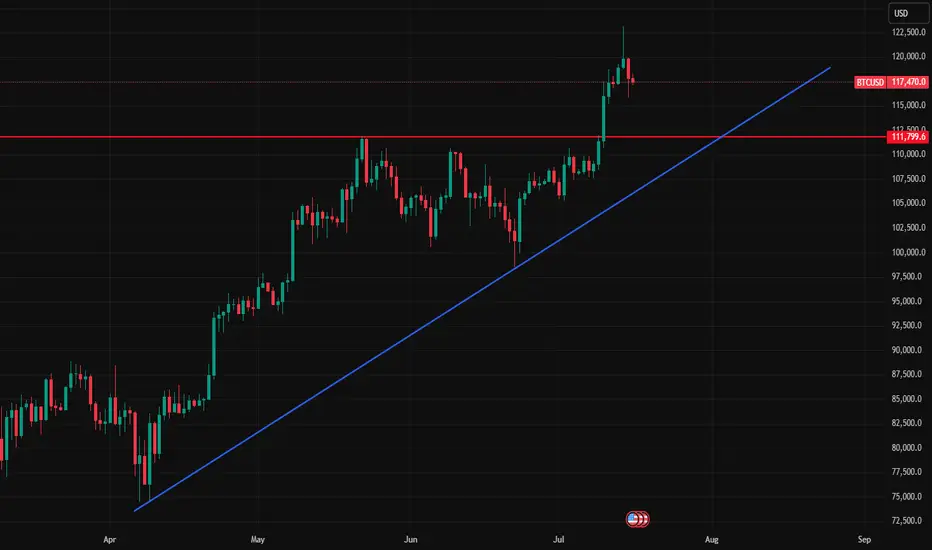
Support and resistance zones: 115854.56-116868.0
Hello, traders.
Please "Follow" to get the latest information quickly.
Have a nice day today.
-------------------------------------
(BTCUSDT 1D chart)
This decline created a new trend line.
This added a period of volatility around July 31st.
If the HA-High indicator is generated at the 115854.56 point, the key is whether it can be supported and rise around that point.
If it falls below the HA-High indicator, there is a possibility of a downward trend.
Therefore, it is necessary to look at which support and resistance points the price is maintained at as it passes the volatility period around July 18 (July 17-19).
-
Since the StochRSI 80 indicator is formed at the 116868.0 point, it is important to be able to maintain the price above 116868.0 if possible.
Therefore, assuming that the HA-High indicator will be generated at the 115854.56 point, the key is whether there is support around 115854.56-116868.0.
Next, since the M-Signal indicator on the 1D chart is rising above 116696.20, we need to check if it is supported by the M-Signal indicator on the 1D chart or around 116696.21.
-
So far, we have talked about how to maintain an upward trend by breaking through a certain point or section.
That is,
- The K of the StochRSI indicator should be below the overbought section and should show an upward trend with K > D.
- The PVT-MACD oscillator indicator should show an upward trend. (If possible, it should be above the 0 point.)
- The OBV indicator of the Low Line ~ High Line channel should show an upward trend. (If possible, it should be maintained by rising above the High Line.)
I said that when the above conditions are met, there is a high possibility that the upward trend will continue.
On the other hand, in order to change to a downward trend,
- The DOM (60) indicator should be created and show resistance near the DOM (60) indicator.
- When the HA-High indicator is generated, it should show resistance near the HA-High indicator.
- When the K of the StochRSI indicator falls from the overbought zone, it should switch to a state where K < D and show a downward trend. (However, caution is required as volatility may occur when K reaches around the 50 point.)
- The PVT-MACD oscillator indicator should show a downward trend. (If possible, it is better if it is located below the 0 point.)
- The OBV indicator of the Low Line ~ High Line channel should show a downward trend. (However, it should show a downward trend in the state where OBV < OBV EMA is present.)
When the above conditions are satisfied, there is a high possibility of a downward trend.
Among these, the most intuitive thing to know is whether the DOM (60) indicator and the HA-High indicator are generated.
This is because, in order to first switch to a downward trend, a signal that the current price position is a high point must appear.
The DOM(60) indicator is an indicator that indicates the end of the high point.
Therefore, if the DOM(60) indicator is generated, it is likely to be a high point.
However, since it can be supported and rise near the HA-High indicator, you should check whether there is support in the HA-High ~ DOM(60) section and respond accordingly.
The HA-High indicator is an indicator created for trading on the Heikin-Ashi chart, and if it falls below the HA-High indicator, it is likely to be a point where a downtrend will begin.
-
Since the same principle applies to any time frame chart you trade, it is easier to understand the chart and determine the timing of the start and end of the transaction.
However, the basic trading method must be a split trading method.
The reason is that if it rises in the HA-High ~ DOM(60) section, it is likely to show a stepwise upward trend, and if it falls in the DOM(-60) ~ HA-Low section, it is likely to show a stepwise downward trend.
This basic trading method, that is, buying near the HA-Low indicator and selling near the HA-High indicator, will eventually make you familiar with day trading, which will have an effective influence on finding a buying point when making mid- to long-term investments.
It is wrong to say that you are good at mid- to long-term investments when you are not good at day trading.
You were just lucky.
Unfortunately, this kind of luck cannot last.
-
Thank you for reading to the end.
I hope you have a successful transaction.
--------------------------------------------------
- This is an explanation of the big picture.
(3-year bull market, 1-year bear market pattern)
I will explain more details when the bear market starts.
------------------------------------------------------

HolderStat┆BTCUSD above $120BINANCE:BTCUSDT has surged past $129,000 following a breakout from long-term consolidation. The chart shows a clean continuation structure with the next resistance between $135,000–$137,000. Momentum remains on the side of bulls.

HelenP. I Bitcoin will go to a correction after a strong impulseHi folks today I'm prepared for you Bitcoin analytics. If we look at the chart, we can see that the price has recently made a powerful impulse upward, breaking out of a long consolidation range between 110500 and 102500. This range acted as a strong accumulation zone, where the price bounced multiple times from both support levels. After the breakout, Bitcoin gained momentum and pushed sharply toward the 122000 mark. Now, after this sharp rally, I believe a correction is highly probable. Often, after such strong bullish moves, the market tends to pull back to retest the trend line or previous breakout zones. In this case, the trend line has been respected several times and now aligns with the 117500 area, which also acts as local support. That’s why I consider this zone to be a logical target for the correction. I expect BTCUSD can drop from the current highs and retest the trend line near 117500 points - that is my main goal for this setup. If the trend line holds, buyers may return to the market and push price higher again. Given the strong impulse, the breakout from consolidation, and the importance of the trend line, I remain bearish short-term and expect a drop toward 117500 points. If you like my analytics you may support me with your like/comment ❤️
Disclaimer: As part of ThinkMarkets’ Influencer Program, I am sponsored to share and publish their charts in my analysis.

BTCA gap is currently in play. For further upside, it would be healthy to see a full or partial fill in the near term, followed by a strong reaction.
Such a move would signal strength and validate bullish momentum.
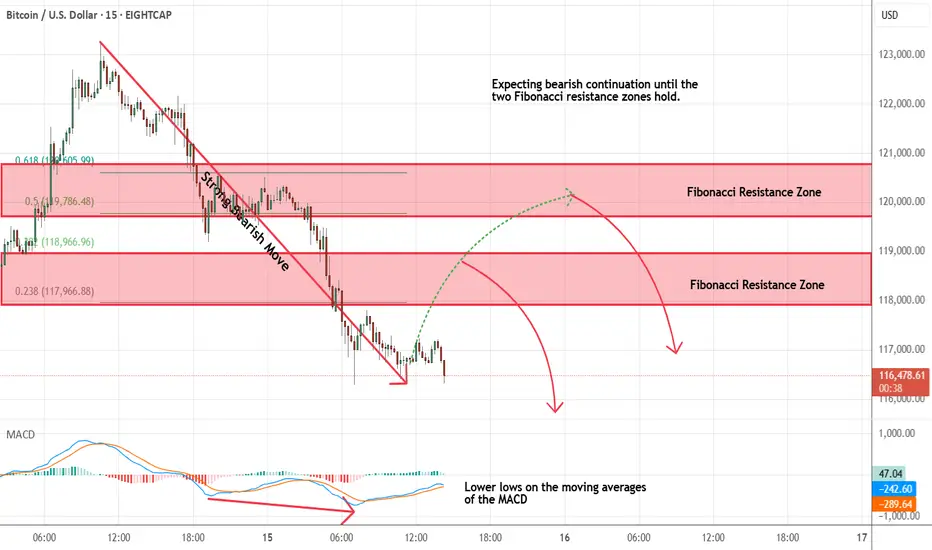
Bitcoin - Looking To Sell Pullbacks In The Short TermM15 - Strong bearish move.
Lower lows on the moving averages of the MACD.
No opposite signs.
Currently it looks like a pullback is happening.
Expecting bearish continuation until the two Fibonacci resistance zones hold.
If you enjoy this idea, don’t forget to LIKE 👍, FOLLOW ✅, SHARE 🙌, and COMMENT ✍! Drop your thoughts and charts below to keep the discussion going. Your support helps keep this content free and reach more people! 🚀
--------------------------------------------------------------------------------------------------------------------
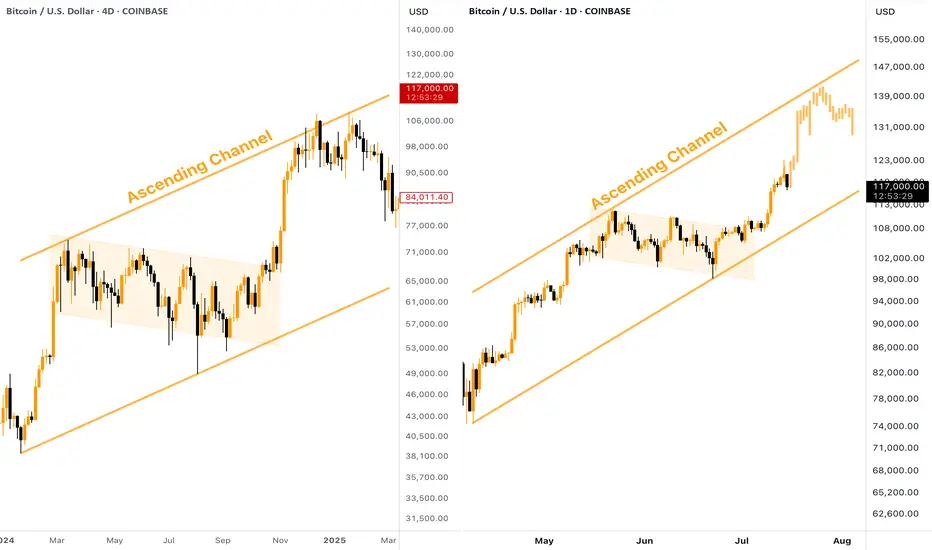
[BITCOIN] - Where is Potential TOP (ATH) of the Bull Cycle?Many people wondering where is the potential TOP of the current Bitcoin Bull Run? Besides setting a Fibo Retracement, we can take a look at the past. The current situation on CRYPTOCAP:BTC chart reminds me of what we've seen in the end of 2024, here is why:
Big ascending channel, price perfectly moves inside without breaking borders
Descending consolidation inside the bull flag
Strong breakout and pump towards the resistance of the channel
👉 According to this pattern, the target for the current Bitcoin upward move should be located in the $140,000 zone. Keep this in mind when planning your trades.
BITCOIN Will it go lower?Bitcoin (BTCUSD) pulled back rather aggressively yesterday after marginally breaking above $123000 and making a new All Time High (ATH).
We've mentioned before the similarities of this Bullish Leg to the April - May structure and so far the current pull-back having already touched the 0.236 Fibonacci retracement level, resembles the late April pull-back.
However, besides the 0.236 Fib, that pull-back also hit its 4H MA50 and rebounded, so that's a condition that hasn't been fulfilled. If it does, we are potentially looking for a Low around the $115k mark. Notice also how both fractals are supported by a Higher Lows trend-line exactly on their respective 4H MA100 (green trend-line) levels.
If BTC continues to replicate this pattern, we expect to see $140000 (+43.05% from the bottom) by early August.
Will the Support levels hold and push it that high? Feel free to let us know in the comments section below!
-------------------------------------------------------------------------------
** Please LIKE 👍, FOLLOW ✅, SHARE 🙌 and COMMENT ✍ if you enjoy this idea! Also share your ideas and charts in the comments section below! This is best way to keep it relevant, support us, keep the content here free and allow the idea to reach as many people as possible. **
-------------------------------------------------------------------------------
💸💸💸💸💸💸
👇 👇 👇 👇 👇 👇

BTC retracement comingBTC seems to follow the 2-2,5 stdv price structure. Based on simply stdv from last manipulation leg down it suggests we are now at reversal zone, and I expect price to retrace down. First reaction seems to support this plan. Aiming at $88,5K.
BTC/USD Technical Analysis — Educational BreakdownBTC/USD Technical Analysis — Educational Breakdown (July 13, 2025)
🔍 Market Context
Bitcoin (BTC/USD) is currently trading around $117,913, exhibiting a clear reaction from a well-defined resistance zone between $118,439 and $119,000. This resistance aligns with a previously unfilled 4H Bullish Fair Value Gap (FVG) — a price inefficiency left behind during a strong bullish move — which has now been filled, triggering a pause and reaction in bullish momentum.
🧠 Key Concepts Explained
📘 1. Fair Value Gap (FVG)
In Institutional Price Delivery models (often used in Smart Money Concepts), a Fair Value Gap represents an imbalance in price action — usually between the wicks of candles where price moved too quickly, leaving inefficient trading zones. Price often retraces to these areas before resuming its direction. Here, BTC has filled the 4H Bullish FVG, which acts as a magnet for price and a potential reversal point once filled.
📘 2. Liquidity Sweep
The chart highlights a Sell-Side Liquidity Sweep — this occurs when price dips below a key short-term low or consolidation range to trigger stop-losses and collect liquidity before making its next move. This move is typically engineered by larger market participants to capture orders before deciding on true directional intent.
📘 3. Resistance and Support
Resistance ($118,439 – $119,000): This area is acting as a supply zone where sellers are stepping in after price filled the FVG.
Support ($115,580): This level has previously provided demand and also holds liquidity (stop-losses from long positions), making it a probable target if bearish pressure follows through.
📈 Potential Trade Insight (Educational)
⚠️ This is not financial advice but an educational scenario based on the current technical setup.
Bearish Setup: If price rejects from resistance and forms a lower high, a short entry targeting the support zone at $115,580 could be considered, using a stop above $119,000.
Bullish Invalidator: A break and hold above $119,000 would suggest bullish continuation, potentially targeting higher time frame imbalances or resistance.
📚 Summary & Takeaway for Learners
This chart presents an excellent case study in understanding how institutional concepts like FVGs, liquidity sweeps, and key supply/demand zones interact in real price action. Traders can learn the following from this setup:
Price doesn’t move randomly — it often targets liquidity and imbalances.
Patience is key — waiting for confirmation at known reaction zones can improve trade accuracy.
Market context matters — a filled FVG at resistance combined with a liquidity sweep gives confluence to a bearish outlook.
