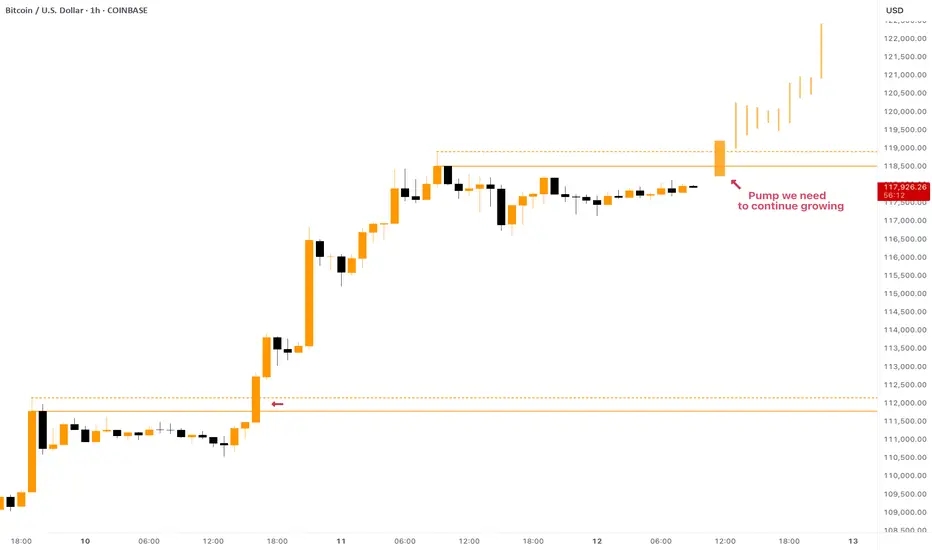
BITCOIN - Local Conditions for Growth ContinuationCRYPTOCAP:BTC showed us an astonishing growth from $108,000 to $118,000 in a few days! But what is next and where is the next target?
At the moment the price is consolidating below the ATH, in fact there are two resistances: $118,500 and $119,000. To continue pumping, Bitcoin has to break both of them with strong impulse.
To be honest , the current price development reminds me of what we've seen a couple days ago: breakout of the resistance -> consolidation below local highs -> strong breakout and growth continuation. Something similar can be expected now as well.
In the past couple of years CRYPTOCAP:BTC taught us a lesson of waiting no time to hop on the train . When it pumps - it does it quickly, just like it does it this time. So, waiting for the best entry near $109,000 - $110,000 might leave you behind while Bitcoin will be pumping towards $125,000.
Btc-e
Bitcoin DominationHistorical cycle data on the indicator points to the possible end of bitcoin's dominance growth. This may indicate the beginning of capital reallocation in favor of altcoins. At least until May 7 we will have a short-term altcoin season, but if we are lucky, even until the end of May.
⚠️ Caution Amid Geopolitical Factors
While a temporary altcoin season may be on the horizon, it's essential to consider broader economic factors. Ongoing trade tensions, particularly involving the U.S., could introduce volatility into the markets. Such geopolitical uncertainties might render the current altcoin rally a bull trap, with potential downturns in the summer months.

Beautiful Bitcoin breakout, as called. PLEASE SEE PROFILE FOR MORE INFO!
What an absolutely gorgeous Inverse Head & Shoulder for #Bitcoin.
Had suspicion this time WAS different for #BTC.
Let's talk ROUGH ESTIMATES for social #gold.
CRYPTOCAP:BTC is no longer a hard to anticipate as it's become an institutional asset. Follow the $, volume. ETF's are performing similar. Leveraged funds, not so much
Anyway, enjoy the ride #Crypto!
15% for MEME soonMEME is showing strength as market is bullish, I am expecting continuation with 15% minimum gain tomorrow.
NOT A FINANCIAL ADVICE
MANAGE YOUR RISK AND ALWAYS USE STOPLOSS

#BTC Update #6 – July 11, 2025🟠 #BTC Update #6 – July 11, 2025
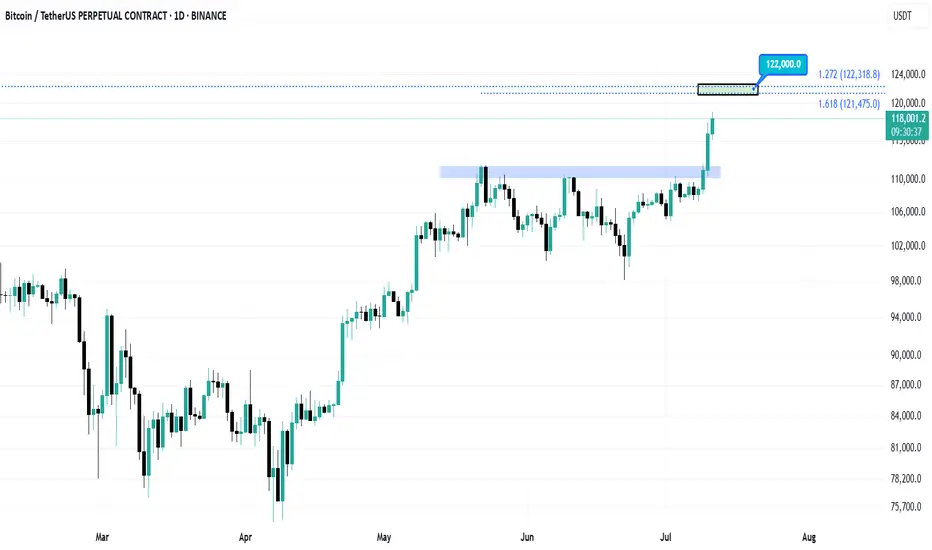
Bitcoin has surged nearly 9% from the supply zone and is currently trading around the $119,000 level. However, looking at the current volume, the momentum seems to be fading.
If a correction takes place, the potential support zones are:
✨First stop: $114,000
✨Second stop: $113,000
✨Third stop: $111,500
After a pullback, the next target may be around $122,000. However, macroeconomic risks are rising. The U.S. is considering a 500% tariff on Russia imports, and in the past, even a 100% tariff triggered a sharp drop in Bitcoin.
Since BTC has already made a significant move up, I don’t think opening a Long or Short position is wise at the moment. Just observing for now.

Bitcoin: Final Push in the 60-Day Cycle?Bitcoin appears to be making its final move higher within the current 60-day cycle. We could potentially see a push into the $121K–$122K range before a sharp correction takes us down to around $110K–$112K toward the end of the month, driven by the 3-day cycle timing.
After that, we’re likely to form a new 60-day cycle low, which could set the stage for a renewed move to the upside.
Is it time to go long?
At this point, the risk/reward doesn’t look favorable for new longs. Personally, I’m watching for one final push above $120K to consider opening a short position into the expected cycle low.

NETFLIX 1D MA50 test is a new buy opportunity.Netflix (NFLX) has been rising non-stop since the April 07 bottom on the 1D MA200 (orange trend-line). This bottom has been the latest Higher Low of the 3-year Channel Up that started on the June 14 2022 bottom.
This kickstarted its third long-term Bullish Leg. The previous two have been fairly similar (+210% and +195.93%) so we can assume a minimum total rise of +195.93% until the next top (Higher High of the Channel Up).
We can also see that on each Bullish Leg, after the initial rebound, the stock always tested the 1D MA50 (blue trend-line) around the 0.236 Time Fibonacci level. That has always been the best buy opportunity of that stage.
As a result, we believe that the recent short-term correction is a buy opportunity in disguise, targeting a Higher High at $2200.
Check out our previous analysis on Netflix:
-------------------------------------------------------------------------------
** Please LIKE 👍, FOLLOW ✅, SHARE 🙌 and COMMENT ✍ if you enjoy this idea! Also share your ideas and charts in the comments section below! This is best way to keep it relevant, support us, keep the content here free and allow the idea to reach as many people as possible. **
-------------------------------------------------------------------------------
💸💸💸💸💸💸
👇 👇 👇 👇 👇 👇

MicroStrategy ($MSTR) – Bitcoin Proxy Setting Up AgainMicroStrategy Incorporated NASDAQ:MSTR remains the definitive institutional proxy for Bitcoin exposure, uniquely combining its enterprise software operations with a high-conviction, leveraged Bitcoin accumulation strategy. Its $1.42B BTC purchase in April 2025 further cements this thesis, making MSTR a prime vehicle for traders seeking amplified BTC exposure via equities.
Since our May 5th analysis, MSTR has rallied ~14.61%. We’re now eyeing a re-entry opportunity on a pullback to the $394–$387 zone, aligning with technical support and previous consolidation.
🎯 Bullish targets remain unchanged: $490.00–$500.00, backed by Bitcoin strength and MicroStrategy’s unwavering strategy.
🔁 Re-entry: $394–$387
🟩 Targets: $490–$500
#MSTR #Bitcoin #CryptoStocks #BTC #StockMarket #TechnicalAnalysis #MicroStrategy #HighBeta #CryptoExposure #TradingSetup

Bitcoin’s Final Wave & Time Reversal Zone _ New ATH Loading?Today, I want to analyze Bitcoin ( BINANCE:BTCUSDT ) on the weekly time frame and answer these questions :
Can Bitcoin create a new All-time High(ATH) or not!?
At what price range can Bitcoin's uptrend end!?
When can we expect the uptrend to end!?
Please stay with me.
Bitcoin appears to have managed to break the Resistance lines , although we saw a fake break a few months ago , and it also appears to have a Hammer Candlestick Pattern in the previous weekly candle , which could signal the completion of Bitcoin's pullback to the Resistance lines(broken).
In terms of time , if we want to analyze the Bitcoin chart and look at Bitcoin's past, in general, the months of June(Average=-0.13%/Median=+2.20%) and especially July(Average=+7.56%/Median=+8.90%) have been among the most productive months for Bitcoin , and the months of August(Average=+1.75%/Median=-8.04%) and September(Average=-3.77%/Median=-4.35%) were the months when Bitcoin had a correction . Technical analysis tools show the end of the upward trend and the beginning of Bitcoin's correction at the Time Reversal Zone(TRZ=June 23 to August 4) .
In terms of Elliott Wave theory , Bitcoin appears to be completing the main wave 5 , as the main wave 3 was extended .
I expect Bitcoin to trend higher(+10%) in the coming weeks and create a new ATH . New ATH could be created in the Potential Reversal Zone(PRZ) and TRZ , and then we can wait for the start of the main correction .
What do you think about Bitcoin’s future movement? Can Bitcoin create a new ATH? When and at what price?
Note: If Bitcoin falls below $100,000, we should expect further declines.
Please respect each other's ideas and express them politely if you agree or disagree.
Bitcoin Analyze (BTCUSDT), weekly time frame.
Be sure to follow the updated ideas.
Do not forget to put a Stop loss for your positions (For every position you want to open).
Please follow your strategy and updates; this is just my Idea, and I will gladly see your ideas in this post.
Please do not forget the ✅' like '✅ button 🙏😊 & Share it with your friends; thanks, and Trade safe.

BitcoinThe next target for Bitcoin is $122,000.
I will update the chart when this target is reached.
Follow so you don't miss the next analysis.
Evolving Price & Candle Patterns: BitcoinLook what is happening here with the candle patterns and price action. In the most recent challenge of resistance something changed. Change is good. It can mean the end of this sideways period.
At (1) Bitcoin finds resistance and immediately starts a decent. The same happens at (2). When we reach (3) everything changes. (1) & (2) produced a low and lower low. The down-move was extended. (3) produced only two red candles, a strong higher low and the third day was a full green candle moving above the descending trendline resistance. The price pattern is now erratic, completely different to previous moves.
Now, consider (4). If the strong green candle was intended as a bull-trap, then we would expect a down-move to follow right after the peak, just as it happened with (1) and (2). But nothing, after (4), Bitcoin has been sideways within the bullish zone.
This change is good, bullish.
A drop can develop anytime but the market already had two changes to produce a down-wave, (3) and (4). The fact that a down-move didn't materialize means that the market has something different in store for us, change. This change is good because when resistance is challenged, prices tend to drop when the market is moving within a range. No drop can signal the end of the range trading which in turn can translate into the start of the next bullish wave.
If this idea turns out to be true, Bitcoin will start growing within days. Growth should be strong because consolidation has been happening for months.
Namaste.

BITCOIN =140-150kThe X-wave has formed in the form of a neutral triangle pattern, and eventually Bitcoin could once again touch $106,000 and move towards $140,000-150,000 with the completion of wave-e.
Good luck
NEoWave Chart

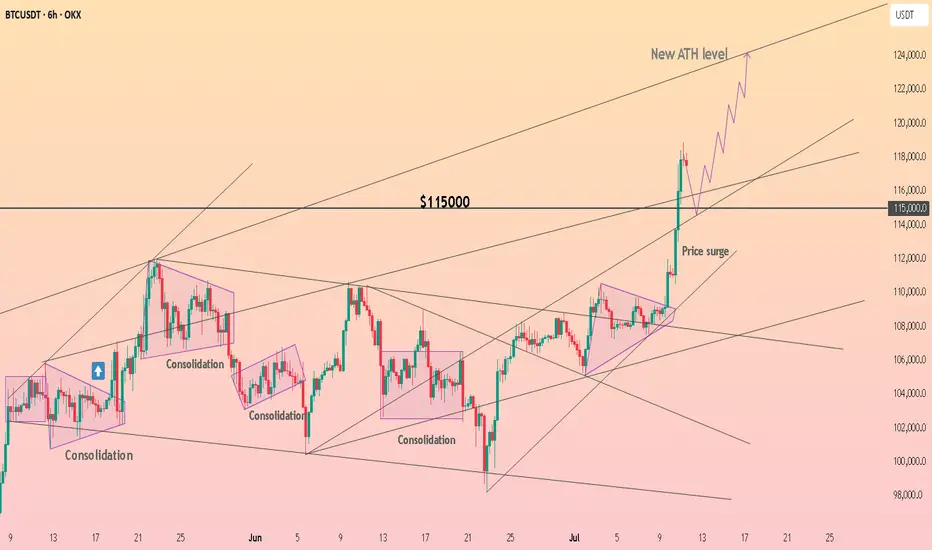
HolderStat┆BTCUSD above the $115kOKX:BTCUSDT broke out of its consolidation structure and surged past $115,000 resistance. The price is showing parabolic behavior as it targets the ATH level near $125,000. Structure remains bullish as long as the support base near $113,000 holds.
BITCOIN ABOUT TO CRASH HARD!!!!? (Be careful with your longs)I am sharing with you in this video the next CRYPTOCAP:BTC important resistances and support levels.
Together with the confirmations, it is said that if triggered, Bitcoin will start crashing hard, so be careful if you have overleveraged long positions opened right now!
Remember to always trade only with professional trading strategies and tactics, and make sure that your money management is tight!

BTC/USDT : Breaks Out – New Highs In Sight After Smashing $111K!By analyzing the Bitcoin (BTC) chart on the weekly timeframe, we can see that the price has finally started to rally as expected—successfully hitting the $111,700 target and even printing a new high at $111,999 with an impressive pump.
This analysis remains valid, and we should expect new all-time highs soon.
The next bullish targets are $124,000 and $131,800.
THE WEEKLY TF ANALYSIS :

BYCUSDTHello Traders! 👋
What are your thoughts on Bitcoin?
Bitcoin has broken above its descending trendline and formed a new higher high. The price is now in a consolidation phase, taking a short pause after the breakout.
We expect the bullish trend to remain intact. After a pullback to the broken trendline and some consolidation in the support zone, Bitcoin is likely to resume its upward move toward higher levels and new all-time highs.
The overall market structure remains bullish, and this consolidation phase could present a buy-the-dip opportunity.
Is Bitcoin ready for the next leg higher, or will the pullback go deeper? Share your view below! 🤔👇
Don’t forget to like and share your thoughts in the comments! ❤️

BITCOIN hit new ATH above $118k and isn't stopping there!Bitcoin (BTCUSD) broke above its previous All Time High (ATH) Zone and the buying pressure accelerated so much that it even crossed above the $118k level early in the E.U. session.
Technically the bullish trend doesn't seem to stop there as following the Bull Flag (we've analyzed this extensively the previous days) break-out of mid-May to June, the long-term Bullish Leg that started on the April 07 2025 bottom, is looking now for its 2nd Phase (extension).
Based on the previous two Bullish Legs since 2024, we should be expecting at least a +91.12% rise from the April bottom, as so far the symmetry among all three fractals is remarkable. Equally strong Bearish Legs (around -32%) of roughly 112 days each, gave way to the Bullish Legs, which supported by the 1W MA50 (blue trend-line) pushed the market higher.
If this pattern continues to be replicated, we should expect this Leg to peak a little over $140000 before the next correction.
Do you think we'll get there? Feel free to let us know in the comments section below!
-------------------------------------------------------------------------------
** Please LIKE 👍, FOLLOW ✅, SHARE 🙌 and COMMENT ✍ if you enjoy this idea! Also share your ideas and charts in the comments section below! This is best way to keep it relevant, support us, keep the content here free and allow the idea to reach as many people as possible. **
-------------------------------------------------------------------------------
💸💸💸💸💸💸
👇 👇 👇 👇 👇 👇

BITCOIN's PUMPs are Getting LARGER this Bull Market...However, it may take a bit longer to realize those expansionary moves.
If Bitcoin adheres to the established cycle pattern, we can anticipate a minimum surge of 103% that should carry us into the fourth quarter of this year.
Consolidation ----> Fake breakdown ----> then expansion.
Are you ready?

Skeptic | Bitcoin Deep Dive: Rate Hikes, War Tensions & TriggersInterest Rates: The Big Picture
Let’s start with the Federal Reserve’s move—interest rates jumped from 4.25% to 4.5% . What’s the deal? Higher rates mean costlier borrowing , so businesses and folks pull back on loans. This drains liquidity from risk assets like Bitcoin and SPX 500, slowing their uptrend momentum or pushing them into ranges or dips. Now, mix in the Israel-Iran conflict escalating ? Straight talk: risks are sky-high , so don’t bank on wild rallies anytime soon. My take? BTC’s likely to range between 97,000 and 111,000 for a few months until geopolitical risks cool (like Russia-Ukraine became “normal” for markets) and the Fed starts cutting rates. Those two could ignite new highs and a robust uptrend. Let’s hit the charts for the technicals! 📊
Technical Analysis
Daily Timeframe: Setting the Stage
You might ask, “If 100,000 support breaks, does that mean we’ve formed a lower high and lower low, flipping the trend bearish per Dow Theory?” Absolutely not! Here’s why: our primary uptrend lives on the weekly timeframe, not daily. The daily is just a secondary trend. If 100K cracks, it only turns the secondary trend bearish, leading to a deeper correction, but the major weekly uptrend stays intact.
Spot Strategy: No spot buys for now. Economic and geopolitical risks are too intense. I’ll jump in once things stabilize. 😎
Key Insight: A 100K break isn’t a death sentence for the bull run—it’s just a shakeout. Stay calm!
4-Hour Timeframe: Long & Short Triggers
Zooming into the 4-hour chart, here’s where we hunt for long and short triggers:
Long Trigger: Break above 110,513.92. We need a strong reaction at this level—price could hit it early or late, so stay patient for confirmation.
Short Trigger: Break below 101,421.65. Same vibe—watch for a clean reaction to tweak the trigger for optimal entry.
Pro Tip: These levels are based on past key zones, but time outweighs price. Wait for a reaction to nail the best entry. Patience is your edge! 🙌
Bitcoin Dominance (BTC.D): Altcoin Watch
As BTC dips, BTC.D (Bitcoin’s market share) is climbing, meaning altcoins are taking a bigger beating. Don’t touch altcoin buys until the BTC.D upward trendline breaks. They haven’t moved yet—you might miss the first 10-100%, but with confirmation, we’ll catch the 1,000-5,000% waves together. 😏
Shorting? If you’re shorting, altcoins are juicier than BTC—sharper, cleaner drops with more confidence. Patience, patience, patience—it’s the name of the game.
Final Thoughts
My quieter updates lately? Blame the geopolitical chaos, not me slacking . I’m hustling to keep you in the loop with clear, actionable insights. here, we live by No FOMO, no hype, just reason. Protect your capital—max 1% risk per trade, no exceptions. Want a risk management guide to level up? Drop a comment! If this analysis lit a spark, hit that boost—it keeps me going! 😊 Got a pair or setup you want next? Let me know in the comments. Stay sharp, fam! ✌️

Bitcoin : Missed $100K? Don’t Miss What’s Coming Next!!MARKETSCOM:BITCOIN BINANCE:BTCUSDT continues to show exceptional strength and strong bullish momentum. When we look back at the charts from 2023 and 2024, a clear and reliable pattern stands out. Each time Bitcoin touched the 50 EMA on the weekly chart, it triggered a significant rally that led to new all-time highs. That same setup appears to be forming once again.
MARKETSCOM:BITCOIN tested the 50-week EMA around the $75,000 level and has since bounced with conviction. The price has reclaimed the $100,000 mark and is now challenging previous all-time high resistance. Historically, a successful bounce from this key moving average has not only signaled recovery but also sparked explosive upside moves.
Following this repeating pattern, the current cycle target is positioned at $150,000. A clean breakout above the current resistance zone could act as the trigger that launches Bitcoin into uncharted territory. The technical structure remains bullish, momentum is clearly accelerating, and the overall trend continues to favor the upside.
This moment represents a textbook Buy and HODL opportunity. Technical indicators are aligning, market sentiment is turning increasingly optimistic, and all signs suggest that Bitcoin could be preparing for another historic rally. Stay ready for what could be the next big move.
Follow Our Tradingview Account for More Technical Analysis Updates, | Like, Share and Comment Your thoughts

BTC - I made this chart in early 2021Shocking to login in to Trading View after 4 years to see this chart saved and how well the fib targets and channel is playing out.

Bitcoin Trajectory for Q2 and Q3 2025Bitcoin clearly have lack of buying pressure at this stage. Currently price creating a Rounded Top structure, which we've seen in the past. Projected target zone for this pattern is swing to $107,000 and swing down to $91,000.

The Final Parabola: What History Says About Bitcoin’s July MovesIf you’ve been following here for a while, you know we’ve been nearly pinpoint in calling all the moves for Bitcoin. The altcoin market, not so much, but check out previous TAs to catch up on my perspective.
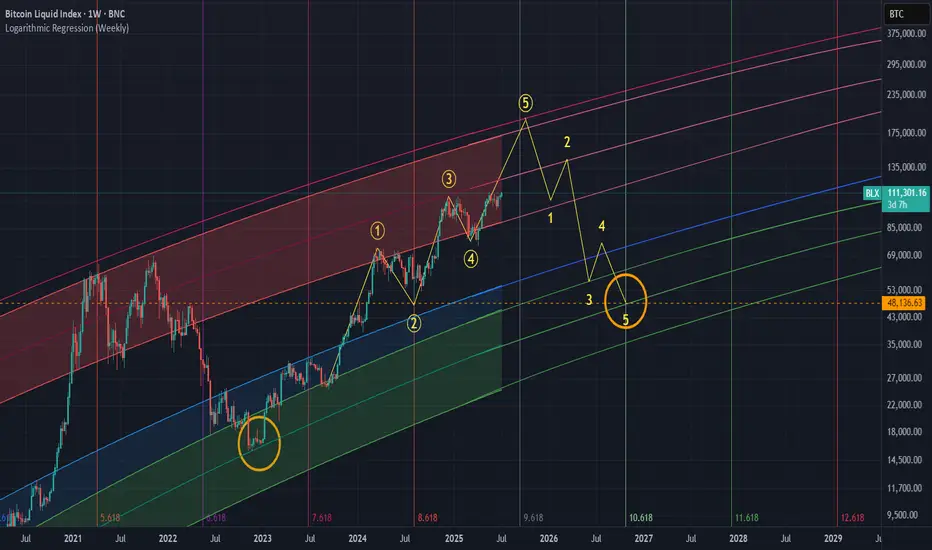
The two wave counts you see on the main chart have been in place for many months, I believe since around October 2024. As you can see, things have been playing out perfectly so far. The four year cycle continues to follow its path.
If the same thing happens this cycle like the last two, we should see a top sometime between October and December 2025, anywhere from 185K to 225K, followed by a cycle low somewhere around 48K in October 2026.
Bitcoin’s Julys
Every July during the 4th cycle year, Bitcoin begins its final parabolic run. This has happened without fail since the beginning of the Bitcoin Index chart. July consistently marks a major bottom, and then it's off to the races. The “only up” period that follows typically lasts 4 to 6 months and happens just once every four years like clockwork.
Here we are once again, the 4th year of the cycle, in July. Bitcoin has just hit all time highs and we've had a Hash Ribbon buy signal.
The perfect storm is brewing. Like always, the stars align in the second half of the 4th year of the Bitcoin cycle.
Time Cycles and Fibs
Looking at this time wave chart, we can see that every two waves like clockwork have marked a top. The next major wave appears to land in December 2025.
If we zoom into this smaller time wave, it has pinpointed the bottom of every small wave so far. The fact that we are once again at a bottom in July during the 4th year of the Bitcoin cycle is just another sign of the magical stars aligning.
This smaller Fibonacci sequence I’ve been tracking has already hit twice and predicted two major moves. The next dates to watch are August 2025 and January 2026.
There’s plenty of talk about an extended cycle. But during the last bull run, many traders and analysts said the same thing. In the end, Bitcoin topped out at exactly the same timeframe as the previous cycles.
If we reach the top of this model in Q4 2025, and we see a Pi Cycle Top signal along with a Mayer Multiple over 2.0, that will be our trigger.
If you've been sidelined this entire time, it's now or never. You don’t want to be the one buying in at 185K in Q4 2025 when everyone is calling for a million dollars. The time to act is now.