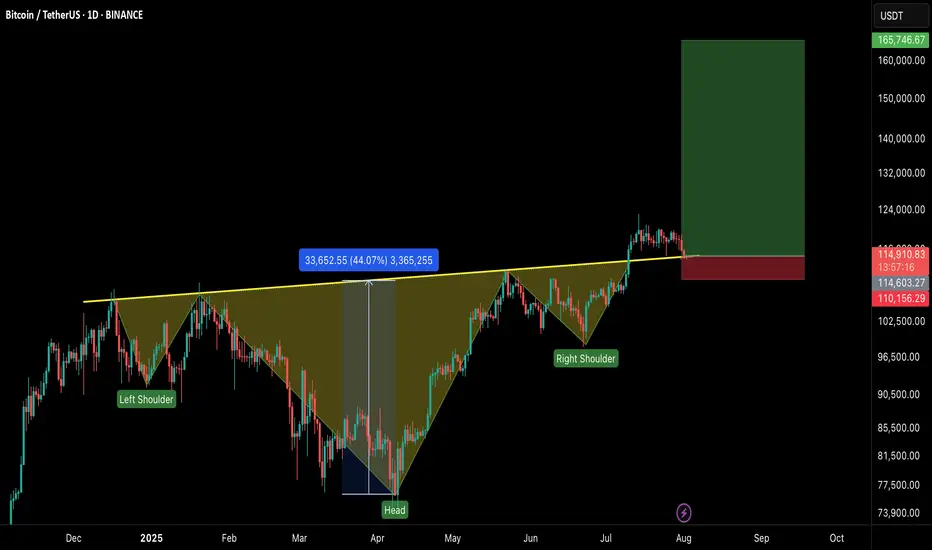
#BTCUSDT – Healthy Correction, Not the End!Bitcoin is currently experiencing a healthy pullback after an impressive run, testing the neckline of the Inverse Head & Shoulders breakout on the 1D timeframe.
🔹 Current Market View:
BTC is retesting the neckline of the IHS pattern, which now acts as a strong support zone.
Price is holding near $113K–$115K, which is crucial for maintaining bullish momentum.
This dip is a healthy correction, flushing out over-leveraged positions and preparing for the next leg up.
🔹 Key Levels:
Support Zone: $113,000 – $115,000
Immediate Resistance: $120,000 – $122,500
Breakout Target: $165,000+ on the next bullish wave
🔹 Market Sentiment:
Holding above the neckline keeps the bullish structure intact.
If the support holds, we can expect continuation to new highs once buying pressure returns.
A daily close below $112K would signal caution and delay the next rally.
💡 Tip: Don’t panic on these red candles. Healthy corrections are part of a sustainable uptrend.
Btc-e
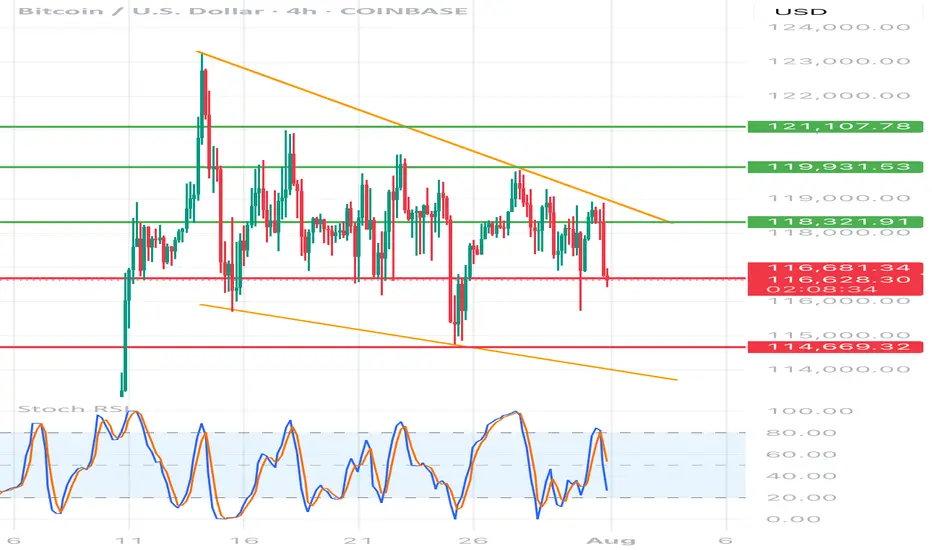
BTC/USD 4h chart🔸 Formation: Triangle descending (descending)
• Upper trend line (orange) - inheritance, connects lower and lower peaks.
• Lower support line (red) - approx. 116,700 USD - key support, tested many times.
🔻 Support
USD 116,700
Tested several times, currently threatened
🔻 Another support
USD 114,669
Target level when struck with a triangle
🔼 Resistance
USD 118,321
The nearest resistance - the former level of support
🔼 Resistance
USD 119,931
Local peak
🔼 Strong resistance
USD 121,107
Upper level of structure
📉 STOCHASTIC RSI (lower indicator)
• Line cutting and a decrease in the purchase area (> 80) towards the center.
• No extreme sales signal, but the trend begins to be negative.
⸻
📌 Applications and possible scenarios:
🔻 Bearish script (more technically likely):
• If BTC breaks below USD 116,700 with a 4H candle closure, possible:
• a decrease around USD 114,669 (lower limit of the triangle)
• Even lower - around 113,500-112,000 USD with an increased volume
🔼 Bullly script (less likely but possible):
• needed quick breaking above USD 118,300 and maintaining above this level
• Then the goal will be USD 119,931, and then possible traffic up to USD 121.107
⸻
📍 Summary:
• We see classic triangle descending-pro-draft formation.
• Support 116,700 USD very close to breaking - if it falls, down movement can be dynamic.
• Stochastic RSI coincides with the deterioration of the moment.
• The inheritance scenario seems dominant, unless there is a strong demand and over 118,300 USD.
Bitcoin willIt hold if we stay above $115k ?? Fixing up last post I’ve deleted now as image was not good. Anyway simple RSI and Auto Fib Retrace with only general CRYPTOCAP:BTC market understanding backing this. This isn’t finacial advice at all. It’s pure speculation this post and anything related to it. I’m
Not a finacial advisor and I will not be held accountable for anyone’s actions that I didn’t do.

BITCOIN: THE PERFECT STORM - MULTIPLE BREAKOUT PATTERNS ALIGNED⚠️ CRITICAL SUPPORT LEVELS
🛡️ Support 1: $115,000 (-3%) - Triangle support
🛡️ Support 2: $110,000 (-7%) - Channel support
🔴 DANGER ZONE: $105,000 (-11%) - Multiple pattern failure
So...
Strategy: Quick profits on pattern completion 🎨
Entry: $115k (Triangle breakout confirmation) 📊
Stop Loss: $114k below (Tight risk management) ❌
Target: $125k (+10%) ✅
Time Horizon: 2-3 weeks 📅
Risk/Reward: 1:6 🎯
________________ NOTE _____________
⚠️ This is not financial advice. Bitcoin is highly volatile and risky. Only invest what you can afford to lose completely. Always do your own research and manage risk appropriately 🚨
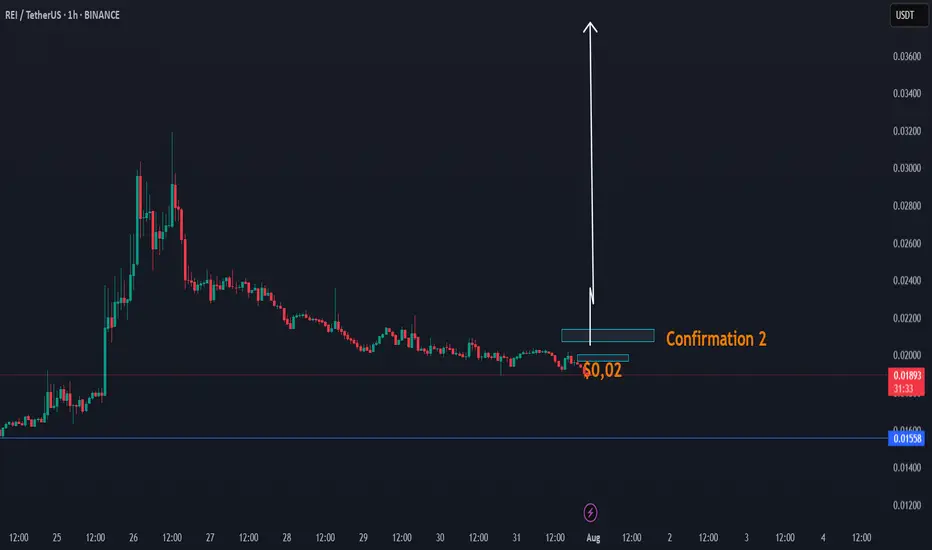
DAY UPDATE REI/USDT THE INCREASE CANDLE OF UP $0,03 - $0,05REI is an interesting coin since the update of Q4
We have seen that this coin was able to increase to $0,031 and until here $0,018 zone, a return to where we are now. There is a high chance that this coin can recover next 24H if this coin is able to confirm the confirmation $0,02 - $0,021
This coin, as before, was targeted at $ 0.02 and had low volume. We expect that if it comes back to $ 0.02, it will be confirmation of the volume, which can take the trend with a candle to up $0,03
REI CONFIRMATIONS ZONE
Higher time frame
When you look normally at this coin, then this coin is in a trend line of breakdown. This can change with the next confirmations. The question is, are we going to see again $0,02 the next 24h? If yes high chance of a break.
We also have a cycle update 2025, check it here, expecting $0,90
BITCOIN's Situation (1h) !!!The price is within an ascending triangle, which could be encouraging. However, since crypto doesn't always follow patterns, it might break down from below and correct to around $116K!
Best regards CobraVanguard.💚

BitcoinBitcoin/TetherUS (BTC/USDT) Trading Analysis - Jul 15, 2025
Key Observations:
Price Movement:
Current Price: $117,692.46
24h Change: -2,148.72 (-1.79%)
Range: Low of $116,250.00 to High of $119,940.83
The price is currently near the lower end of the day's range, indicating bearish pressure.
Support and Resistance:
Support Levels:
Strong Support: $112,000.00 (marked as S/L)
Intermediate Support: $113,500.00 and $110,000.00
Resistance Levels:
Immediate Resistance: $119,900.00
Higher Resistance: $120,000.00 and $122,500.00
Profit Levels:
The "Profit" section lists potential take-profit targets, with the highest at $135,000.00.
The price has recently dipped below the $120,000.00 psychological level, suggesting weakening bullish momentum.
Trend Context:
The chart spans from June to September, but the current price action (July) shows consolidation after a potential pullback from higher levels.
The presence of multiple support levels ($112K–$116K) suggests a critical zone for buyers to defend.
Actionable Insights:
Bearish Short-Term: The price is below key levels ($119,900–$120,000) and has broken below $118,250.00. A retest of support at $112,000.00 is plausible.
Bullish Reversal Signal: If BTC holds above $112,000.00 and reclaims $120,000.00, it could target $122,500.00 or higher.
Risk Management: A break below $112,000.00 (S/L) may trigger further downside toward $110,000.00 or lower.
Conclusion:
The market is currently in a corrective phase. Traders should monitor the $112,000.00 support for potential reversals or breakdowns. A close above $120,000.00 would shift bias to bullish.

BONK Setup – Watching for Retracement After 200%+ RallyBONK has surged over 200% in recent weeks. We're now eyeing a retracement to a key support zone that could offer a prime entry for the next leg higher.
📌 Trade Setup:
• Entry Zone: $0.00002240 – $0.00002500
• Take Profit Targets:
o 🥇 $0.00004050 – $0.00004800
o 🥈 $0.00005500 – $0.00006500
• Stop Loss: Just below $0.00002000

Bitcoin - Up trend go on Bitcoin - Up trend go on
as we mentioned before our long plan from range low is go on
soon that weoul be a time to close it by parts

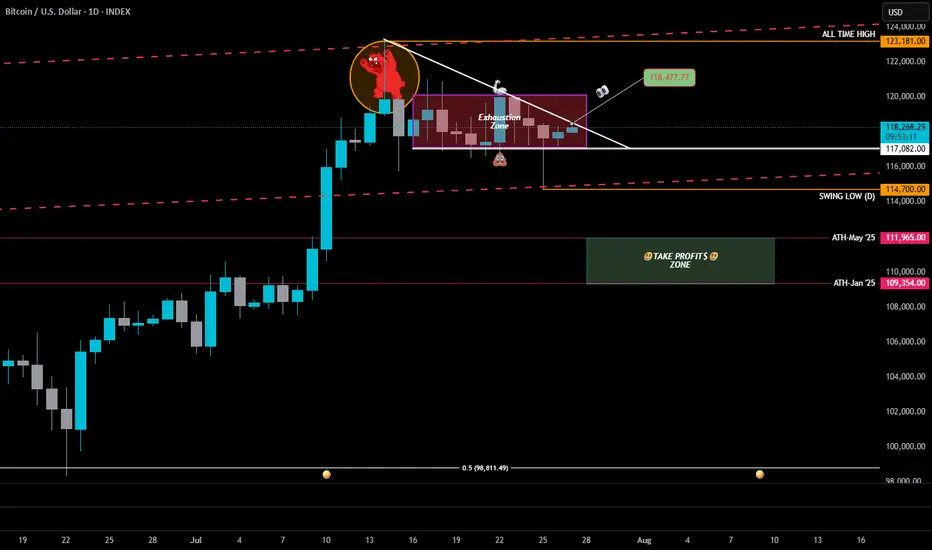
BTC Exhaustion Zone Update: The Bulls Charged… But the Zone HeldExhaustion Zone Update: 2025–208
📉 Exhaustion Zone Update: The Bulls Charged… But the Zone Held
On Friday, BTC dipped to 114,700, printing a fresh Daily Swing Low — a classic liquidity grab. The bulls stormed in for reinforcements, pushed price back up late in the day…
but once again, the Exhaustion Zone stood its ground.
BTC closed lower than Thursday, and since then? Pure chop.
Feels like both bulls and bears took the weekend off to watch Netflix.
—
🔻 The Downward Trendline Still Rules
Today, it’s simple: Bulls must close above 118,477.
That’s the trendline test — hesitation here, and the bears come clawing.
Usually I’d say, "give the bulls until Monday"...
but this year has shown us one thing:
🐋 The Whales Hunt on Sundays.
If the bulls don’t step up today, we might learn the hard way why it’s called the Exhaustion Zone.
—
📉 The Risk if Bulls Fail
BTC already gathered all the bulls it could down at the Daily Swing Low — and they’re tired.
If they can’t break out, the High-Powered Short Zone (dashed red lines) will take over.
The bears? Heavy. Angry. Overdue for a window jump.
🎯 Next floors down:
• May ATH → 111,965
• January ATH → 109,354
That’s the Take Profit$ Zone 👇
And honestly? I’m letting a small short position ride in case the evil whales take us all the way to the 50% level (98,811).
—
📌 The Alpha View
To the bulls: It’s showtime.
Either close above 118,477 today…
or the All-Time High Parade might just reroute — straight down the fire escape. 🐻🔥
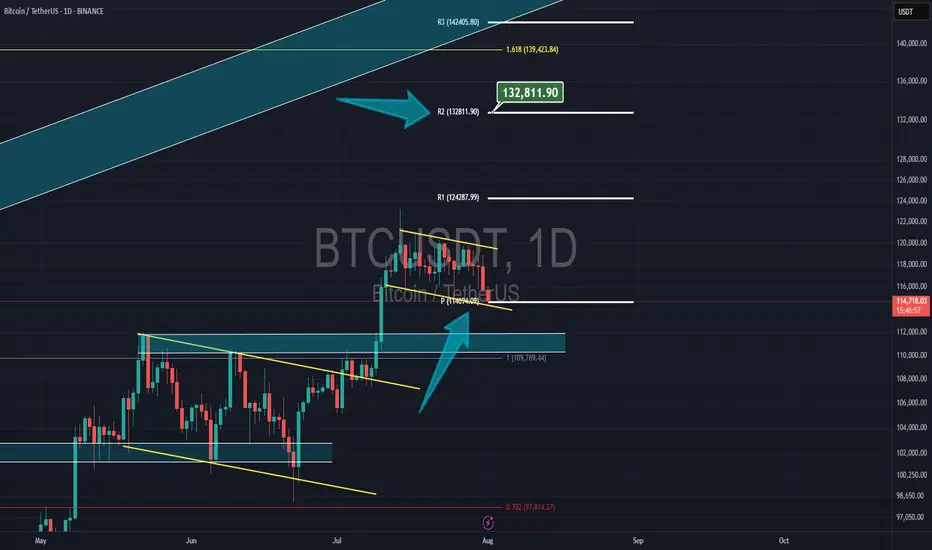
Bitcoin & NEW monthly PivotBitcoin had a correction yesterday but now its still above the new monthly pivot at $14,700 and my target is the 2nd resistance of the pivot at $132,800
#BTC Update #13 – Aug 01, 2025#BTC Update #13 – Aug 01, 2025
Bitcoin has approached the lower edge of its current channel and received a reaction from there. However, in the current timeframe, the ongoing candle seems willing to pull back again. The MA200 band held the previous candle well, which also represented the bottom of the current channel. There is high liquidity between the $113,200 and $121,000 zones. I believe Bitcoin will continue to move by sweeping through this region. Therefore, I think Bitcoin’s current target is to reach around the $118,000 level with a 3% push move.
If Bitcoin does not make this move and chooses to pull back instead, it may go as far as filling the imbalance at the $110,000 level. The last impulsive move was made around 20 days ago, and since then, the chart has been progressing with a correction of a correction. As long as there’s no close below $107,500, the uptrend will remain intact in the long term. However, if the $107,500 level is broken with a strong candle, we can say that Bitcoin has turned bearish on the 4-hour timeframe. For now, this doesn’t seem very likely. I believe Bitcoin’s next move will target the $118,000 region, continuing to clear out the liquidity accumulating in the upper ranges. However, this channel will need to break at some point.

BTC USD 180K BIG HOW?Trends and price targets is how, but realistically, it looks like 134k in the short term.
Drop is wicked if it were to occur, takes price to literally 12k, which you want to go all in if that occurs.
55k is another drop zone.
Otherwise, it looks fairly bullish.
buy zone marked in green,
sell in red.
watch the trends
and price targets are pretty accurate usually.
good luck!!
Custom charts by request.

ADA Setup – Eyeing Entry After 70%+ RallyCardano (ADA) has surged over 70% in recent weeks. A healthy pullback is underway, and we’re watching the key support zone for a potential long entry targeting the next leg higher.
📌 Trade Setup:
• Entry Zone: $0.65 – $0.67
• Take Profit Targets:
o 🥇 $0.98 – $1.15
o 🥈 $1.50 – $1.60
• Stop Loss: Just below $0.62

Could this be the end of Bitcoin’s trend?The Current State of Bitcoin’s Trend: Has the Uptrend Come to an End...?
Based on recent analyses, Bitcoin has exited its 4-hour channel over the past few days, and there is still a possibility for further correction. However, this does not mean that the uptrend for Bitcoin is over.
My targets for Bitcoin remain the same as before: 123,700 and 129,710. It’s even possible that we might see a wick above these prices.
For those with more capital who are looking to buy Bitcoin, there are two good entry levels:
110,880
109,770
Everything else is clearly shown on the chart. Please be cautious, as there will likely be high volatility once the market opens.
Be sure to open the analysis link and boost the analysis with your likes.

Long-Term Technical Outlook: Critical Decision Point Approaching
The chart illustrates a long-term technical structure where the price has been following an ascending channel after a prolonged bearish trend. However, recent price action indicates a breakdown below the green ascending trendline, raising concerns about a potential shift in market sentiment.
Currently, the $117 level is acting as a pivotal support zone. A sustained breakdown below this level — and more critically, below the red lower trendline — would validate the bearish scenario. This could trigger a deeper correction phase, with downside targets aligned along the red projection path. Such a move may lead to significantly lower price levels in the medium to long term.
🔽 Bearish Scenario:
If the price fails to hold above $117 and breaks below the red trendline, this would confirm the start of a bearish leg. Based on historical structure and projected trajectories, this could result in a descent toward the $93 level initially, with the possibility of extending further downward depending on market conditions.
🔼 Bullish Scenario:
On the other hand, if the price manages to reclaim the green trendline and more importantly, stabilize above the $204 resistance zone, it would signal renewed bullish strength. Such a move would open the path toward higher highs, potentially re-entering the previous upward channel and continuing the macro uptrend.
🧭 The price structure is now approaching a decisive zone, where either a confirmation of bearish continuation or a bullish recovery will likely unfold. Both scenarios have been visually outlined — green lines indicating bullish continuation, and red lines representing bearish momentum.
📌 Note: This analysis is for educational purposes only and should not be interpreted as financial advice.

Reversal from Channel Bottom or a Real Breakdown? Identifying th
🎯 BTCUSDT - Analysis
🔹 Analysis Date: 1 August 2025
📉BTCUSDT:
Price is currently moving inside an ascending channel and has touched the bottom of the channel again, offering a potential buy opportunity.
However, for those seeking a low-risk entry, the zone around 118,000 could be ideal—if price returns to the channel and confirms support.
Although it seems the channel’s lower boundary might break, this could be a fake break to mislead traders before a rebound.
The support at 110,000 is a crucial short-term level; if it fails, a deeper correction toward 98,090 or even 94,000 is likely.
Our targets remain at the upper boundary of the channel.
⚠️ Risk Management Tip: Wait for confirmation near 118,000 if unsure, and always size positions based on overall volatility.

BITCOIN 2025 TOP PREDICTION!This chart represents the M2 Money Supply / BTCUSD correlation with an 84-day delay.
You can see that the M2 Money Supply has formed a double top (with a lower high) in late September.
The price of bitcoin tops out 525–532 days after the halving in every cycle.
What does this mean?
In my opinion, bitcoin will continue to follow the direction of M2 in a highly correlated manner. This would mean that BTC's top is only 2 months away.
What price will bitcoin top?
That I'm not entirely sure of yet. The M2 / BTC correlation can be placed in a plethora of different scales. However, it currently looks like the top will be BELOW $200,000.
I hope to be proven wrong, but as of right now, bitcoin is following previous cycles perfectly (excluding the fact that we created a new ATH prior the halving, this was because of ETFs).
Given diminishing returns (and assuming that "supercycle" is not reached), $135,000 - $190,000 top in late September makes sense.

Strategy Hit SupportMSTR should easily hold $246 and make its way back up to $418 and form it's next support there.
Good luck!


Bitcoin held the $115k level ┆ HolderStatBINANCE:BTCUSDT is currently in a triangle formation just above key support near 112,000. The price recently dipped below short-term support, likely triggering stop-losses, but still holds inside a bullish structure. If momentum builds, a push toward 125,000+ is likely. The trend remains intact above 110,000.
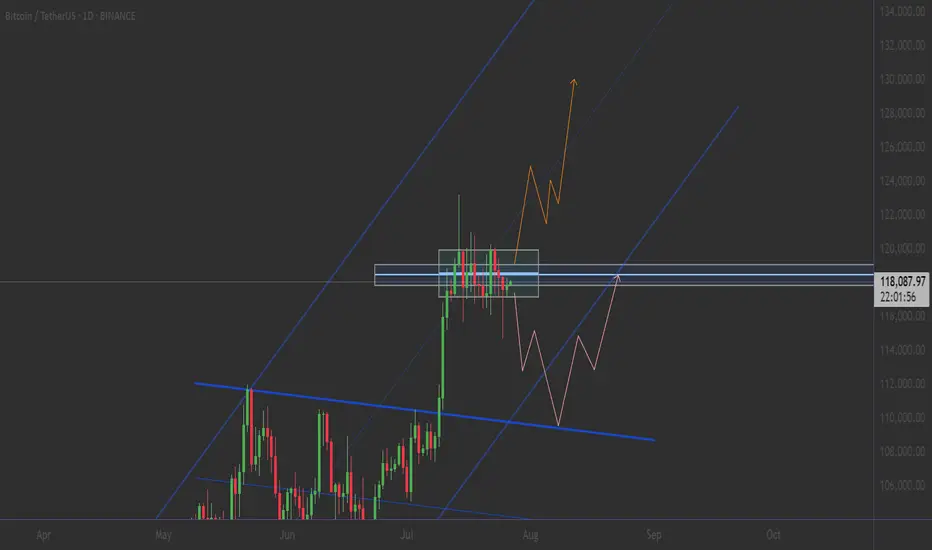
TradeCityPro | Bitcoin Daily Analysis #140👋 Welcome to TradeCity Pro!
Let’s dive into the Bitcoin analysis. Yesterday, the interest rate decision by the US Federal Reserve was announced, and once again, just like the past few months, it remained unchanged. Let’s see what impact it had on Bitcoin.
⏳ 4-Hour Timeframe
In the 4-hour timeframe, after the announcement of the unchanged interest rate and Powell’s speech, Bitcoin printed a red candle on the support zone and even wicked lower, but then recovered and the price returned back into the box.
✔️ Basically, we can say that this month’s rate decision had no real impact on the market, and Bitcoin is still moving inside its range box. The fact that the support zone wasn’t lost is a positive sign for the continuation of the trend.
⭐ But the important point is this: if the uptrend is going to continue, the price must print a higher high or at least a level equal to 120041, and in my opinion, if for any reason a lower high gets printed, the chances of breaking below 116829 significantly increase.
📊 I currently have no new position on Bitcoin, and all my entries are below 110000. But if 120041 breaks, I’ll open a long position for the next bullish wave that Bitcoin might start.
💥 A major trigger for starting a new leg is the 61.67 level on the RSI. As long as RSI remains below this level, there’s no bullish momentum in the market — and considering that the number of touches to 116829 has increased, the probability of a correction is also rising.
❌ Disclaimer ❌
Trading futures is highly risky and dangerous. If you're not an expert, these triggers may not be suitable for you. You should first learn risk and capital management. You can also use the educational content from this channel.
Finally, these triggers reflect my personal opinions on price action, and the market may move completely against this analysis. So, do your own research before opening any position.

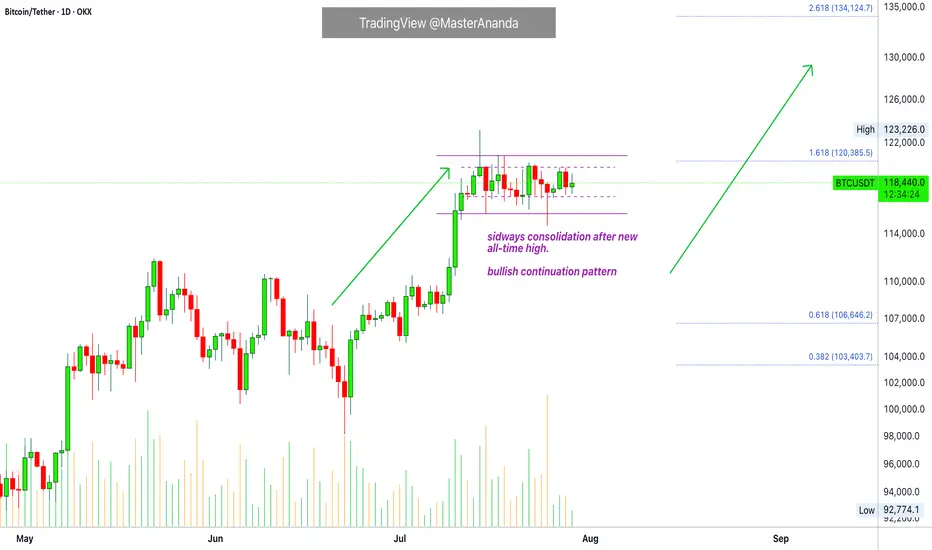
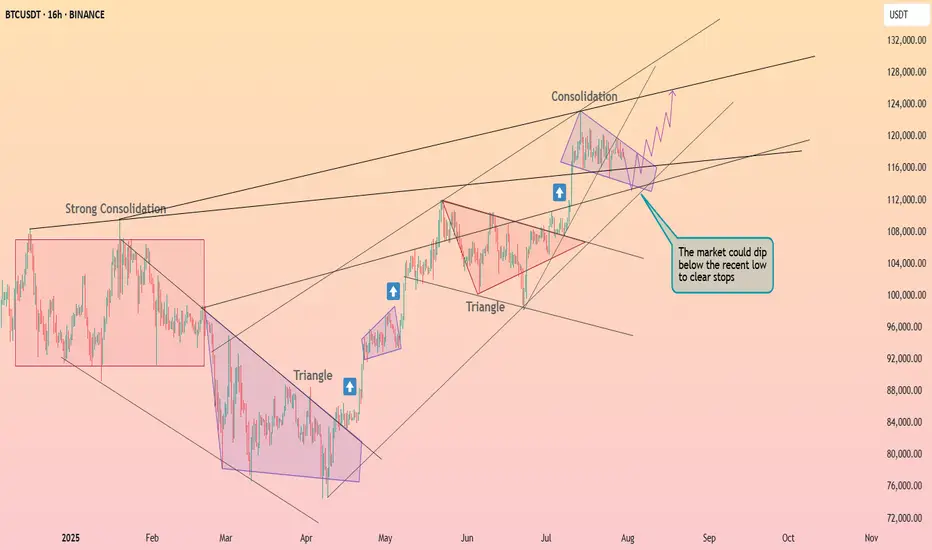
Bitcoin & The Altcoins —Name Your AltcoinBitcoin is sideways right now and is moving in a very tight and narrow range. All the action has been happening between $117,000 and $120,000 based on candle close since 11-July. This is bullish, think about it.
Bitcoin hits a new all-time high and next thing you know it turns sideways very close to resistance. The only drop was short-lived and everything sold was quickly bought. Why is Bitcoin consolidating so close to resistance? It is preparing to move ahead.
What happens when Bitcoin moves forward after so much recovery? Everything experiences a positive cycle. This is a very strong signal.
This chart allows for more whipsaw as you know nothing else is possible in a trading range. We predict the pattern to resolve bullish, but there can be swings to either side. A swing down just as it happened 25-July. A swing up just as it happened 14-July. This is always possible but the end result won't change. Bitcoin will continue sideways but when the sideways period is over, you will not see a move toward $110,000 or $100,000. The break of the trading range will confirm the advance toward $135,000 next month. Bitcoin is likely to continue in the same mode. While Bitcoin consolidates the new advance, the altcoins grow. In this way the entire market continues to recover and grow month after month after month.
Name Your Altcoin
Leave a comment with your favorite altcoin trading pair and I will do an analysis for you. I will reply in the comments section. Make sure to include any questions you might have beforehand.
If you see a comment with a pair you like, boost and reply so these can be done first.
Thanks a lot for your continued support.
Namaste.