BTC – 15min Reversal Structure & Fibonacci ReclaimWe’re currently witnessing a potential short-term reversal on BTC’s lower timeframe after a volume-supported breakdown and sweep of local lows.
🔍 Key Observations:
Price swept liquidity at local lows (~103,929.27)
Entered into a clear reaccumulation box with responsive buyers
Volume profile shows prior POC just above – room for fill
Fibonacci retracement aligns with key structure:
0.5 = 104,372.94
0.618 = 104,268.23
1.0 = 104,816.60 (final high target for this impulse)
📈 Potential Play:
Entry Zone: Just above the sweep candle (104,100–104,200)
Target 1: 0.382 at 104,477
Target 2: 104,816.60
Invalidation: Close below 103,926
🧠 Mindset:
This is a classic liquidity sweep → reaction → reclaim pattern. If BTC flips the 0.5 level with strong momentum, a short squeeze toward the 104.8K area becomes likely.
Great opportunity for scalpers or day traders.
Let me know if you want this turned into a long-form breakdown or sent in another format.
Btc-e

BTCUSD: Israel-Iran conflict like October 2024.Despite the Middle East tension, Bitcoin remains long term bullish on its 1W technical outlook (RSI = 63.167, MACD = 6883.200, ADX = 33.150). It remains supported on its 1D MA50, in fact in the same manner it was during the previous Israel-Iran conflict. I was on October 26th 2024, when Israel launched three waves of strikes against 20 locations in Iran and other locations in Iraq, and Syria. Simila to the June 13th 2025 attacks. It is more than striking how similar the two price patterns are. Assisted by the U.S. elections on November 5th 2024, a massive rally followed the Middle East conflict. A repeat of that may very well send Bitcoin to $150,000 and above.
## If you like our free content follow our profile to get more daily ideas. ##
## Comments and likes are greatly appreciated. ##

BTC Approaching Key Confluence Zone: Pivot + PRZ + LiquidationsBitcoin ( BINANCE:BTCUSDT ) appears to have broken the Support lines and is currently declining .
In terms of Elliott Wave theory , Bitcoin appears to be completing a corrective wave C . The corrective wave structure is a Zigzag Correction(ABC/5-3-5) .
I expect Bitcoin to start rising again from the Support zone($104,380-$103,660) , Potential Reversal Zone(PRZ) , Cumulative Long Liquidation Leverage($104,471-$103,124) , Monthly Pivot Point , Support line , and 50_SMA(Daily) , and the small CME Gap($106,190-$106,150) will also fill.
Note: Stop Loss: $102,520
Please respect each other's ideas and express them politely if you agree or disagree.
Bitcoin Analyze (BTCUSDT), 1-hour time frame.
Be sure to follow the updated ideas.
Do not forget to put a Stop loss for your positions (For every position you want to open).
Please follow your strategy and updates; this is just my Idea, and I will gladly see your ideas in this post.
Please do not forget the ✅' like '✅ button 🙏😊 & Share it with your friends; thanks, and Trade safe.

SUPER Long Setup – Confluence of Fibonacci and Major SupportSUPER has retraced into a strong confluence zone, aligning with the 61.8% Fibonacci level and a major support area. The $0.55–$0.58 range offers a solid opportunity to enter a long swing trade.
📌 Trade Setup:
• Entry Zone: $0.55 – $0.58
• Take Profit Targets:
o 🥇 $0.75 – $0.90
o 🥈 $1.05 – $1.20
• Stop Loss: Daily close below $0.50


ADAUSDT IDEAlower lows and a flat. Seems to be a trade opportunity which ever side it goes off breaking its current structure.

BTC
BTC is currently in local consolidation. After a liquidity grab on either side, potential entry setups may form via the AMD pattern — but only if key conditions are met.
No setup — no trade. Wait for confirmation.

₿itcoin: Holding steadySince our last update, Bitcoin has traded in a relatively stable range. As expected, there's still a strong case for the crypto leader to climb into the upper blue Target Zone between $117,553 and $130,891. However, a deeper pullback below the $100,000 mark remains a real possibility before that move unfolds. Regardless of the path it takes, we continue to expect Bitcoin to reach this upper zone, completing green wave B. From there, a corrective wave C—also in green—is likely to follow, driving the price down toward the lower blue Target Zone between $62,395 and $51,323. This move would mark the end of the broader orange wave a. For now, we’re watching for a potential b-wave recovery before the final leg lower toward the bottom of blue wave (ii) takes shape. That said, there's still a 30% chance that blue wave (i) isn’t done yet and could extend significantly above $130,891 before any meaningful correction begins.
📈 Over 190 precise analyses, clear entry points, and defined Target Zones - that's what we do.

HolderStat┆BTCUSD forms a triangleBYBIT:BTCUSDT trades inside a narrowing flag between 104 k and 108 k. A push past 108 k activates the pole projection toward 112–114 k and possibly the ATH rail; rejection sends price to retest 102 k support before the next offensive.

BITCOIN All boxes checked. Couldn't be more bullish than this!Bitcoin (BTCUSD) has filled numerous bullish conditions with the latest being holding the 1D MA50 (blue trend-line) as Support. This is basically the 3rd time testing and holding it since June 05. Even if that doesn't hold, we have the 1D MA200 (orange trend-line) directly below it as the ultimate long-term Support.
This trend-line just so happens to be exactly on the neckline of the Right Shoulder on the long-term Inverse Head and Shoulders (IH&S) pattern that has been in development since December 17 2024.
On top of all these, the market also formed a 1D Golden Cross a month ago, always a strong long-term bullish signal. IH&S patterns typically target their 2.0 Fibonacci extension, which sits at $168000.
Is that another indication that Bitcoin is going after 150k at least on its next run? Feel free to let us know in the comments section below!
-------------------------------------------------------------------------------
** Please LIKE 👍, FOLLOW ✅, SHARE 🙌 and COMMENT ✍ if you enjoy this idea! Also share your ideas and charts in the comments section below! This is best way to keep it relevant, support us, keep the content here free and allow the idea to reach as many people as possible. **
-------------------------------------------------------------------------------
💸💸💸💸💸💸
👇 👇 👇 👇 👇 👇

99K and 97.5K potential targetsMorning folks,
As you can see, not occasionally last time we chose only nearest 107K and 109K targets. Market indeed looks a bit heavy. Now short-term context turns bearish and we consider reaching of 99K target as rather high. Next potential target area is 97.K - butterfly target and daily Fib support.
Obviously now we do not consider any new longs and need some clear signs of sentiment changing, that we do not have by far. Let's see what will happen around support area

BTC - 106k now, whats next?106k is a rotational move, means the top liquidity get inside at first hence and then it goes down, watch it for

BVOL: Volatility Compression Before the Final ExpansionThis chart might not get as much attention as BTC dominance or TOTAL, but Bitcoin volatility (BVOL) is one of the cleanest leading indicators when it comes to identifying market tops and bottoms.
Just look at the history — every major macro top or bottom in BTC price has correlated with a peak or trough in this chart. Whether it was the ATH in March 2024, the October 2024 breakout, or the deep pullbacks into key lows, BVOL has nailed the timing with precision.
Right now, we’re seeing volatility compressing hard — currently sitting around 13.17 — and heading into my targeted demand zone which has historically marked major inflection points.
🧠 What does this mean?
Volatility this low = market indecision + positioning. It’s when liquidity gets sucked dry before a major expansion move.
My expectation is:
- BVOL will soon hit demand and reverse
- BTC will complete its current correction
- Once volatility expands again, it likely aligns with a reversal and move into new ATHs — the final bullish phase of this cycle
Just like in past cycles, low volatility precedes explosive directional moves. This current compression is setting the stage — once the lid comes off, the move is usually fast and decisive.
⚠️ Watch this closely. BTC correcting into demand + BVOL hitting this low = confluence for the next trending leg.
Big picture context:
We’re deep into the 4-year cycle structure, with a macro top expected into Q3/Q4 2025. This setup supports the idea that after this consolidation and volatility reset, BTC could make one final leg up before distribution begins.
Let the volatility tell the story — it usually whispers before it roars.

Bitcoin 4-Year Cycle Structure – Technical BreakdownBitcoin 4-Year Cycle Structure – Technical Breakdown
This chart examines Bitcoin’s historical 4-year cycle behaviour, focusing on the repeating market structure observed across the last three cycles: Bull Market → Bear Market → Accumulation/Recovery → Halving → Expansion.
Key Observations:
🔹 Cycle Timing Consistency
Each of the past three cycles has shown a consistent duration between the halving and the final bull market peak—typically between 500–550 days. Based on that timing, the current cycle suggests we are still ~100 days away from a potential macro top.
🔹 Post-Halving Correction is Expected
Corrections shortly after the halving have historically marked mid-cycle retracements, not macro tops. The current pullback is structurally aligned with the 2017 and 2021 expansions, where Bitcoin consolidated before pushing to final highs.
🔹 Altcoin Market Segments Lagging
TOTAL2 (Total Market Cap excluding BTC)
TOTAL3 (Excluding BTC & ETH)
OTHERS (Altcoins excluding top 10 by market cap)
All remain below their prior cycle all-time highs, which historically occurs before the full market cycle concludes. These segments often accelerate after BTC has established dominance, typically in the later stages of the bull market.
🔹 USDT Dominance Suggests More Upside
USDT.D is still trending down, which historically reflects increasing risk appetite and capital rotation into crypto assets. Prior cycle tops have aligned with much lower dominance levels, indicating further downside risk for USDT.D, and potential upside for crypto markets.
Conclusion:
Despite short-term volatility, the technical structure across Bitcoin and broader market indicators suggests the cycle remains in its expansion phase. Timing models, altcoin lag, and dominance signals all point to further upside potential before a full cycle peak is in.
1W:
1M:

Bitcoin Crash to $93k is Progressing Well! But be Careful Now!I have explained the price action of Bitcoin, shared my insights on what will happen next, and updated my previous idea on $BTC!
Smash the rocket button if you feel the Bitcoin bearish vibe!

BTC – Stop Hunt at the Edge of ValueThis is what a liquidity raid looks like.
Price just swept the bottom of the range, tapped into the low-volume zone (as seen on the volume profile), and reclaimed — classic sign of a trap sprung.
Key points:
The downtrend line labeled “comp” = compression — bulls forced to capitulate into a thin zone
High probability deviation with stop run and reclaim — this fuels the next move up
The green box shows risk-defined entry off the sweep low
Targeting the prior high: 106,787
Volume imbalance filled = no inefficiency above — price can now move cleanly
Execution mindset:
Trap spring → retrace into structure → expansion
Risk is clear, liquidity is engineered, structure remains
Late shorts just became the fuel.
Watch the reclaim of the box top. If that flips support, we ride momentum.
📈 For more setups like this — including pre-breakout traps — check the description in the profile.

BTCUSD: Nowhere near a top yet.Bitcoin remains neutral on its 1D technical outlook (RSI = 47.257, MACD = 443.000, ADX = 29.912) due to high volatility recently but the bullish long term trend is intact and even more so, hasn't yet started the year-end rally. The Mayer Multiple Bands have always priced a Cycle's Top on their red trendline so no matter how high that may seem from the current market price, the TP zone should be between the orange (2 Stdev above) and red (3 Stdev above) trendines. Minimum TP = 200,000 for this Cycle.
## If you like our free content follow our profile to get more daily ideas. ##
## Comments and likes are greatly appreciated. ##

SUI Long Swing Setup – Confluence of Support and Fibonacci LevelSUI has pulled back into a key confluence zone, aligning with both the 61.8% Fibonacci retracement and horizontal support. We’re now eyeing the $2.70–$2.80 area for a potential long entry.
📌 Trade Setup:
• Entry Zone: $2.70 – $2.80
• Take Profit Targets:
o 🥇 $3.40 – $3.60
o 🥈 $4.00 – $4.20
• Stop Loss: Daily close below $2.65

BTC on the Daily: Bearish Structure Locked In?So, on the daily, price is in a clear bearish context.
PSAR is bearish
MLR < SMA < BB center
We're about to close below the 50MA
Price already broke below the Higher Lows trendline and the December 2024 top
At this point, it all depends on the macro situation and the FOMC tone tonight.
If the outcome is positive, there's a chance price rebounds.
If not, the chart looks ready to dive.

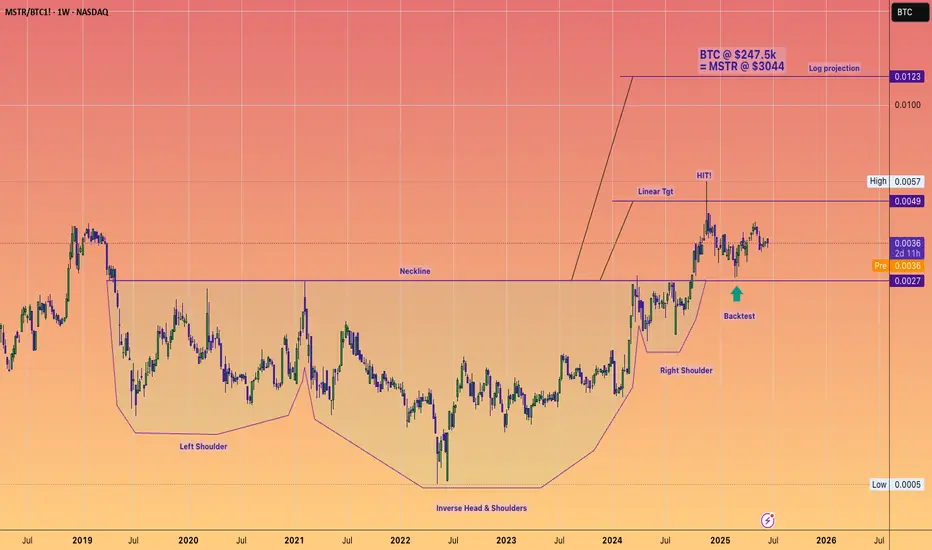
Could Microstrategy be a 1 Trillion dollar mcap company?!Microstrategy and Michael Saylor evoke a spectrum of opinions, with analysts offering a diverse range of potential future valuations.
High risk, high reward!
The destiny of Microstrategy’s market capitalization is clearly linked to Bitcoin’s performance. The company has been utilizing debt to acquire the cryptocurrency, aiming to create significant spreads. This leverage is the reason why the stock has significantly outperformed Bitcoin throughout 2024.
I am confident that Bitcoin can indeed reach $200k, with a potential upper price target of $250K for this cycle, indicating a potentially explosive Q3 and Q4.
The lingering question is how much additional FOMO and premium Saylor can cultivate for his leveraged vehicle in such an environment?
That's why charting is such a key component to any personal investing strategy IMHO, as we navigate these markets.
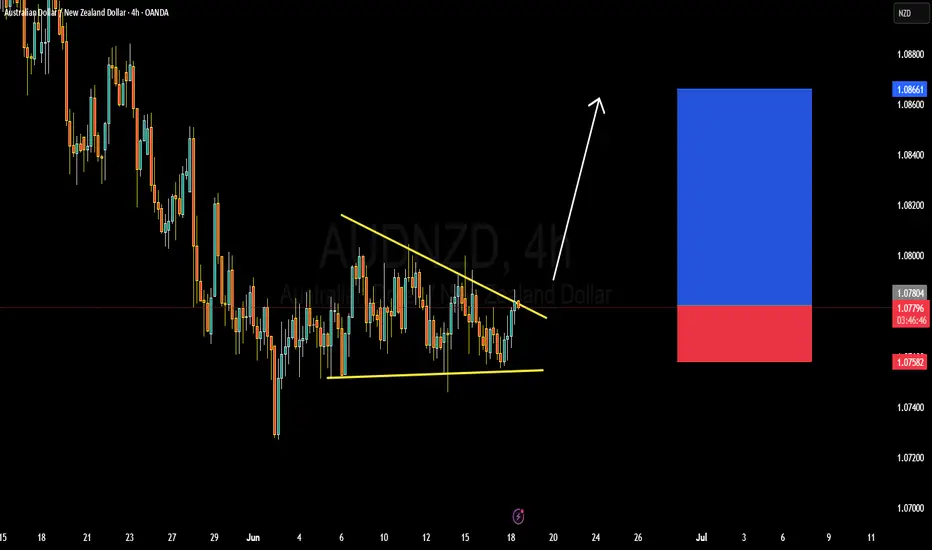
AUDNZD BULISH OR BEARISH DETAILED ANALYSISAUDNZD is currently trading around 1.078 and is on the verge of a classic falling wedge breakout, which is a bullish reversal pattern typically seen after a downtrend. Price action has been compressing within this wedge formation, suggesting an imminent breakout as market pressure builds. A decisive close above the descending trendline would be a powerful signal of bullish continuation, with a near-term upside target of 1.086. The structure has held multiple rejections at both resistance and support, highlighting strong accumulation behavior from institutional participants.
Fundamentally, the Australian dollar is gaining relative strength due to the Reserve Bank of Australia maintaining a hawkish tone, supported by persistent inflation and labor market resilience. In contrast, the Reserve Bank of New Zealand recently surprised the market by signaling a potential end to its hiking cycle, citing slower growth and inflation moderation. This divergence in monetary policy outlook is creating favorable conditions for AUDNZD bulls, particularly as global risk appetite improves and commodity-linked currencies gain traction.
Technically, this 4-hour chart pattern aligns perfectly with recent AUD strength across the board, particularly in pairs like AUDUSD and AUDJPY which have broken key resistance levels. The tight consolidation near the wedge’s upper boundary, coupled with bullish candlestick formations, suggests buyers are stepping in ahead of the breakout. With a clean invalidation below 1.075, the risk-reward ratio here is compelling, especially for momentum traders looking to catch an impulsive leg higher toward 1.086 and beyond.
This setup is high-conviction. AUDNZD is poised for a breakout that aligns with both technical and macro fundamentals. As a professional trader, I’m tracking this setup closely, and any confirmation candle above the trendline will trigger my entry. I expect bullish continuation in line with AUD’s broader strength and NZD’s underperformance.
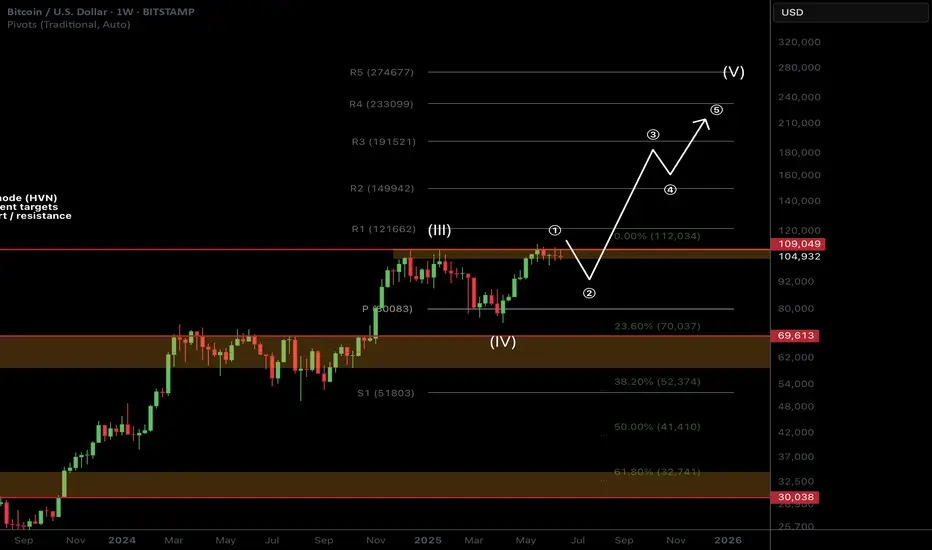
BTC Macro Analysis☕ 𝙂𝙈. CRYPTOCAP:BTC macro analysis update...
📈 𝙇𝙤𝙣𝙜 𝙩𝙚𝙧𝙢 outlook remains unchanged and recent price action is barely a blip on the weekly chart. SD+2 target is still $211k as a blow off top.
📉 𝙎𝙝𝙤𝙧𝙩 𝙩𝙚𝙧𝙢 outlook has investors looking lower towards the $92K target but this isn't guaranteed to be reached and price action may front those who wait.
War escalation's and retail selling are keeping price suppressed as price changes hands to private companies and large wallets.
The time for patience continues. Money is made in the sitting, weathering volatility, not flipping in and out of trades on every bit of news and price movement
𝙏𝙚𝙘𝙝𝙣𝙞𝙘𝙖𝙡 𝘼𝙣𝙖𝙡𝙮𝙨𝙞𝙨
Price is consolidating under all time high resistance. Consolidation under resistance has high probability of breaking out, the longer it remains the higher the probability.
Elliot Wave (EW) analysis suggests a motif wave ended with the poke above all time high (per the EW rules), with a wave 2 retracement underway. Price remains above the daily pivot (bullish) but below the DEMA (bearish). A triangle could still be forming but this is not my preferred EW count.
Safe trading
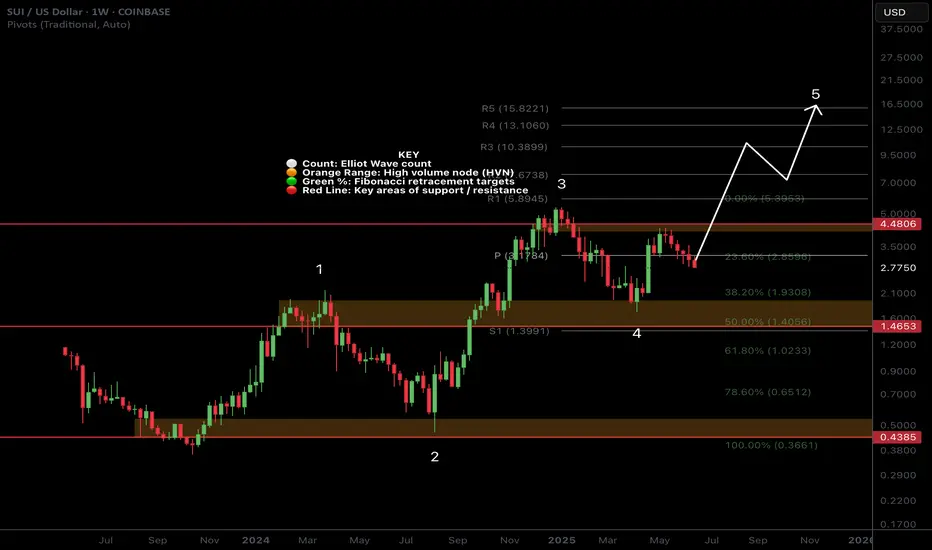
SUI Macro AnalysisCRYPTOCAP:SUI macro analysis update...
📈 𝙇𝙤𝙣𝙜 𝙩𝙚𝙧𝙢 outlook shows price action still outperforming most alts with a great rally recently. Target remains the R5 weekly pivot at $15
📉 𝙎𝙝𝙤𝙧𝙩 𝙩𝙚𝙧𝙢 outlook has price pulling back, looking to find a bottom between $2.3-2.65
War escalation's and retail selling are keeping price suppressed as price changes hands to private companies and large wallets.
The time for patience continues. Money is made in the sitting, weathering volatility, not flipping in and out of trades on every bit of news and price movement
𝙏𝙚𝙘𝙝𝙣𝙞𝙘𝙖𝙡 𝘼𝙣𝙖𝙡𝙮𝙨𝙞𝙨
Price is testing the weekly pivot and daily S1 pivot as support
Elliot Wave (EW) analysis was a strong, textbook motif wave with a wave 2 retracement underway. Wave 2 often extends to the 61.8 Fibonacci retracement of $2.4 but the alt-coin golden pocket is the 78.6 at $2.03. No surprises if we see that area revisited and could be a great buying opportunity.
Price has lost the daily 200EMA and DEMA which is bearish short term.
Safe trading