BTCUSD Potential For Bearish Drop | 9th February 2023Looking at the H4 chart, my overall bias for BTCUSD is bearish due to the current price being below the Ichimoku cloud, indicating a bearish market.
Looking for a sell stop entry at 22545.80, slightly below where the intermediate support is to ride the bearish momentum. Stop loss will be at 23439.00, where the recent high is. Take profit will be at 21310.00, where the overlap support is.
Any opinions, news, research, analyses, prices, other information, or links to third-party sites contained on this website are provided on an "as-is" basis, as general market commentary, and do not constitute investment advice. The market commentary has not been prepared in accordance with legal requirements designed to promote the independence of investment research, and it is therefore not subject to any prohibition on dealing ahead of dissemination. Although this commentary is not produced by an independent source, FXCM takes all sufficient steps to eliminate or prevent any conflicts of interest arising out of the production and dissemination of this communication. The employees of FXCM commit to acting in the clients' best interests and represent their views without misleading, deceiving, or otherwise impairing the clients' ability to make informed investment decisions. For more information about the FXCM's internal organizational and administrative arrangements for the prevention of conflicts, please refer to the Firms' Managing Conflicts Policy. Please ensure that you read and understand our Full Disclaimer and Liability provision concerning the foregoing Information, which can be accessed on the website.
BTC-USD

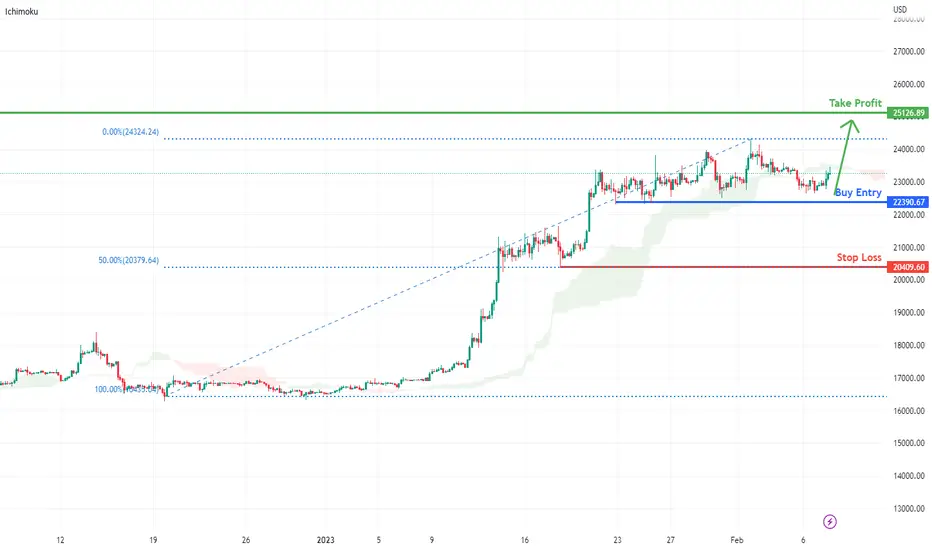
BTCUSD potential to previous swing highLooking at the H4 chart, my overall bias for BTCUSD is bullish. An ascending channel was created, expecting the price to retest at the key level 22390.67, which is our buy entry, taking profit at 25126.89 which is the previous swing high, and stop loss at 20409.6 which is the recent swing low.
Any opinions, news, research, analyses, prices, other information, or links to third-party sites contained on this website are provided on an "as-is" basis, as general market commentary, and do not constitute investment advice. The market commentary has not been prepared in accordance with legal requirements designed to promote the independence of investment research, and it is therefore not subject to any prohibition on dealing ahead of dissemination. Although this commentary is not produced by an independent source, FXCM takes all sufficient steps to eliminate or prevent any conflicts of interest arising out of the production and dissemination of this communication. The employees of FXCM commit to acting in the clients' best interests and represent their views without misleading, deceiving, or otherwise impairing the clients' ability to make informed investment decisions. For more information about the FXCM's internal organizational and administrative arrangements for the prevention of conflicts, please refer to the Firms' Managing Conflicts Policy. Please ensure that you read and understand our Full Disclaimer and Liability provision concerning the foregoing Information, which can be accessed on the website.
THE 500K $ Bitcoin scenarioIf we are back on some kinda like 2008 scenario we can imagine some possible trends
USD cp = 21.2 trillion atm
BTC cap = 451.06B$
According to pure speculation about the future I can immagine a bull scenario starting next year or sooner (maybe some spike at 6/3k before would be great)
A bear scenario would include more world bad news, regulations and the some tecnology shift
gl

BTCUSD in Bullish Consolidation Looking at the H4 chart, my overall bias for BTCUSD is bullish. An ascending channel was created. I am looking for buy entry when the price retraces at 22267.05. Take profit at 25126.89 which is the previous swing high, and stop loss at 20409.60 which is in line whit a 50% Fibonacci retracement.
Any opinions, news, research, analyses, prices, other information, or links to third-party sites contained on this website are provided on an "as-is" basis, as general market commentary, and do not constitute investment advice. The market commentary has not been prepared in accordance with legal requirements designed to promote the independence of investment research, and it is therefore not subject to any prohibition on dealing ahead of dissemination. Although this commentary is not produced by an independent source, FXCM takes all sufficient steps to eliminate or prevent any conflicts of interest arising out of the production and dissemination of this communication. The employees of FXCM commit to acting in the clients' best interests and represent their views without misleading, deceiving, or otherwise impairing the clients' ability to make informed investment decisions. For more information about the FXCM's internal organizational and administrative arrangements for the prevention of conflicts, please refer to the Firms' Managing Conflicts Policy. Please ensure that you read and understand our Full Disclaimer and Liability provision concerning the foregoing Information, which can be accessed on the website.

BTCUSD Potential to Previous Swing high Looking at the H4 chart, my overall bias for BTCUSD is bullish. An ascending channel was created, expecting the price to break the 1st resistance line at 24234.83 which is the recent overlap resistance, before heading towards the 2nd resistance at 24942.70 which is the previous swing high.
Looking for buy entry at 22768.47 which is the overlap support, take profit at 25126.89 which is the recent swing high, and stop loss at 20882.53.
Any opinions, news, research, analyses, prices, other information, or links to third-party sites contained on this website are provided on an "as-is" basis, as general market commentary, and do not constitute investment advice. The market commentary has not been prepared in accordance with legal requirements designed to promote the independence of investment research, and it is therefore not subject to any prohibition on dealing ahead of dissemination. Although this commentary is not produced by an independent source, FXCM takes all sufficient steps to eliminate or prevent any conflicts of interest arising out of the production and dissemination of this communication. The employees of FXCM commit to acting in the clients' best interests and represent their views without misleading, deceiving, or otherwise impairing the clients' ability to make informed investment decisions. For more information about the FXCM's internal organizational and administrative arrangements for the prevention of conflicts, please refer to the Firms' Managing Conflicts Policy. Please ensure that you read and understand our Full Disclaimer and Liability provision concerning the foregoing Information, which can be accessed on the website

BTCUSD Potential for Bullish Continuation | 3rd February 2023Looking at the H4 chart, my overall bias for BTCUSD is bullish due to the current price being above the Ichimoku cloud, indicating a bullish market.
Looking for a pullback buy entry at 23180.00, where the overlap support and 61.8% Fibonacci line is. Stop loss will be at 22137.60, slightly below where the intermediary support is. Take profit will be at 25212.00, where the previous swing high was.
Any opinions, news, research, analyses, prices, other information, or links to third-party sites contained on this website are provided on an "as-is" basis, as general market commentary, and do not constitute investment advice. The market commentary has not been prepared in accordance with legal requirements designed to promote the independence of investment research, and it is therefore not subject to any prohibition on dealing ahead of dissemination. Although this commentary is not produced by an independent source, FXCM takes all sufficient steps to eliminate or prevent any conflicts of interest arising out of the production and dissemination of this communication. The employees of FXCM commit to acting in the clients' best interests and represent their views without misleading, deceiving, or otherwise impairing the clients' ability to make informed investment decisions. For more information about the FXCM's internal organizational and administrative arrangements for the prevention of conflicts, please refer to the Firms' Managing Conflicts Policy. Please ensure that you read and understand our Full Disclaimer and Liability provision concerning the foregoing Information, which can be accessed on the website.

BTCUSD is now at Key resistance!Looking at the H4 chart, my overall bias for BTCUSD is bullish. There is an ascending channel was created, expecting the price to break the 1st resistance line at 23922.95 which is the recent overlap resistance before it heads towards the 2nd resistance at 25108.15 which is the previous swing high.
Looking for any price pullback can enter the trade below price 23717.78, take profit at 24947.11, stop loss at 22827.02.
Any opinions, news, research, analyses, prices, other information, or links to third-party sites contained on this website are provided on an "as-is" basis, as general market commentary, and do not constitute investment advice. The market commentary has not been prepared in accordance with legal requirements designed to promote the independence of investment research, and it is therefore not subject to any prohibition on dealing ahead of dissemination. Although this commentary is not produced by an independent source, FXCM takes all sufficient steps to eliminate or prevent any conflicts of interest arising out of the production and dissemination of this communication. The employees of FXCM commit to acting in the clients' best interests and represent their views without misleading, deceiving, or otherwise impairing the clients' ability to make informed investment decisions. For more information about the FXCM's internal organizational and administrative arrangements for the prevention of conflicts, please refer to the Firms' Managing Conflicts Policy. Please ensure that you read and understand our Full Disclaimer and Liability provision concerning the foregoing Information, which can be accessed on the website.

BTCUSD is testing on the key level | 1st February 2023BTCUSD has attempted to break the key support at 22383.53, yet, it failed. With the ascending trend line, looking at the buy entry at 22383.53, stop loss at 20935.34, and take profit at 23999.82 which is the recent swing high.
Any opinions, news, research, analyses, prices, other information, or links to third-party sites contained on this website are provided on an "as-is" basis, as general market commentary, and do not constitute investment advice. The market commentary has not been prepared in accordance with legal requirements designed to promote the independence of investment research, and it is therefore not subject to any prohibition on dealing ahead of dissemination. Although this commentary is not produced by an independent source, FXCM takes all sufficient steps to eliminate or prevent any conflicts of interest arising out of the production and dissemination of this communication. The employees of FXCM commit to acting in the clients' best interests and represent their views without misleading, deceiving, or otherwise impairing the clients' ability to make informed investment decisions. For more information about the FXCM's internal organizational and administrative arrangements for the prevention of conflicts, please refer to the Firms' Managing Conflicts Policy. Please ensure that you read and understand our Full Disclaimer and Liability provision concerning the foregoing Information, which can be accessed on the website.

BTCUSD potential to bullish to previous swing highLooking at the H4 chart, my overall bias for BTCUSD is bullish due to the current price being above the Ichimoku cloud, and there is an ascending channel, indicating a bullish market.
Looking for buy entry at 23942.46 which is the recent swing high, take profit at 25150.50 which is the previous swing high, and stop loss at 22842.28 which is the recent swing low.
Any opinions, news, research, analyses, prices, other information, or links to third-party sites contained on this website are provided on an "as-is" basis, as general market commentary, and do not constitute investment advice. The market commentary has not been prepared in accordance with legal requirements designed to promote the independence of investment research, and it is therefore not subject to any prohibition on dealing ahead of dissemination. Although this commentary is not produced by an independent source, FXCM takes all sufficient steps to eliminate or prevent any conflicts of interest arising out of the production and dissemination of this communication. The employees of FXCM commit to acting in the clients' best interests and represent their views without misleading, deceiving, or otherwise impairing the clients' ability to make informed investment decisions. For more information about the FXCM's internal organizational and administrative arrangements for the prevention of conflicts, please refer to the Firms' Managing Conflicts Policy. Please ensure that you read and understand our Full Disclaimer and Liability provision concerning the foregoing Information, which can be accessed on the website.

BTCUSD Potential For Bullish Rise to previous swing highLooking at the Daily chart, my overall bias for BTCUSD is bullish due to the current price being above the Ichimoku cloud, indicating a bullish market. Looking for a buy stop entry at 23325.61, where the recent high is, we are looking to take profit at 25215.84, where the previous swing high is. Stop loss will be placed at 22314.61, where the previous overlap support is.
Any opinions, news, research, analyses, prices, other information, or links to third-party sites contained on this website are provided on an "as-is" basis, as general market commentary, and do not constitute investment advice. The market commentary has not been prepared in accordance with legal requirements designed to promote the independence of investment research, and it is therefore not subject to any prohibition on dealing ahead of dissemination. Although this commentary is not produced by an independent source, FXCM takes all sufficient steps to eliminate or prevent any conflicts of interest arising out of the production and dissemination of this communication. The employees of FXCM commit to acting in the clients' best interests and represent their views without misleading, deceiving, or otherwise impairing the clients' ability to make informed investment decisions. For more information about the FXCM's internal organizational and administrative arrangements for the prevention of conflicts, please refer to the Firms' Managing Conflicts Policy. Please ensure that you read and understand our Full Disclaimer and Liability provision concerning the foregoing Information, which can be accessed on the website.

BTC/USD short selling opportunityThe BTC/USD pair has been in a downward trend for the last few weeks, as it has dropped from a high of 23041 to its current level of 22983. This downward trend has created a good opportunity for bearish traders to take advantage of short term trading opportunities.
The current bearish trend has been driven by a combination of negative news, rising volatility, and low demand. The possibility of further drops in the BTC/USD pair is high, with some analysts suggesting that the pair could fall to a low of 21000 in the near future.
In order to take full advantage of this bearish trend, traders should utilize short term trading strategies such as scalping and swing trading. These strategies involve entering and exiting trades quickly to benefit from small, short-term movements in the market. Traders should also be sure to monitor the news and any economic data releases that may affect the market, as these can have a significant impact on the price of the BTC/USD pair.
Overall, the bearish trend in the BTC/USD pair has opened up several short-term trading opportunities, with some predicting the pair could fall to 21000. Traders should take advantage of these opportunities by utilizing short-term trading strategies and closely monitoring market activity.

BTC potential to BULLISH RISE!!Looking at the H4 chart, my overall bias for USDCAD is bearish, due to the current price being below the Ichimoku cloud, and there is a descending trend line indicating a bullish market. If this bearish momentum continues, expect the price to possibly continue heading towards the 1st support at 1.33434 which is an overlap support and recent swing low. The price may further drop to the 2nd support at 1.33138.
In an alternative scenario, price could possibly head up to the 1st resistance at 1.34465 which is in line with 61.8% Fibonacci retracement. The 2nd resistance is at 1.34802 which is in line with 78.6% Fibonacci line.
Buy entry at 23690.92, take profit at 25152.80, and stop loss at 22255.62.
Any opinions, news, research, analyses, prices, other information, or links to third-party sites contained on this website are provided on an "as-is" basis, as general market commentary, and do not constitute investment advice. The market commentary has not been prepared in accordance with legal requirements designed to promote the independence of investment research, and it is therefore not subject to any prohibition on dealing ahead of dissemination. Although this commentary is not produced by an independent source, FXCM takes all sufficient steps to eliminate or prevent any conflicts of interest arising out of the production and dissemination of this communication. The employees of FXCM commit to acting in the clients' best interests and represent their views without misleading, deceiving, or otherwise impairing the clients' ability to make informed investment decisions. For more information about the FXCM's internal organizational and administrative arrangements for the prevention of conflicts, please refer to the Firms' Managing Conflicts Policy. Please ensure that you read and understand our Full Disclaimer and Liability provision concerning the foregoing Information, which can be accessed on the website.

Aspects to Market Maker to Retail Sentiment AlignmentIt's possible that the majority of the actual inventory of a market maker contains contracts that are long-dated.
Long-dated contracts are those with a longer maturity date, usually more than a year.
These contracts can include stocks, bonds, options, futures, and other financial instruments.
Long-dated contracts can be beneficial for market makers because they provide a steady source of liquidity for the market.
These contracts are less affected by short-term price fluctuations and market noise,
so market makers can hold them for a longer period of time, providing liquidity to the market.
Additionally, market makers can also use long-dated contracts to hedge their other positions,
which can help them manage their risks. For example, if a market maker holds a long position in a stock,
they may also hold a long-dated option on the same stock as a hedge.
It's worth noting that market makers may also hold short-dated contracts in their inventory,
as they can be useful for taking advantage of short-term price movements,
but it's likely that the majority of their actual inventory contains long-dated contracts.
The contracts that contain the actual securities that market makers hold as their actual inventory are typically large.
This is because market makers need to have a significant amount of inventory on hand in order to meet the demand of market participants.
Market makers typically have a lot of capital at their disposal and they use it to buy large blocks of securities and derivatives.
It's worth noting that the size of the contracts can vary depending on the market and the type of security.
For example, in the stock market, market makers may hold contracts containing thousands of shares of a particular stock,
while in the bond market, the contracts may contain millions of dollars' worth of bonds.
Additionally, market makers also use risk management tools,
such as stop-loss orders, to limit the potential losses on their positions,
and they can adjust their positions as the market conditions change.

BTC failed to break strong resistance level Strong resistance level unable to break through, looking BTC restest at 19655. Fibonacci projection add confluence to it. pay attention to the price movement. looking for sell entry 20702, take profit at 19655, and stop loss at 21595.

Comparison of BTC and Historical Volatility (BVOL)TF: D
Comparing symbol: BVOL
Pretty interesting set-up on Bitcoin and the crypto market in general. Bitcoin volatility is a historic low right now and historically when volatility reaches a low in this general area price action really ticks up (both downwards and upwards). This is marked by the pink horizontal lines on the chart.
I am expecting some big volatility and price movement over the next several months. Keep in mind that if volatility is low it doesn't mean an uptrend will occur and has no meaning in which way price will trend, it just signifies a potential increase in volatility. What is even more interesting is usually volatility spikes when lows are reached, but it looks like volatility is slowly trending down. With smart trading and a good understanding of price action, this might give great opportunities to capitalize on the market.

BTC Potential for Bullish Rise | 18th January 2023Looking at the Daily chart, my overall bias for BTCUSD is bullish due to the current price being above the Ichimoku cloud, indicating a bullish market.
Looking buy entry at 21520.73 to retest the intermediary support level. Stop loss will be at 20557.88, where the 78.6% Fibonacci projection line is. Take profit will be at 22751.05, where the 61.8% Fibonacci projection line is.

Keep it simple. 28k BTCKeep it super simple on this one. BTC has been moving upwards for days but recently hit a tough area of resistance. It only makes sense to have a small pullback. If this market is for real though expect a quick reversal back to bullish and a move through resistance aimed at $28,000 BTC.

BTC/USD- Bear market FOMO RallyHi,
I believe the BTC rally is now over. It looks to be a classic fomo rally.
I have sold my swing trade and taken profit. I will be buying BTC again during this year when the next dip does arrive. For now we could see sideways action or a heavily rejection. Either outcome, I don't want to be involved.
If you haven't already, take some profit.

BTCUSD Potential for Bullish Continuation | 17th January 2023Looking at the Daily chart, my overall bias for BTCUSD is bullish due to the current price being above the Ichimoku cloud, indicating a bullish market.
Looking for a pullback buy entry at 20008.35 to retest the intermediary support level. Stop loss will be at 18157.00, where the 78.6% Fibonacci projection line is. Take profit will be at 22615.00, where the 61.8% Fibonacci projection line is.
Any opinions, news, research, analyses, prices, other information, or links to third-party sites contained on this website are provided on an "as-is" basis, as general market commentary, and do not constitute investment advice. The market commentary has not been prepared in accordance with legal requirements designed to promote the independence of investment research, and it is therefore not subject to any prohibition on dealing ahead of dissemination. Although this commentary is not produced by an independent source, FXCM takes all sufficient steps to eliminate or prevent any conflicts of interest arising out of the production and dissemination of this communication. The employees of FXCM commit to acting in the clients' best interests and represent their views without misleading, deceiving, or otherwise impairing the clients' ability to make informed investment decisions. For more information about the FXCM's internal organizational and administrative arrangements for the prevention of conflicts, please refer to the Firms' Managing Conflicts Policy. Please ensure that you read and understand our Full Disclaimer and Liability provision concerning the foregoing Information, which can be accessed on the website.

DXY3D - TAP M1 FVG, Gather Liquidity, Dead-Cat Bounce.Expecting DXY3D - TAP M1 FVG, Gather Liquidity, Dead-Cat Bounce into *Yearly Open* before Earnings will take-over sentiment of DXY.

BTCUSD Potential for Bullish Continuation | 16th January 2023Looking at the H4 chart, my overall bias for BTCUSD is bullish due to the current price being above the Ichimoku cloud , indicating a bullish market. Looking for a pullback buy limit entry at 18741.00, where the 50% Fibonacci line is. Stop loss will be at 18150.00, where the 61.8% Fibonacci projection line is. Take profit will be at 21473.00, where the previous swing high is.
Any opinions, news, research, analyses, prices, other information, or links to third-party sites contained on this website are provided on an "as-is" basis, as general market commentary, and do not constitute investment advice. The market commentary has not been prepared in accordance with legal requirements designed to promote the independence of investment research, and it is therefore not subject to any prohibition on dealing ahead of dissemination. Although this commentary is not produced by an independent source, FXCM takes all sufficient steps to eliminate or prevent any conflicts of interest arising out of the production and dissemination of this communication. The employees of FXCM commit to acting in the clients' best interests and represent their views without misleading, deceiving, or otherwise impairing the clients' ability to make informed investment decisions. For more information about the FXCM's internal organizational and administrative arrangements for the prevention of conflicts, please refer to the Firms' Managing Conflicts Policy. Please ensure that you read and understand our Full Disclaimer and Liability provision concerning the foregoing Information, which can be accessed on the website.

BTCUSD Potential for Bullish Continuation | 13th January 2023Looking at the H4 chart, my overall bias for BTCUSD is bullish due to the current price being above the Ichimoku cloud , indicating a bullish market. Looking for a pullback buy limit entry at 18150.00, where the previous high and 38.2% Fibonacci line is. Stop loss will be at 17136.00, where the recent minor swing low and 61.8% Fibonacci line is. Take profit will be at 20068.00, where the 78.6% Fibonacci line is.
Any opinions, news, research, analyses, prices, other information, or links to third-party sites contained on this website are provided on an "as-is" basis, as general market commentary, and do not constitute investment advice. The market commentary has not been prepared in accordance with legal requirements designed to promote the independence of investment research, and it is therefore not subject to any prohibition on dealing ahead of dissemination. Although this commentary is not produced by an independent source, FXCM takes all sufficient steps to eliminate or prevent any conflicts of interest arising out of the production and dissemination of this communication. The employees of FXCM commit to acting in the clients' best interests and represent their views without misleading, deceiving, or otherwise impairing the clients' ability to make informed investment decisions. For more information about the FXCM's internal organizational and administrative arrangements for the prevention of conflicts, please refer to the Firms' Managing Conflicts Policy. Please ensure that you read and understand our Full Disclaimer and Liability provision concerning the foregoing Information, which can be accessed on the website.

🔥 BTCUSD Be careful, I. Told you all the game plan already So my pervious posts explains all .
Massive drop Soon 🥂
