BTCUSD Potential for Bearish Continuation| 8th September 2022On the H4, price has broken the range and is moving in a descending trend signaling bearish momentum. We're looking for a pull back sell entry at 19567.02 to take profit at 18400.67 levels where the 78.6% projection sits. Our stop loss is at 20431.46 where the previous swing high and 23.6% retracement sits.
Any opinions, news, research, analyses, prices, other information, or links to third-party sites contained on this website are provided on an "as-is" basis, as general market commentary, and do not constitute investment advice. The market commentary has not been prepared in accordance with legal requirements designed to promote the independence of investment research, and it is therefore not subject to any prohibition on dealing ahead of dissemination. Although this commentary is not produced by an independent source, FXCM takes all sufficient steps to eliminate or prevent any conflicts of interest arising out of the production and dissemination of this communication. The employees of FXCM commit to acting in the clients' best interests and represent their views without misleading, deceiving, or otherwise impairing the clients' ability to make informed investment decisions. For more information about the FXCM's internal organizational and administrative arrangements for the prevention of conflicts, please refer to the Firms' Managing Conflicts Policy. Please ensure that you read and understand our Full Disclaimer and Liability provision concerning the foregoing Information, which can be accessed on the website.
BTC-USD

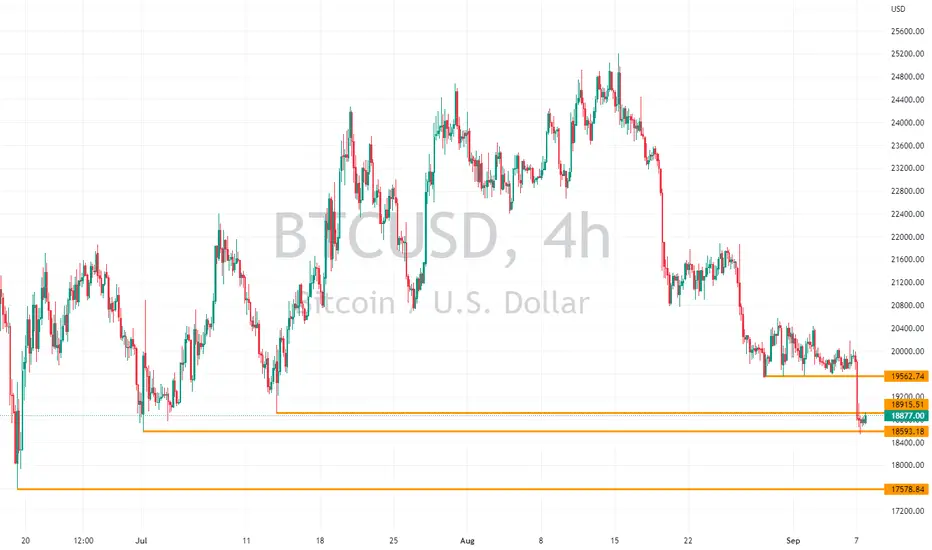
BTC/USD Outlook (7 September 2022)The DXY claimed new highs yesterday, with price currently at 110.58, this has led to Bitcoin crashing through the 19562 support level to trade between the 18593 and 18915 price area.
Cryptocurrencies are strongly influenced by macroeconomic factors and the performance of the traditional market. It could also be likely that investors are exercising caution leading up to the ethereum merge. If issues with Ethereum emerge after the merge, the impact could be catastrophic to the market.
If price breaks lower through the 18400 price level, Bitcoin could continue towards the 17578 level, last tested in June.
BTCUSD Potential for Bearish Continuation| 7th September 2022On the H4, price has broken the range and is moving in a descending trend signaling bearish momentum. We're looking for a pull back sell entry at 19567.02 to take profit at 18400.67 levels where the 78.6% projection sits. Our stop loss is at 20431.46 where the previous swing high and 23.6% retracement sits.
Any opinions, news, research, analyses, prices, other information, or links to third-party sites contained on this website are provided on an "as-is" basis, as general market commentary, and do not constitute investment advice. The market commentary has not been prepared in accordance with legal requirements designed to promote the independence of investment research, and it is therefore not subject to any prohibition on dealing ahead of dissemination. Although this commentary is not produced by an independent source, FXCM takes all sufficient steps to eliminate or prevent any conflicts of interest arising out of the production and dissemination of this communication. The employees of FXCM commit to acting in the clients' best interests and represent their views without misleading, deceiving, or otherwise impairing the clients' ability to make informed investment decisions. For more information about the FXCM's internal organizational and administrative arrangements for the prevention of conflicts, please refer to the Firms' Managing Conflicts Policy. Please ensure that you read and understand our Full Disclaimer and Liability provision concerning the foregoing Information, which can be accessed on the website.

BTCUSDIt was a good in and out analysis, but because I didn't anticipate it to enter so early I got stopped out. But it was a good lesson, in that check the time frame you are forecasting in so you know how often you should check if orders have been triggered and when they are just how much managing needs to be done. (excuse the bad English composition)

BTCUSD Potential for Bearish Continuation| 6th September 2022On the H4, price is still ranging but is moving in a descending trend and signaling bearish momentum. We're looking for a pull back sell entry at 20513.86 where the previous swing high sits. Take profit at 19219.49 levels which is the previous swing low and 61.8% projection. Our stop loss is at 20886.88 where the previous swing low and 23.6% retracement sits.
Any opinions, news, research, analyses, prices, other information, or links to third-party sites contained on this website are provided on an "as-is" basis, as general market commentary, and do not constitute investment advice. The market commentary has not been prepared in accordance with legal requirements designed to promote the independence of investment research, and it is therefore not subject to any prohibition on dealing ahead of dissemination. Although this commentary is not produced by an independent source, FXCM takes all sufficient steps to eliminate or prevent any conflicts of interest arising out of the production and dissemination of this communication. The employees of FXCM commit to acting in the clients' best interests and represent their views without misleading, deceiving, or otherwise impairing the clients' ability to make informed investment decisions. For more information about the FXCM's internal organizational and administrative arrangements for the prevention of conflicts, please refer to the Firms' Managing Conflicts Policy. Please ensure that you read and understand our Full Disclaimer and Liability provision concerning the foregoing Information, which can be accessed on the website.

BTC/USD - weekly Analytics + Altcoins 05.09.2022There is still uncertainty about the further movements in Bitcoin. For the continuation of the growing trend it is necessary to form the growing impulse waves and the corrective patterns thereto, by which you can identify the presence of large players interested in a long hold on the asset.
Altcoins
Tron is still in a range of price consolidation, we believe that at this stage there is the accumulation of position by a large player, which may lead to significant growth in the future, confirmation will be the growth in the area of 0.067.

BTCUSD Potential for Bearish Continuation| 5th September 2022On the H4, price is moving in a descending trend and is signaling strong bearish momentum. We're looking for a pull back sell entry at 20853.52 where the 23.6% retracement sits. Take profit at 19219.49 levels which is the previous swing low and 61.8% projection. Our stop loss is at 21779.31 where the 38.2% retracement and previous swing high sits.
Any opinions, news, research, analyses, prices, other information, or links to third-party sites contained on this website are provided on an "as-is" basis, as general market commentary, and do not constitute investment advice. The market commentary has not been prepared in accordance with legal requirements designed to promote the independence of investment research, and it is therefore not subject to any prohibition on dealing ahead of dissemination. Although this commentary is not produced by an independent source, FXCM takes all sufficient steps to eliminate or prevent any conflicts of interest arising out of the production and dissemination of this communication. The employees of FXCM commit to acting in the clients' best interests and represent their views without misleading, deceiving, or otherwise impairing the clients' ability to make informed investment decisions. For more information about the FXCM's internal organizational and administrative arrangements for the prevention of conflicts, please refer to the Firms' Managing Conflicts Policy. Please ensure that you read and understand our Full Disclaimer and Liability provision concerning the foregoing Information, which can be accessed on the website.

BTCUSD - Do you have a plan, Mister Fix?
It was less than a year ago... I hope you remember?
TSTW.
Not legal and financial advice;
Any information provided here is only the personal opinion of the author.

EHT USUDT S/R ETHERUM SUPPORT AND RESISTANCE LINS
support and resistance time M W D
entry trigger yellow lines

BTC falling wedge on 15m chart, short rally should happenthe description is posted on chart , read it and it is only an idea.

IF BTC WONT BREAKOUT DESCENDING TRIANGLE NOW. 18k coming soonBTC moving in descending triangle formation. soon will be CPI released and FED decision if the BTC wont break this triangle today upside it will be hard month

BTCUSD Potential for Bearish Continuation| 2nd Sept 2022On the H4, price has broken the bullish channel and is signaling a bearish market sentiment. We're looking for a pull back sell entry at 20853.52 where the 23.6% retracement sits. Take profit at 19219.49 levels which is the previous swing low and 61.8% projection. Our stop loss is at 21779.31 where the 38.2% retracement and previous swing high sits.
Any opinions, news, research, analyses, prices, other information, or links to third-party sites contained on this website are provided on an "as-is" basis, as general market commentary, and do not constitute investment advice. The market commentary has not been prepared in accordance with legal requirements designed to promote the independence of investment research, and it is therefore not subject to any prohibition on dealing ahead of dissemination. Although this commentary is not produced by an independent source, FXCM takes all sufficient steps to eliminate or prevent any conflicts of interest arising out of the production and dissemination of this communication. The employees of FXCM commit to acting in the clients' best interests and represent their views without misleading, deceiving, or otherwise impairing the clients' ability to make informed investment decisions. For more information about the FXCM's internal organizational and administrative arrangements for the prevention of conflicts, please refer to the Firms' Managing Conflicts Policy. Please ensure that you read and understand our Full Disclaimer and Liability provision concerning the foregoing Information, which can be accessed on the website.

BTCUSD Potential for Bearish Continuation| 1st September 2022On the H4, price has broken the bullish channel and is signaling a bearish market sentiment. We're looking for a pull back sell entry at 20853.52 where the 23.6% retracement sits. Take profit at 19219.49 levels which is the previous swing low and 61.8% projection. Our stop loss is at 21779.31 where the 38.2% retracement and previous swing high sits.
Any opinions, news, research, analyses, prices, other information, or links to third-party sites contained on this website are provided on an "as-is" basis, as general market commentary, and do not constitute investment advice. The market commentary has not been prepared in accordance with legal requirements designed to promote the independence of investment research, and it is therefore not subject to any prohibition on dealing ahead of dissemination. Although this commentary is not produced by an independent source, FXCM takes all sufficient steps to eliminate or prevent any conflicts of interest arising out of the production and dissemination of this communication. The employees of FXCM commit to acting in the clients' best interests and represent their views without misleading, deceiving, or otherwise impairing the clients' ability to make informed investment decisions. For more information about the FXCM's internal organizational and administrative arrangements for the prevention of conflicts, please refer to the Firms' Managing Conflicts Policy. Please ensure that you read and understand our Full Disclaimer and Liability provision concerning the foregoing Information, which can be accessed on the website.

BTCUSD Potential for Bearish Continuation| 31st August 2022On the H4, price has broken the bullish channel and is signaling a bearish market sentiment. We're looking for a pull back sell entry at 20853.52 where the 23.6% retracement sits. Take profit at 19219.49 levels which is the previous swing low and 61.8% projection. Our stop loss is at 21779.31 where the 38.2% retracement and previous swing high sits.
Any opinions, news, research, analyses, prices, other information, or links to third-party sites contained on this website are provided on an "as-is" basis, as general market commentary, and do not constitute investment advice. The market commentary has not been prepared in accordance with legal requirements designed to promote the independence of investment research, and it is therefore not subject to any prohibition on dealing ahead of dissemination. Although this commentary is not produced by an independent source, FXCM takes all sufficient steps to eliminate or prevent any conflicts of interest arising out of the production and dissemination of this communication. The employees of FXCM commit to acting in the clients' best interests and represent their views without misleading, deceiving, or otherwise impairing the clients' ability to make informed investment decisions. For more information about the FXCM's internal organizational and administrative arrangements for the prevention of conflicts, please refer to the Firms' Managing Conflicts Policy. Please ensure that you read and understand our Full Disclaimer and Liability provision concerning the foregoing Information, which can be accessed on the website.

BTC/USD to 13KBased on the upward flag and break , retest of it . Together with FIb retracement . It is likely we would see a further dip in BTC to the 13k region and then a potential bounce . All technicals and Macroeconomics point to this dip !

BTCUSD Potential for Bearish Continuation| 30th August 2022On the H4, price has broken the bullish channel and is signaling a bearish market sentiment. We're looking for a pull back sell entry at 20853.52 where the 23.6% retracement sits. Take profit at 19219.49 levels which is the previous swing low and 61.8% projection. Our stop loss is at 21779.31 where the 38.2% retracement and previous swing high sits.
Any opinions, news, research, analyses, prices, other information, or links to third-party sites contained on this website are provided on an "as-is" basis, as general market commentary, and do not constitute investment advice. The market commentary has not been prepared in accordance with legal requirements designed to promote the independence of investment research, and it is therefore not subject to any prohibition on dealing ahead of dissemination. Although this commentary is not produced by an independent source, FXCM takes all sufficient steps to eliminate or prevent any conflicts of interest arising out of the production and dissemination of this communication. The employees of FXCM commit to acting in the clients' best interests and represent their views without misleading, deceiving, or otherwise impairing the clients' ability to make informed investment decisions. For more information about the FXCM's internal organizational and administrative arrangements for the prevention of conflicts, please refer to the Firms' Managing Conflicts Policy. Please ensure that you read and understand our Full Disclaimer and Liability provision concerning the foregoing Information, which can be accessed on the website.

BTC to test December '17 TopI don't think this level will break, but I will be monitoring price action around the 19,500 support area.
Expecting a bounce off of the 2017 High.
If it breaks, hold onto your hats.
Not financial advice.

BTCUSD Bullish In this 1H TF analyse we can check 19541.85 support, and this one can also being watched in 4H TF.
MACD is above the Signal in many TF and it seems to continue, and that shows a strong bullish for BTCUSD, we can also combine the MACD with EMA that is moving away more and further from the BB line, and the upper BB line it is opening up.
The candle is crossing 38,2% Fibo and we have a triangule being crossed with the last resistance. In a couple hours the next resistence could be the 20630.87

BTCUSD Potential for Bearish Continuation| 29th August 2022On the H4, price has broken the bullish channel and is signalling a bearish market sentiment. We're looking for a pull back sell entry at 20853.52 to take profit at 19219.49 which is the previous swing low and 61.8% projection. our stop loss at 21779.31 where the previous swing high sits.
Any opinions, news, research, analyses, prices, other information, or links to third-party sites contained on this website are provided on an "as-is" basis, as general market commentary, and do not constitute investment advice. The market commentary has not been prepared in accordance with legal requirements designed to promote the independence of investment research, and it is therefore not subject to any prohibition on dealing ahead of dissemination. Although this commentary is not produced by an independent source, FXCM takes all sufficient steps to eliminate or prevent any conflicts of interest arising out of the production and dissemination of this communication. The employees of FXCM commit to acting in the clients' best interests and represent their views without misleading, deceiving, or otherwise impairing the clients' ability to make informed investment decisions. For more information about the FXCM's internal organizational and administrative arrangements for the prevention of conflicts, please refer to the Firms' Managing Conflicts Policy. Please ensure that you read and understand our Full Disclaimer and Liability provision concerning the foregoing Information, which can be accessed on the website.

BTCUSD Potential for Bullish Continuation| 26th August 2022On the H4, price is still ranging within the bullish channel signally market mixed sentiments. Price broke 21608.76, we're looking for a pull back buy entry at 20853.52 to take profit at 22488.32 which is the previous swing high and 38.2% retracement and 61.8% projection. our stop loss at 19250.84 where the previous swing low sits. Alternatively, if price breaks the channel into bearish momentum, we're looking to sell at 20817.49, take profit at 19250.84 and stop loss at 21608.76
Any opinions, news, research, analyses, prices, other information, or links to third-party sites contained on this website are provided on an "as-is" basis, as general market commentary, and do not constitute investment advice. The market commentary has not been prepared in accordance with legal requirements designed to promote the independence of investment research, and it is therefore not subject to any prohibition on dealing ahead of dissemination. Although this commentary is not produced by an independent source, FXCM takes all sufficient steps to eliminate or prevent any conflicts of interest arising out of the production and dissemination of this communication. The employees of FXCM commit to acting in the clients' best interests and represent their views without misleading, deceiving, or otherwise impairing the clients' ability to make informed investment decisions. For more information about the FXCM's internal organizational and administrative arrangements for the prevention of conflicts, please refer to the Firms' Managing Conflicts Policy. Please ensure that you read and understand our Full Disclaimer and Liability provision concerning the foregoing Information, which can be accessed on the website.

BTCUSD Potential for Bullish Continuation| 25th August 2022On the H4, price is still ranging within the bullish channel signally market mixed sentiments. Price broke 21608.76, we're looking for a pull back buy entry at 20853.52 to take profit at 22437.48 which is the previous swing high and 38.2% retracement and 61.8% projection. our stop loss at 19250.84 where the previous swing low sits. Alternatively, if price breaks the channel into bearish momentum, we're looking to sell at 20817.49, take profit at 19250.84 and stop loss at 21608.76
Any opinions, news, research, analyses, prices, other information, or links to third-party sites contained on this website are provided on an "as-is" basis, as general market commentary, and do not constitute investment advice. The market commentary has not been prepared in accordance with legal requirements designed to promote the independence of investment research, and it is therefore not subject to any prohibition on dealing ahead of dissemination. Although this commentary is not produced by an independent source, FXCM takes all sufficient steps to eliminate or prevent any conflicts of interest arising out of the production and dissemination of this communication. The employees of FXCM commit to acting in the clients' best interests and represent their views without misleading, deceiving, or otherwise impairing the clients' ability to make informed investment decisions. For more information about the FXCM's internal organizational and administrative arrangements for the prevention of conflicts, please refer to the Firms' Managing Conflicts Policy. Please ensure that you read and understand our Full Disclaimer and Liability provision concerning the foregoing Information, which can be accessed on the website.

Interesting relationship using this charting algo vs performanceThe above chart is the SPX/Gold vs Gold and SPX. When the relationship is bullish stocks tend to be the #1 performer, when the indicator is bearish, gold appears to be the #1 performer. You could use this relationship on a 1M candle and elaborate it further by adding SPY/NASDAQ/BTC/IWM/VTI on the bullish side and USD/TLT/XLU/GLD on the bearish side. Following this system going backward would have proven to be market outperformance on a risk-adjusted level.

BTCUSD Potential for Bearish Continuation| 24th August 2022On the H4, price is still ranging within the bullish channel signally market mixed sentiments. If prices break 21608.76, we're looking for a buy entry to take profit at 22097.72 which is the previous swing high and 38.2% retracement. stop loss at 20817.49. Alternatively, if price breaks the channel into bearish momentum, we're looking to sell at 20817.49, take profit at 19274.51 and stop loss at 21608.76
Any opinions, news, research, analyses, prices, other information, or links to third-party sites contained on this website are provided on an "as-is" basis, as general market commentary, and do not constitute investment advice. The market commentary has not been prepared in accordance with legal requirements designed to promote the independence of investment research, and it is therefore not subject to any prohibition on dealing ahead of dissemination. Although this commentary is not produced by an independent source, FXCM takes all sufficient steps to eliminate or prevent any conflicts of interest arising out of the production and dissemination of this communication. The employees of FXCM commit to acting in the clients' best interests and represent their views without misleading, deceiving, or otherwise impairing the clients' ability to make informed investment decisions. For more information about the FXCM's internal organizational and administrative arrangements for the prevention of conflicts, please refer to the Firms' Managing Conflicts Policy. Please ensure that you read and understand our Full Disclaimer and Liability provision concerning the foregoing Information, which can be accessed on the website.
