⭕️SELL BTCUSD 🧐⭕️You see bitcoin analysis in 2 hours(BTCUSD , 2H)🔎
🔰As shown in the picture, Bitcoin is placed in a flag pattern indicated by a white line.🧐
Due to the presence of the price in a resistance range marked with purple and also the downward trend line of the flag pattern (white line). The price in this range can be suitable for sale.
An uptrend line has been formed for the price that we can wait for the price pullback❗️ to this uptrend line for sale.
We place the initial target in a support to which the price has reacted twice and is indicated by an orange dashed line.🧐
And the second target is in the support range of purple, to which the price has reacted three times, and in the range of the uptrend line of the flag pattern (the uptrend white line). ❗️
⚠️⚠️Please observe capital management and open a low volume transaction.❗️❗️
I hope this analysis is useful for you🙏🏻🌹
📌Please introduce the "TRADER STREET" to your friends 🙏🏻
__________________📈TRADER STREET📉___________________
BTC-USD

BTCUSD Potential bullish rise| 1st Apr 2022With price moving above the ichimoku cloud and expected to bounce off the stochastic indicator, we have a bullish bias that price will rise to our take profit at 49023 in line with the 127.2% Fibonacci extension from our entry of 44893 in line with the 38.2% Fibonacci retracement . Alternatively, price may break entry structure and head for our stop loss at 42465 in line with the 61.8% Fibonacci retracement and pullback support.
Any opinions, news, research, analyses, prices, other information, or links to third-party sites contained on this website are provided on an "as-is" basis, as general market commentary, and do not constitute investment advice. The market commentary has not been prepared in accordance with legal requirements designed to promote the independence of investment research, and it is therefore not subject to any prohibition on dealing ahead of dissemination. Although this commentary is not produced by an independent source, FXCM takes all sufficient steps to eliminate or prevent any conflicts of interest arising out of the production and dissemination of this communication. The employees of FXCM commit to acting in the clients' best interests and represent their views without misleading, deceiving, or otherwise impairing the clients' ability to make informed investment decisions. For more information about the FXCM's internal organizational and administrative arrangements for the prevention of conflicts, please refer to the Firms' Managing Conflicts Policy. Please ensure that you read and understand our Full Disclaimer and Liability provision concerning the foregoing Information, which can be accessed on the website.

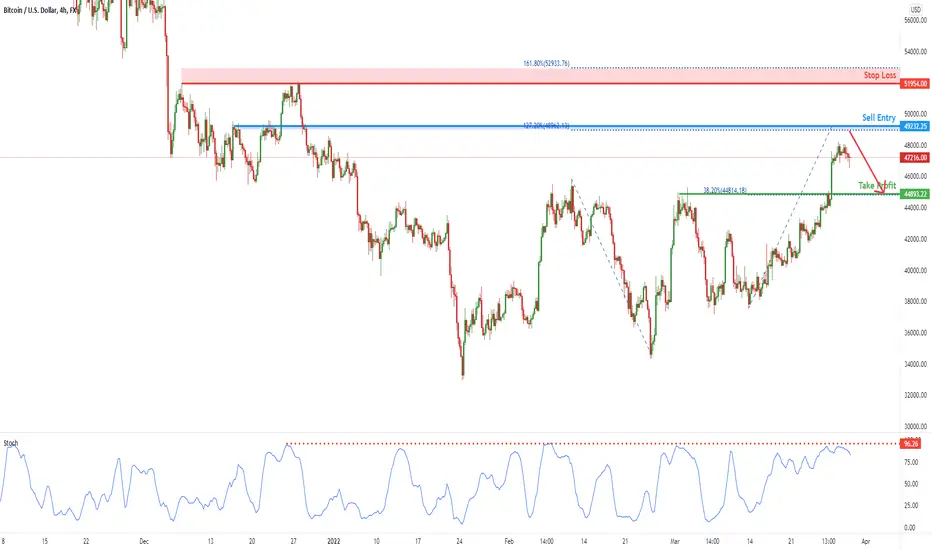
BTCUSD Potential short term bearish drop | 31st March 2022With price expected to reverse off the stochastic indicator, we have a bearish bias that price will drop from our entry at 48962 in line pullback resistance and 127.20% Fibonacci extension towards our take profit at 44814 in line with the latest pull back support and 38.2% Fibonacci retracement . Alternatively, if prices were to break out, price may potential rise towards our stop loss at 52933 which is in line with the 161.80% Fibonacci extension level.
Any opinions, news, research, analyses, prices, other information, or links to third-party sites contained on this website are provided on an "as-is" basis, as general market commentary, and do not constitute investment advice. The market commentary has not been prepared in accordance with legal requirements designed to promote the independence of investment research, and it is therefore not subject to any prohibition on dealing ahead of dissemination. Although this commentary is not produced by an independent source, FXCM takes all sufficient steps to eliminate or prevent any conflicts of interest arising out of the production and dissemination of this communication. The employees of FXCM commit to acting in the clients' best interests and represent their views without misleading, deceiving, or otherwise impairing the clients' ability to make informed investment decisions. For more information about the FXCM's internal organizational and administrative arrangements for the prevention of conflicts, please refer to the Firms' Managing Conflicts Policy. Please ensure that you read and understand our Full Disclaimer and Liability provision concerning the foregoing Information, which can be accessed on the website.

BTCUSD Potential drop|30th Mar 2022With price expected to reverse off the stochastic indicator, we have a bearish bias that price will drop from our entry at 48962 in line pullback resistance and 127.20% Fibonacci extension towards our take profit at 44814 in line with the latest pull back support and 38.2% Fibonacci retracement . Alternatively, if prices were to break out, price may potential rise towards our stop loss at 52933 which is in line with the 161.80% Fibonacci extension level.
Any opinions, news, research, analyses, prices, other information, or links to third-party sites contained on this website are provided on an "as-is" basis, as general market commentary, and do not constitute investment advice. The market commentary has not been prepared in accordance with legal requirements designed to promote the independence of investment research, and it is therefore not subject to any prohibition on dealing ahead of dissemination. Although this commentary is not produced by an independent source, FXCM takes all sufficient steps to eliminate or prevent any conflicts of interest arising out of the production and dissemination of this communication. The employees of FXCM commit to acting in the clients' best interests and represent their views without misleading, deceiving, or otherwise impairing the clients' ability to make informed investment decisions. For more information about the FXCM's internal organizational and administrative arrangements for the prevention of conflicts, please refer to the Firms' Managing Conflicts Policy. Please ensure that you read and understand our Full Disclaimer and Liability provision concerning the foregoing Information, which can be accessed on the website.
BTCUSD Potential drop|29th Mar 2022 With price expected to reverse off the stochastic indicator, we have a bearish bias that price will drop from our entry at 48962 in line pullback resistance and 127.20% Fibonacci extension towards our take profit at 44814 in line with the latest pull back support and 38.2% Fibonacci retracement . Alternatively, if prices were to break out, price may potential rise towards our stop loss at 52933 which is in line with the 161.80% Fibonacci extension level.
Any opinions, news, research, analyses, prices, other information, or links to third-party sites contained on this website are provided on an "as-is" basis, as general market commentary, and do not constitute investment advice. The market commentary has not been prepared in accordance with legal requirements designed to promote the independence of investment research, and it is therefore not subject to any prohibition on dealing ahead of dissemination. Although this commentary is not produced by an independent source, FXCM takes all sufficient steps to eliminate or prevent any conflicts of interest arising out of the production and dissemination of this communication. The employees of FXCM commit to acting in the clients' best interests and represent their views without misleading, deceiving, or otherwise impairing the clients' ability to make informed investment decisions. For more information about the FXCM's internal organizational and administrative arrangements for the prevention of conflicts, please refer to the Firms' Managing Conflicts Policy. Please ensure that you read and understand our Full Disclaimer and Liability provision concerning the foregoing Information, which can be accessed on the website.

BTC/USD - weekly Analytics + Altcoins 28.03.2022Bitcoin continues its recovery and is above the key resistance of 45,500 (we mentioned in our previous review), which increases the probability of the growing trend continuation, locally I would like to see a correction in the form of a price trading - this will give additional confirmation of the future ascending of quotations and entry points for buying with a controlled risk level.
Altcoins:
Among altcoins, we single out ETHEREUM and TRX as the most promising projects, which may grow several times.

💡Don't miss the great buy opportunity in BTCUSD @BitcoinTrading suggestion:
". There is a possibility of temporary retracement to the suggested support line (46542.43).
. if so, traders can set orders based on Price Action and expect to reach short-term targets."
Technical analysis:
. BTCUSDT is in an uptrend, and the continuation of the uptrend is expected.
. The price is above the 21-Day WEMA, which acts as a dynamic support.
. The RSI is at 79.
Take Profits:
TP1= @ 47596.07
TP2= @ 48654.08
TP3= @ 49497.94
TP4= @ 50140.78
TP5= @ 51311.16
SL= Break below S2
❤️ If you find this helpful and want more FREE forecasts in TradingView
. . . . . Please show your support back,
. . . . . . . . Hit the 👍 LIKE button,
. . . . . . . . . . Drop some feedback below in the comment!
❤️ Your support is very much 🙏 appreciated!❤️
💎 Want us to help you become a better Forex / Crypto trader?
Now, It's your turn!
Be sure to leave a comment; let us know how you see this opportunity and forecast.
Trade well, ❤️
ForecastCity English Support Team ❤️

BTCUSD Potential drop | 28th Mar 2022With price expected to reverse off the stochastic indicator, we have a bearish bias that price will drop from our entry at 47429 in line pullback resistance and 127.20% Fibonacci extension towards our take profit at 42592 in line with the latest pull back support and 50.00% Fibonacci retracement. Alternatively, if prices were to break out, price may potential rise towards our stop loss at 50319.17 which is in line with the 161.80% Fibonacci extension level.
Any opinions, news, research, analyses, prices, other information, or links to third-party sites contained on this website are provided on an "as-is" basis, as general market commentary, and do not constitute investment advice. The market commentary has not been prepared in accordance with legal requirements designed to promote the independence of investment research, and it is therefore not subject to any prohibition on dealing ahead of dissemination. Although this commentary is not produced by an independent source, FXCM takes all sufficient steps to eliminate or prevent any conflicts of interest arising out of the production and dissemination of this communication. The employees of FXCM commit to acting in the clients' best interests and represent their views without misleading, deceiving, or otherwise impairing the clients' ability to make informed investment decisions. For more information about the FXCM's internal organizational and administrative arrangements for the prevention of conflicts, please refer to the Firms' Managing Conflicts Policy. Please ensure that you read and understand our Full Disclaimer and Liability provision concerning the foregoing Information, which can be accessed on the website.

BUY BITCOIN (Weekly Timeframe)Just an idea and trade at your own risk.
Bitcoin is turning bullish if it is capable to close a day above 45000-46000, which would break a triple bottom formed pattern on the daily timeframe.
First target at 55000, then to the upper trendline frame of the weekly timeframe at 70000.

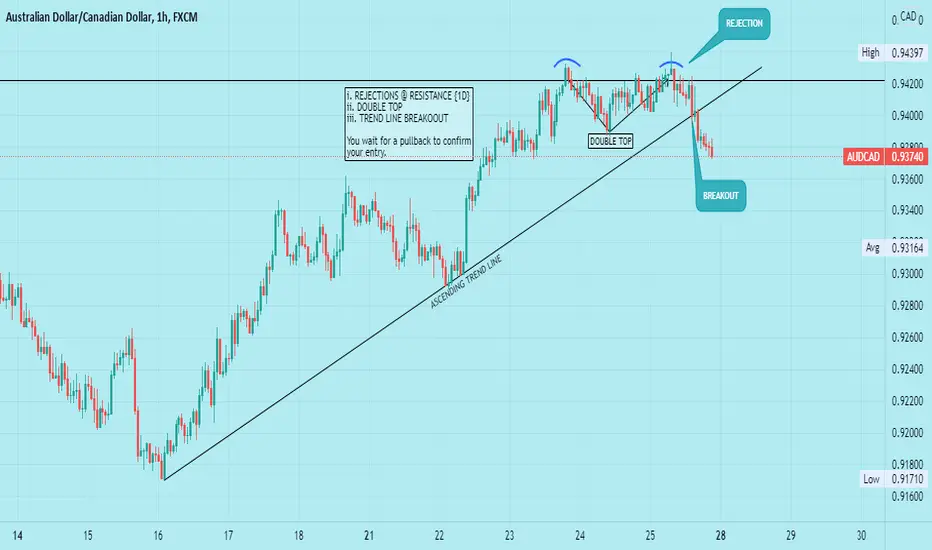
AUDCAD - SHORTi. REJECTIONS @ RESISTANCE {1D}
ii. DOUBLE TOP
iii. TREND LINE BREAKOOUT
You wait for a pullback to confirm
your entry.
TSLA breakout from descending broadening wedgeFollow up on my prior TSLA post on Feb 7th
My buy condition of a daily confirmation above $936 was never met and the downside target of $767 (.618 fib) was hit.
After bouncing off the lower channel at $764, TSLA has now broken above the channel.
3D MACD flipped positive on March 22nd with increasing buying pressure from March 14th-March 22nd.
However, price has hit the .618 Fib Extension level and the buying pressure is significantly lower likely due to an overextended BB% level.
Currently TSLA is consolidating under this level, indicating further upside potential.
Expecting a slight retracement and further conslidation given the bearish divergences noted below:
4H Bearish Divergences:MACD, RSI, OBV, CMF, ADP
1D Bearish Divergences:MACD, HIST, RSI, OBV, CMF, MFI, ADP
My buy order was finally filled and stands at ~7.9% in profit

BTCUSD Potential drop | 25th Mar 2022With price expected to reverse off the stochastic indicator, we have a bearish bias that price will drop from our entry at 45657 in line pullback resistance and 161.80% Fibonacci extension towards our take profit at 42454 in line with the latest pull back support and 38.20% Fibonacci retracement. Alternatively, if prices were to break out, price may potential rise towards our stop loss at 48762.50 which is in line with the swing high resistance and 127.20% Fibonacci extension level.
Any opinions, news, research, analyses, prices, other information, or links to third-party sites contained on this website are provided on an "as-is" basis, as general market commentary, and do not constitute investment advice. The market commentary has not been prepared in accordance with legal requirements designed to promote the independence of investment research, and it is therefore not subject to any prohibition on dealing ahead of dissemination. Although this commentary is not produced by an independent source, FXCM takes all sufficient steps to eliminate or prevent any conflicts of interest arising out of the production and dissemination of this communication. The employees of FXCM commit to acting in the clients' best interests and represent their views without misleading, deceiving, or otherwise impairing the clients' ability to make informed investment decisions. For more information about the FXCM's internal organizational and administrative arrangements for the prevention of conflicts, please refer to the Firms' Managing Conflicts Policy. Please ensure that you read and understand our Full Disclaimer and Liability provision concerning the foregoing Information, which can be accessed on the website.


$BTCUSD | MODEL SUGGESTS ATHHello Traders,
The targets on this chart are produced by a proprietary model. Data is fed into the model, the output is the targets you see on the chart. The support zone is also defined by the model. A break of the support zone nullifies this set up.

BTCUSD Potential drop | 24th Mar 2022With price expected to reverse off the stochastics resistance, we have a bearish bias that price will from our entry at 43840 in line pullback resistance and 127.2% Fibonacci extension towards our take profit at 36947 in line with the swing low support and 127.2% Fibonacci extension. Alternatively, price may break entry structure and head for our stop loss at 45575 in line with the 161.8% Fibonacci extension level and horizontal swing high resistance.
Any opinions, news, research, analyses, prices, other information, or links to third-party sites contained on this website are provided on an "as-is" basis, as general market commentary, and do not constitute investment advice. The market commentary has not been prepared in accordance with legal requirements designed to promote the independence of investment research, and it is therefore not subject to any prohibition on dealing ahead of dissemination. Although this commentary is not produced by an independent source, FXCM takes all sufficient steps to eliminate or prevent any conflicts of interest arising out of the production and dissemination of this communication. The employees of FXCM commit to acting in the clients' best interests and represent their views without misleading, deceiving, or otherwise impairing the clients' ability to make informed investment decisions. For more information about the FXCM's internal organizational and administrative arrangements for the prevention of conflicts, please refer to the Firms' Managing Conflicts Policy. Please ensure that you read and understand our Full Disclaimer and Liability provision concerning the foregoing Information, which can be accessed on the website.

BTCUSD potential for drop! | 23rd Mar 2022With price expected to reverse off the resistance of the stochastics indicator, we are bias that price will drop to our take profit of 36875 in line with the 127.2% Fibonacci extension from our entry of 43828 in line with the 127.2% Fibonacci extension . Alternatively, price may head to our stop loss at 45548 in line with the 161.8% Fibonacci extension.
Any opinions, news, research, analyses, prices, other information, or links to third-party sites contained on this website are provided on an "as-is" basis, as general market commentary, and do not constitute investment advice. The market commentary has not been prepared in accordance with legal requirements designed to promote the independence of investment research, and it is therefore not subject to any prohibition on dealing ahead of dissemination. Although this commentary is not produced by an independent source, FXCM takes all sufficient steps to eliminate or prevent any conflicts of interest arising out of the production and dissemination of this communication. The employees of FXCM commit to acting in the clients' best interests and represent their views without misleading, deceiving, or otherwise impairing the clients' ability to make informed investment decisions. For more information about the FXCM's internal organizational and administrative arrangements for the prevention of conflicts, please refer to the Firms' Managing Conflicts Policy. Please ensure that you read and understand our Full Disclaimer and Liability provision concerning the foregoing Information, which can be accessed on the website.

BTCUSD potential for a drop! | 22nd Mar 2022With price expected to reverse off the resistance of the stochastics indicator, we are bias that price will drop to our take profit of 36875 in line with the 127.2% Fibonacci extension from our entry of 43828 in line with the 127.2% Fibonacci extension . Alternatively, price may head to our stop loss at 45548 in line with the 161.8% Fibonacci extension .
Any opinions, news, research, analyses, prices, other information, or links to third-party sites contained on this website are provided on an "as-is" basis, as general market commentary, and do not constitute investment advice. The market commentary has not been prepared in accordance with legal requirements designed to promote the independence of investment research, and it is therefore not subject to any prohibition on dealing ahead of dissemination. Although this commentary is not produced by an independent source, FXCM takes all sufficient steps to eliminate or prevent any conflicts of interest arising out of the production and dissemination of this communication. The employees of FXCM commit to acting in the clients' best interests and represent their views without misleading, deceiving, or otherwise impairing the clients' ability to make informed investment decisions. For more information about the FXCM's internal organizational and administrative arrangements for the prevention of conflicts, please refer to the Firms' Managing Conflicts Policy. Please ensure that you read and understand our Full Disclaimer and Liability provision concerning the foregoing Information, which can be accessed on the website.

BTC/USD - weekly Analytics + Altcoins 21.03.2022Bitcoin continues to be in consolidation, which originated in January 2022, the price ascent to the current marks is a positive signal for future growth of quotations. We still believe that the cryptocurrency market has every chance for a further rise in quotations. The growth to the key resistance around 45,500 will be the confirmation of this idea. The subsequent correction pullbacks will give an opportunity to pick up conservative entry points to buy, more risky traders can enter the market from the current marks.
Altcoins:
Among altcoins, we single out ETHEREUM and TRX as the most promising projects, which can grow by times.

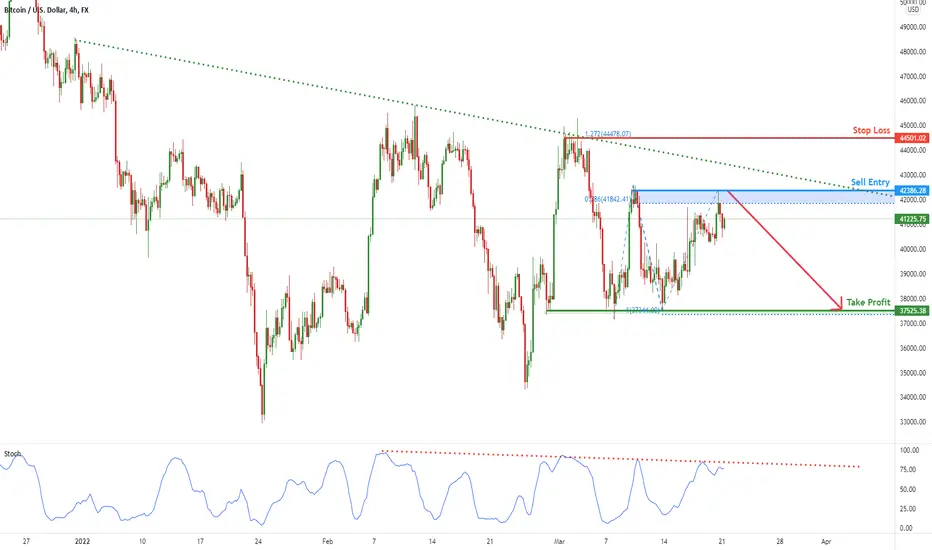
BTCUSD potential for drop!| 21st Mar 2022With price expected to reverse off the resistance of the stochastics indicator, we are bias that price will drop to our take profit of 37344 in line with the 100% Fibonacci projection from our entry of 41842 in line with the 28.6% Fibonacci retracement. Alternatively, price may head to our stop loss at 44478 in line with the 127.2% Fibonacci extension.
Any opinions, news, research, analyses, prices, other information, or links to third-party sites contained on this website are provided on an "as-is" basis, as general market commentary, and do not constitute investment advice. The market commentary has not been prepared in accordance with legal requirements designed to promote the independence of investment research, and it is therefore not subject to any prohibition on dealing ahead of dissemination. Although this commentary is not produced by an independent source, FXCM takes all sufficient steps to eliminate or prevent any conflicts of interest arising out of the production and dissemination of this communication. The employees of FXCM commit to acting in the clients' best interests and represent their views without misleading, deceiving, or otherwise impairing the clients' ability to make informed investment decisions. For more information about the FXCM's internal organizational and administrative arrangements for the prevention of conflicts, please refer to the Firms' Managing Conflicts Policy. Please ensure that you read and understand our Full Disclaimer and Liability provision concerning the foregoing Information, which can be accessed on the website.
Bitcoin missing a 5th waveEverything there is to explain is on the chart.
Ussualy we have a good run from March til arround the end of December.
I think right now the majority is bearish and don't think it will go past $70.000.
But! keep an eye out for the 100ema on the weekly, if it falls below be BEARISH.

S&P 500 Small PullbackSlight pullback- moderately risky Short. Price action turn around at fib 1.618 - 2.09935 Expansion

BTCUSD Potential bearish drop | 17th Mar 2022With price expected to reverse off the resistance of the ichimoku cloud , we have a bearish bias that price will drop from our entry of 41529 n line with the 78.6% Fibonacci retracement to our take profit area of 37816 in line with the horizontal swing low support. Alternatively, price may break our entry structure and head for our stop loss of 42960 in line with the 100% Fibonacci projection level and horizontal swing high resistance.
Any opinions, news, research, analyses, prices, other information, or links to third-party sites contained on this website are provided on an "as-is" basis, as general market commentary, and do not constitute investment advice. The market commentary has not been prepared in accordance with legal requirements designed to promote the independence of investment research, and it is therefore not subject to any prohibition on dealing ahead of dissemination. Although this commentary is not produced by an independent source, FXCM takes all sufficient steps to eliminate or prevent any conflicts of interest arising out of the production and dissemination of this communication. The employees of FXCM commit to acting in the clients' best interests and represent their views without misleading, deceiving, or otherwise impairing the clients' ability to make informed investment decisions. For more information about the FXCM's internal organizational and administrative arrangements for the prevention of conflicts, please refer to the Firms' Managing Conflicts Policy. Please ensure that you read and understand our Full Disclaimer and Liability provision concerning the foregoing Information, which can be accessed on the website.
