formed double topThe price, after the formed double top, goes down confidently.
We cannot rule out a minor correction.
BTC-USD

BTC USD BUY (BITCOIN - US DOLLAR)Hi there.
Price is moving impulsively to the upside.
Wait for the price to complete the continuation pattern that its forming and watch strong price action for buy.

Possible Bitcoin BUY1hr has created a triple bottom with this being possible 4th touch of demand. waiting for 15m bullish variation at zone to possible enter. if buy does play out more than likely a buy from 4hr lower low to lower high so technically a countertrend trade so far

A double top has formed.A double top has formed.
The price started moving down.
I expect movement to support.

BTCUSD potential for reversal | 11th FebPrice is near sell entry level of 42805.16 in line with 23.6% Fibonacci retracement and 78.6% Fibonacci projection. Price can potentially dip to the take profit level of 39895.24 in line with 50% Fibonacci retracement and 61.8% Fibonacci projection. Our bearish bias is supported by technical indicators.
Any opinions, news, research, analyses, prices, other information, or links to third-party sites contained on this website are provided on an "as-is" basis, as general market commentary, and do not constitute investment advice. The market commentary has not been prepared in accordance with legal requirements designed to promote the independence of investment research, and it is therefore not subject to any prohibition on dealing ahead of dissemination. Although this commentary is not produced by an independent source, FXCM takes all sufficient steps to eliminate or prevent any conflicts of interest arising out of the production and dissemination of this communication. The employees of FXCM commit to acting in the clients' best interests and represent their views without misleading, deceiving, or otherwise impairing the clients' ability to make informed investment decisions. For more information about the FXCM's internal organizational and administrative arrangements for the prevention of conflicts, please refer to the Firms' Managing Conflicts Policy. Please ensure that you read and understand our Full Disclaimer and Liability provision concerning the foregoing Information, which can be accessed on the website.

What is ETH thinking ??Hello dear friends
What is ETH thinking ??
It knows what it is thinking
But I think the price is going through wave 4 and the beginning of wave 5 is a downward trend.
This is my view for now. If the previous ceiling fails, this analysis will be invalid.
******Appropriate entry points for supports and resistances according to the chart*******
If you like this idea, Please Follow me and do not forget that your likes and comments are very important
Thanks dear friends.
Be generous and rich.

BTCUSD potential for further downtrend | 10th FebPrice has recently broken out of the descending trendline and is near sell entry price of 45616.03 in line with our 61.8% Fibonacci retracement. Price can potentially dip to the take profit level of 38998.53 in line with 50% Fibonacci retracement and 61.8% Fibonacci projection. Our bearish bias is supported by the stochastic indicator as it is at resistance level.
Any opinions, news, research, analyses, prices, other information, or links to third-party sites contained on this website are provided on an "as-is" basis, as general market commentary, and do not constitute investment advice. The market commentary has not been prepared in accordance with legal requirements designed to promote the independence of investment research, and it is therefore not subject to any prohibition on dealing ahead of dissemination. Although this commentary is not produced by an independent source, FXCM takes all sufficient steps to eliminate or prevent any conflicts of interest arising out of the production and dissemination of this communication. The employees of FXCM commit to acting in the clients' best interests and represent their views without misleading, deceiving, or otherwise impairing the clients' ability to make informed investment decisions. For more information about the FXCM's internal organizational and administrative arrangements for the prevention of conflicts, please refer to the Firms' Managing Conflicts Policy. Please ensure that you read and understand our Full Disclaimer and Liability provision concerning the foregoing Information, which can be accessed on the website.


Clear Wyckoff AccumulationHello everyone,
Obviously this is a short term bull trap, the similarities are incredible to the last wyckoff accumulation. Recommend opening a limit long at $31,000, with a liquidation below $30,000.
My last long (25X) at $29,000 printed massively, and was closed at $60,000, seeing the same thing here.
My entire thesis is, we’ve been trading sideways since the May crash in a large range of $29,000-$69,000. No top has been found against 2017 in USDM1, so far the shortest bull run in history (which leads me to believe an October 2022 top), no redistribution from LTH’s to STH’s, miners hodling, hashrate ATH, daily active addresses and TX count climbing, and lowest exchange liquidity I’ve ever personally seen.
The double top theory is bunk, no volume increase on the second top, and the second top was higher than the first top.
In a macro lens, I’m looking for a higher low on a yearly timeframe against $29,000, that’s why I’m thinking $30,000 bottom.
This is a massively manipulated market, I suggest reading about the composite man before you call bear or bull. And don’t forget the incoming news blitz of more countries legalizing bitcoin, companies like Apple, Google, Walmart, Amazon, etc, supporting Bitcoin. Square / Block opening fiat on / off ramps.
Top of this cycle will be $140,000 in October 2022. Expect Biden’s regulations to bring big institutional money in play- they’re chomping at the bit.
Retail traders (most of you) will continue to be wiped out. In the STH Glassnode metrics, STH’s continue selling at losses, and overall acting as exit liquidity for smart money over and over. Become smarter traders!
Happy February!

Good News for Bitcoin Medium TermIt might retest the negative price trend line but after that we can expect a strong long move.

BTC/USD - weekly Analytics + Altcoins 07.02.2022Bitcoin has developed an impulse movement, which indicates a high probability of further growth of quotations, investor pessimism is behind, there is no euphoria, which additionally indicates a medium-term continuation of the price ascent.
It is locally profitable to track corrective pullbacks to buy entry, the goal is to overcome the high of the price near $62,000.
Altcoins:
Among altcoins, we single out ETHEREUM and TRX as the most promising projects, which can grow by times.

BTC 1M, can you explain about thiswhat is happening right now is real.. but in fact what is happening is still happening.. so what do you guys think

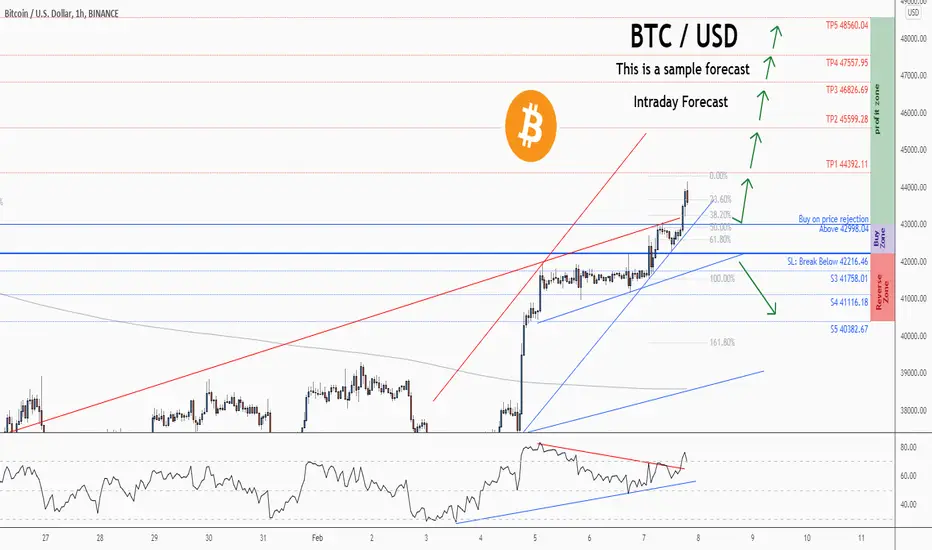
💡Don't miss the great buy opportunity in BTCUSD @BitcoinTrading suggestion:
". There is a possibility of temporary retracement to the suggested support line (42998.04).
. if so, traders can set orders based on Price Action and expect to reach short-term targets."
Technical analysis:
. BTCUSD is in an uptrend, and the continuation of the uptrend is expected.
. The price is above the 21-Day WEMA, which acts as a dynamic support.
. The RSI is at 72.
Take Profits:
TP1= @ 44392.11
TP2= @ 45599.28
TP3= @ 46826.69
TP4= @ 47557.95
TP5= @ 48560.04
SL= Break below S2
❤️ If you find this helpful and want more FREE forecasts in TradingView
. . . . . Please show your support back,
. . . . . . . . Hit the 👍 LIKE button,
. . . . . . . . . . Drop some feedback below in the comment!
❤️ Your support is very much 🙏 appreciated!❤️
💎 Want us to help you become a better Forex / Crypto trader?
Now, It's your turn!
Be sure to leave a comment; let us know how you see this opportunity and forecast.
Trade well, ❤️
ForecastCity English Support Team ❤️
💡Don't miss the great buy opportunity in BTCUSD @BitcoinTrading suggestion:
". There is a possibility of temporary retracement to the suggested support line (42998.04).
. if so, traders can set orders based on Price Action and expect to reach short-term targets."
Technical analysis:
. BTCUSD is in an uptrend, and the continuation of the uptrend is expected.
. The price is above the 21-Day WEMA, which acts as a dynamic support.
. The RSI is at 72.
Take Profits:
TP1= @ 44392.11
TP2= @ 45599.28
TP3= @ 46826.69
TP4= @ 47557.95
TP5= @ 48560.04
SL= Break below S2
❤️ If you find this helpful and want more FREE forecasts in TradingView
. . . . . Please show your support back,
. . . . . . . . Hit the 👍 LIKE button,
. . . . . . . . . . Drop some feedback below in the comment!
❤️ Your support is very much 🙏 appreciated! ❤️
💎 Want us to help you become a better Forex / Crypto trader ?
Now, It's your turn !
Be sure to leave a comment; let us know how you see this opportunity and forecast.
Trade well, ❤️
ForecastCity English Support Team ❤️

btcusdtThe falling candle that formed in the 4 hour period can be considered as a reason for further decline of bitcoins.
In the same range, I will enter the TB position with Stop Loss 44220 or 45,000 (with more risk) with a target of $ 30,000 or $ 28,800.
I am looking for another buy position in the range of 28800
If Bitcoin stabilizes above $ 45,000, we will try the buy position for the target of $ 70,000 and $ 100,000.

ATOM pt.3 BULISHHHHHHHHHHHHHHHello, as my previous posts I have been carefully watching this crypto after seeing some very interesting market structure. I believe this coin has a lot of juice left and I plan on continuing trading this.
I'm showing what I see in the price action as of now but by no means am I showing you what you should trade. DYOR
If there are any questions, feel free to shoot me a DM.

💡Don't miss the great buy opportunity in BTCUSD @BitcoinTrading suggestion:
". There is a possibility of temporary retracement to the suggested support line (38906.10).
. if so, traders can set orders based on Price Action and expect to reach short-term targets."
Technical analysis:
. BTCUSD is in a range bound, and the beginning of an uptrend is expected.
. The price is above the 21-Day WEMA, which acts as a dynamic support.
. The RSI is at 72.
Take Profits:
TP1= @ 41210.42
TP2= @ 43513.15
TP3= @ 45788.04
TP4= @ 48213.87
TP5= @ 51859.41
SL= Break below S2
❤️ If you find this helpful and want more FREE forecasts in TradingView
. . . . . Please show your support back,
. . . . . . . . Hit the 👍 LIKE button,
. . . . . . . . . . Drop some feedback below in the comment!
❤️ Your support is very much 🙏 appreciated!❤️
💎 Want us to help you become a better Forex / Crypto trader?
Now, It's your turn!
Be sure to leave a comment; let us know how you see this opportunity and forecast.
Trade well, ❤️
ForecastCity English Support Team ❤️

💡Don't miss the great buy opportunity in BTCUSD @BitcoinTrading suggestion:
". There is a possibility of temporary retracement to the suggested support line (38906.10).
. if so, traders can set orders based on Price Action and expect to reach short-term targets."
Technical analysis:
. BTCUSD is in a range bound, and the beginning of an uptrend is expected.
. The price is above the 21-Day WEMA, which acts as a dynamic support.
. The RSI is at 72.
Take Profits:
TP1= @ 41210.42
TP2= @ 43513.15
TP3= @ 45788.04
TP4= @ 48213.87
TP5= @ 51859.41
SL= Break below S2
❤️ If you find this helpful and want more FREE forecasts in TradingView
. . . . . Please show your support back,
. . . . . . . . Hit the 👍 LIKE button,
. . . . . . . . . . Drop some feedback below in the comment!
❤️ Your support is very much 🙏 appreciated! ❤️
💎 Want us to help you become a better Forex / Crypto trader ?
Now, It's your turn !
Be sure to leave a comment; let us know how you see this opportunity and forecast.
Trade well, ❤️
ForecastCity English Support Team ❤️


BTCUSD Bitcoin May See Prices Above 40,000.00 In February 2022Wait for a close above 38731.67. A close above 38731.67 will expose 41275.96 as a potential target for take profit. I am looking for a close above 38731.67 and a retest of that level for an entry. Take Profit is 41275.96.

BTC/USD - weekly Analytics + Altcoins 31.01.2022Investor sentiment is at pessimistic levels, which indicates either market lows or a near-term reversal of quotes. At the moment we consider two scenarios of the situation development:
1. an impulse ascent of the quotes from the current levels, the confirmation will be the growth above the level of $43,000.
2. renewal of the minimums around $25,000 and impulse return above $30,000, which will be the confirmation of the trend change to the bullish level.
In our opinion, the renewal of the growing trend is coming, the only question is to determine the minimums of the correction that began in April 2021.

btc further ascending or descending ???Hello dear friends
BTC further ascending or descending ???
To answer the question, we must first specify the course we want
Given the current situation and the analysis of data within the network and the chart, I think in the short term it will be bullish in the medium term if the hard resistance range is broken, otherwise it will be bullish and in the long run it will be bullish as in the past.
This analysis will be valid in my opinion as long as the price is above the trend line, but it is better for you to trade based on your vision because the market is always risky.
******Appropriate entry points for supports and resistances according to the chart*******
If you like this idea, Please Follow me and do not forget that your likes and comments are very important
Thanks dear friends.
Be generous and rich.

