BTC-USD

My trading historyWell we've been volatile these last month or so whatever, I've been catching some swing-trades but maybe the swing-trade gravy train is at-end. With bullish momentum these last few days especially as we dip into the $31,800-29,500 region as kinda not expecting reversal structure at this time. I "hope" I can close this leveraged short at some profit and ride the remaining 95% of my portfolio to the upside.
But we may never know! Drink more alcohol!


$BTCUSDT UPDATE!!!!Hi Traders,
So we got two rejections of the $33,000 resistance level. Prices are now looking like they're going into a short term range, a break in either direction of the range will indicate to us which path $BTC will want to take for the short term and in doing so dictate the direction of the ALT market. There has been a slow down as seen from the gradient decrease of the chart. However, higher lows are still forming and prices are still rejection the support zone that its currently in. As it stands we're still bullish unless we get a strong break lower past the range and support zone.
Thanks
MS
⬇️⬇️⬇️⬇️⬇️⬇️⬇️⬇️⬇️⬇️⬇️⬇️⬇️⬇️⬇️⬇️⬇️⬇️⬇️⬇️⬇️⬇️⬇️⬇️⬇️⬇️⬇️⬇️⬇️⬇️⬇️⬇️⬇️⬇️⬇️⬇️⬇️⬇️⬇️⬇️⬇️⬇️⬇️⬇️⬇️⬇️⬇️⬇️⬇️⬇️⬇️⬇️⬇️⬇️⬇️⬇️⬇️⬇️⬇️⬇️⬇️⬇️⬇️⬇️⬇️⬇️⬇️⬇️


$BTCUSDT UPDATE!!!!!Hi Traders,
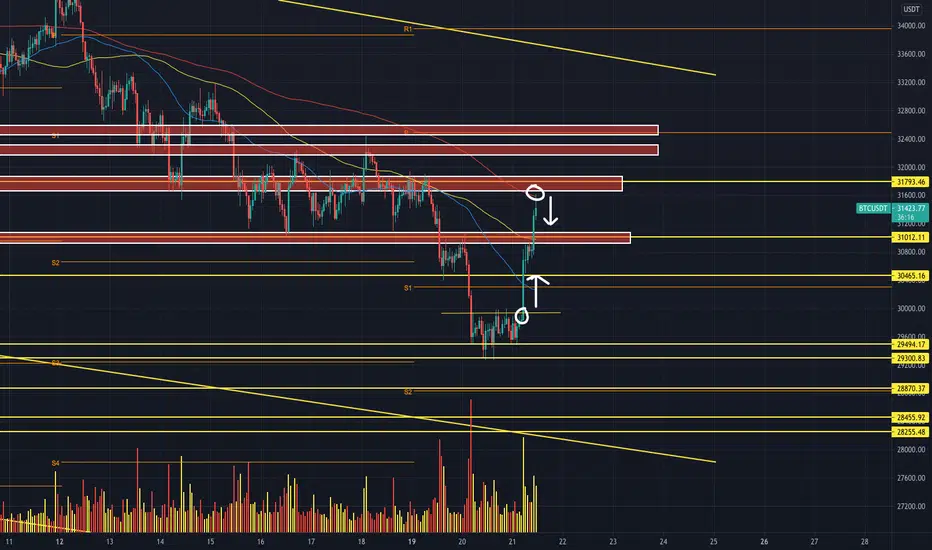
So $BTC prices were seen to be in a range last night where they then broke above and have pushed through some past support zones now as resistance. We are now rejecting the 200MA on the hourly timeframe. We would like to see short term fall in prices to test the $31,000 key level as support for prices to then push higher again tot eh $31,000 level or potentially higher into he two smaller zones at the top of the chart.
Thanks
MS
⬇️⬇️⬇️⬇️⬇️⬇️⬇️⬇️⬇️⬇️⬇️⬇️⬇️⬇️⬇️⬇️⬇️⬇️⬇️⬇️⬇️⬇️⬇️⬇️⬇️⬇️⬇️⬇️⬇️⬇️⬇️⬇️⬇️⬇️⬇️⬇️⬇️⬇️⬇️⬇️⬇️⬇️⬇️⬇️⬇️⬇️⬇️⬇️⬇️⬇️⬇️⬇️⬇️⬇️⬇️⬇️⬇️⬇️⬇️⬇️⬇️⬇️⬇️⬇️⬇️⬇️⬇️⬇️
BTC ... Following up on a CRITICAL MOVEEvening all!
Back again - A follow up on our thoughts from yesterdays video, be sure to check that one out!
Tonight we're looking to see if this Demand is destined to be broken ....
What do you all think??

$BTCUSDT UPDATE!!!!Hi Traders,
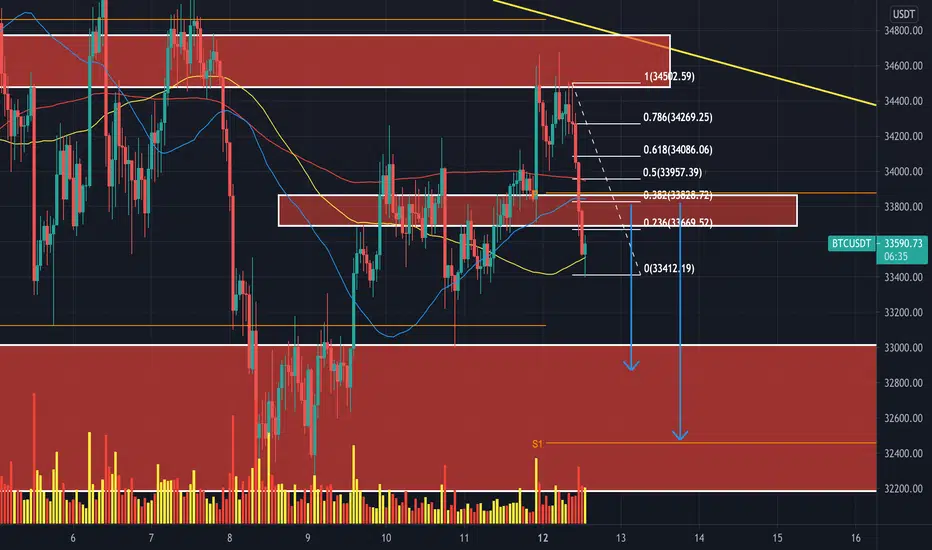
So on our last $BTC post we explained that prices would continue to make this way down towards the bottom of the channel and thats exactly what's happened over night. Prices still looking extremely bearish with very little buy volume entering the market as of yet.
We will be looking for a pullback in prices towards the zone where the 0.382 FIB can also been seen. if buy volume presents itself we could see an overshoot to the 0.618 FIB where theres a key level to be tested as resistance.
The next stop for $BTC prices once a break of the lower low is made will be the bottom of the channel after that $24,000-$20,000 has a large block where liquidity can be captured for prices to push back up.
Thanks
MS
⬇️⬇️⬇️⬇️⬇️⬇️⬇️⬇️⬇️⬇️⬇️⬇️⬇️⬇️⬇️⬇️⬇️⬇️⬇️⬇️⬇️⬇️⬇️⬇️⬇️⬇️⬇️⬇️⬇️⬇️⬇️⬇️⬇️⬇️⬇️⬇️⬇️⬇️⬇️⬇️⬇️⬇️⬇️⬇️⬇️⬇️⬇️⬇️⬇️⬇️⬇️⬇️⬇️⬇️⬇️⬇️⬇️⬇️⬇️⬇️⬇️⬇️⬇️⬇️⬇️⬇️⬇️⬇️

BTC/USD - weekly Analytics + Altcoins 19.07.2021Bitcoin continues to stay in the correction to the impulse from 26.06.2021. The key level for overcoming and development of the upward movement is 33.350, an increase above it will increase the chances of a further ascent. Investor sentiment is on the pessimistic levels, which increases the chances for the growth of quotations.
Altcoins:
TRON and HIVE are the most promising coins for the development of a stable growing trend.

BTC ... Is a BIGGER MOVE LOOMING???Evening all!
Back again after a few days off - I must say we're enjoying being on Tradingview, there is certainly a lot of you!
Tonight we're looking at the bigger picture, was can we expect to see and what we think might happen long term.
We back that up with some lower timeframe analysis.
Let us know what you think !

$BTCUSDT UPDATE!!!!Hi Traders,
So we got some restructuring over the weekend and now started to see a fall in prices from a rejection of the confluence zone seen on our chart. Prices are now heading back towards the bottom zone where its already rejected, indicating to us that more liquidity needs to be grabbed before making a push higher. We can expect prices to continue to fall down and make their way towards the bottom of the channel. Expect prices to fall across the whole board.
We are planned and ready to send out the next wave of signals, so keep your eyes peeled.
Thanks
MS
⬇️⬇️⬇️⬇️⬇️⬇️⬇️⬇️⬇️⬇️⬇️⬇️⬇️⬇️⬇️⬇️⬇️⬇️⬇️⬇️⬇️⬇️⬇️⬇️⬇️⬇️⬇️⬇️⬇️⬇️⬇️⬇️⬇️⬇️⬇️⬇️⬇️⬇️⬇️⬇️⬇️⬇️⬇️⬇️⬇️⬇️⬇️⬇️⬇️⬇️⬇️⬇️⬇️⬇️⬇️⬇️⬇️⬇️⬇️⬇️⬇️⬇️⬇️⬇️⬇️⬇️⬇️⬇️

S#1TCOIN is a SCAMI have never been a fan of Bitcoin for many reasons and now technical analysis is telling me price could fall much lower if we break 29000 support, to me this is the key level that if broke could spell the end for this silly hype coin.
I think this was just a scam coin promoted by the likes of Musk and his friends to make them rich before they sell and run to the bank with your money! It has almost become like a cult coin, people have been brainwashed into buying it by the cult leaders. Its just funny how price has halved since hitting all time highs only 3 months ago.
Don't shoot me, these are just my views.
SELL SELL SELL.

BTC/USDT 1DCritical days for BTC. RSI exited below the red line, we touched the daily close and the ATR ( not present on the chart ) is at its lowest since 5 of January. Critical days for BTC...

$BTCUSDT MACRO ANALYSIS!!!Hi Traders,
So we thought it would be a good idea to take more of a macro stance on $BTC price action.
So you can see that we got a rejection of resistance where a white circle has been drawn where we it kick started the most recent sell off. Where then prices found support and pushing slightly higher. As things stand $BTC still looks extremely bearish in the longterm if it fails to break resistance levels and zones.
There are two key levels beneath ($30,000 + $27,300) which if prices break those levels it'll take us down to an order block ($24,000-$22,000) where theres plenty of liquidity to grab, this is where prices are likely to find support once broken out of the downward trending channel.
Following that order block you can see another 3 smaller order blocks below.
Thanks
MS
⬇️⬇️⬇️⬇️⬇️⬇️⬇️⬇️⬇️⬇️⬇️⬇️⬇️⬇️⬇️⬇️⬇️⬇️⬇️⬇️⬇️⬇️⬇️⬇️⬇️⬇️⬇️⬇️⬇️⬇️⬇️⬇️⬇️⬇️⬇️⬇️⬇️⬇️⬇️⬇️⬇️⬇️⬇️⬇️⬇️⬇️⬇️⬇️⬇️⬇️⬇️⬇️⬇️⬇️⬇️⬇️⬇️⬇️⬇️⬇️⬇️⬇️⬇️⬇️⬇️⬇️⬇️⬇️

$BTCUSDT UPDATE!!!Hi Traders,
Picking up from where we left off on our last $BTC post. We depicted the two zones of support once prices broke lower..... prices came down perfectly to the first zone of support which saw a good push back up in prices.
The price increase brought us to an order block where you can see it rejected as resistance (circled in white). We will now want to see a rejection of support from the zone lower, where the 0.382 FIB is drawn for prices to continue to push higher and into the higher zones where you can see the arrows drawn into.
Thanks
MS
⬇️⬇️⬇️⬇️⬇️⬇️⬇️⬇️⬇️⬇️⬇️⬇️⬇️⬇️⬇️⬇️⬇️⬇️⬇️⬇️⬇️⬇️⬇️⬇️⬇️⬇️⬇️⬇️⬇️⬇️⬇️⬇️⬇️⬇️⬇️⬇️⬇️⬇️⬇️⬇️⬇️⬇️⬇️⬇️⬇️⬇️⬇️⬇️⬇️⬇️⬇️⬇️⬇️⬇️⬇️⬇️⬇️⬇️⬇️⬇️⬇️⬇️⬇️⬇️⬇️⬇️⬇️⬇️

BULLS UNDER BEARS ON TOP - Wait for confirmationBulls (orange upward trend) and bears (black downward trend) are coming together..... i expect an explosive move in the coming days / week
await confirmation before placing trade
get above blue target 33.380 to continue the uptrend failing this support down to 32-31K
Please give this a thumbs up if you like the work

Bitcoin 7.13We are looking for a retracement into the .382 at 47k. I expect price to start turning here around 32000

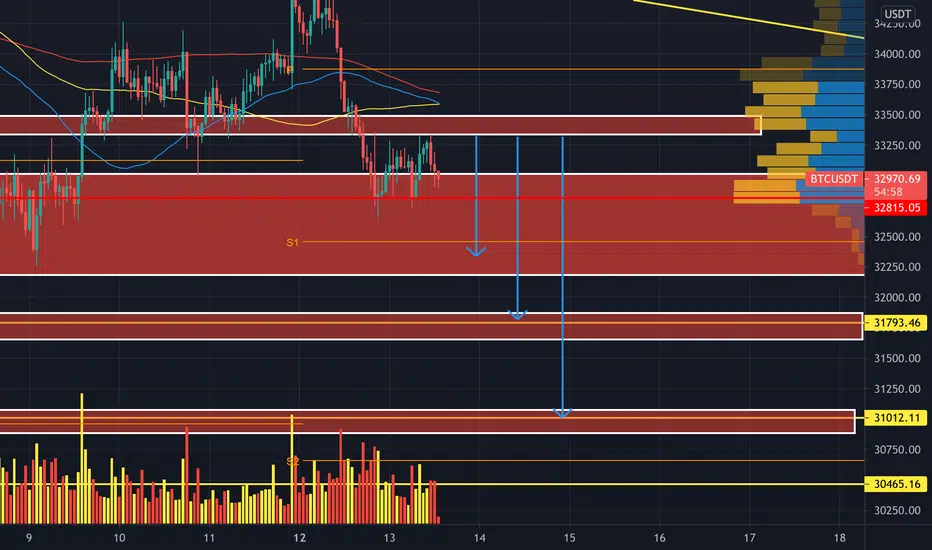
$BTCUSDT UPDATE!!!Hi Traders,
We're picking up on where we left off on our last post so if you have not read the previous post please click the linked post to this to catch up.
So prices have tested and rejected the top confluence zone and are now pushing lower. If we are able to break the last lower lows then we will be looking for support at the bottom of the biggest order block $32,000 roughly. If we are able to break this level as support then the lower two order block zones will be the next areas where we will be looking for a reversal.
Thanks
MS
⬇️⬇️⬇️⬇️⬇️⬇️⬇️⬇️⬇️⬇️⬇️⬇️⬇️⬇️⬇️⬇️⬇️⬇️⬇️⬇️⬇️⬇️⬇️⬇️⬇️⬇️⬇️⬇️⬇️⬇️⬇️⬇️⬇️⬇️⬇️⬇️⬇️⬇️⬇️⬇️⬇️⬇️⬇️⬇️⬇️⬇️⬇️⬇️⬇️⬇️⬇️⬇️⬇️⬇️⬇️⬇️⬇️⬇️⬇️⬇️⬇️⬇️⬇️⬇️⬇️⬇️⬇️⬇️
$BTCUSDT UPDATE!!!Hi Traders,
So we got a rejection of the top order block over the weekend which gave us less than average volume with a spike in volume yesterday which took us to the top order block.
We are expecting prices to pull back slightly towards the middle order block where it will reject as resistance and then for the sell off to continue to the lower order block zone.
If sellers come in strong and fast we could be seeing a larger than expected sell off taking us to the bottom of the current channel it is trading within where we would have to reassess the strength of the move for a potential breakout lower of the channel.
Thanks
MS
⬇️⬇️⬇️⬇️⬇️⬇️⬇️⬇️⬇️⬇️⬇️⬇️⬇️⬇️⬇️⬇️⬇️⬇️⬇️⬇️⬇️⬇️⬇️⬇️⬇️⬇️⬇️⬇️⬇️⬇️⬇️⬇️⬇️⬇️⬇️⬇️⬇️⬇️⬇️⬇️⬇️⬇️⬇️⬇️⬇️⬇️⬇️⬇️⬇️⬇️⬇️⬇️⬇️⬇️⬇️⬇️⬇️⬇️⬇️⬇️⬇️⬇️⬇️⬇️⬇️⬇️⬇️⬇️
BTC/USD - weekly Analytics + Altcoins 12.07.2021Once again, the price is forming a false-break from the resistance level near 33.500 and continues to trade within the consolidation. The growth of quotations towards 37,000 will increase the chances for further growth. The pessimism of investors that has been lasting since mid-May is an additional confirmation of the future uptrend.
Altcoins:
TRON and HIVE stand out as the most promising coins to develop a sustainable rising trend.

Bitcoin to $43,500 by July 23-25(Changing my initial lines) Fundamentally bitcoin supply is being taken off exchanges at high levels, inflation, El Salvador news, more companies buying in etc. We had no blow off the top indicating an end to the bull market post 2020 halving. We have consolidated for a few months now perhaps bitcoin is ready for its next move higher. The TA is a classic ascending triangle with a price target 43.5K by July 23-25.
Please follow me as a it can’t hurt. Ty!
